Flow cytometry (FCM) is an efficient technology for cell identification and sorting. One of the most prominent advantages of FCM is the ability to label and identify multiple target biomarkers using different fluorochromes. In order to make the result accurately and reliably, it is important to optimize the panel design which refers to determining the fluorochrome assign to each biomarker to make the detection signal strong, resolved with low interference as far as possible. A complete panel design generally involves the following aspects: selection and analysis of detection biomarkers, analysis of instrument configurations and fluorochromes, and the basic pairing principles.
Table of Contents
1. How to make the selection and analysis of detection biomarkers
2. How to make the analysis of instrument configurations and fluorochromes
3. What is the basic pairing principle of panel design
01 How to make the selection and analysis of detection biomarkers
1.1 Selecting biomarkers
In flow cytometry experiments, cells were identified by the characteristic proteins they expression, so first of all, it is important to make sure that which protein (biomarkers) will be detected for the assay. It is not hard to search for the typical biomarkers from literatures, examples include CD3 for T cells, CD4 and CD8 for Th and Tc cells respectively, and CD25 and Foxp3 for Treg cells.
Some of the common biomarkers can be used for all species, while some biomarkers with species-specificity must be noticed. For example, mouse macrophages are typically identified with F4/80 and CD11b, while human macrophages do not express F4/80 and require CD68 and CD11b instead.
1.2 Location of biomarker expression
After biomarker list has been selected, it is necessary to make a further analysis for their characteristics to optimize the panel design.
The location of expression must be determined. The surface-expressed biomarkers can be stained directly on live cells without additional processing. While the staining of intracellular biomarkers like lysosomal membrane proteins, secreted cytokines, transcription factors and so on requires cell fixation and permeabilization operation before staining with antibodies.
Since the epitopes of surface protein may be damaged by fixation reagent, it is recommended to separate the staining of surface biomarkers and intracellular biomarkers by fixation and permeabilization process.
1.3 Abundance of biomarker expression
The abundances of biomarkers are also important for panel design. Biomarkers with high abundance and strong positive signal could be the best choice of cell labeling, it is easy to get a separated and concentrated positive peak.
The heterogeneous biomarkers might also be high abundance, sometimes with a significant positive peak, but did not separated from the negative signal, make it a little harder to gate the target. For this kind of situation, a qualitative analysis is usually possible to be taken with antibodies only, but accurate quantification requires isotype controls.
Biomarkers with low abundance are hardly to be detected, reliable analysis typically depends entirely on isotype controls.
,%20hetrogenous%20(like%20CD45RA)%20and%20low%20abundance%20(like%20CD25)%20biomarkers_.png)
Fig. 1 Characteristics of high abundance (like CD4), heterogenous (like CD45RA) and low abundance (like CD25) biomarkers.
1.4 Relationship between biomarkers
It is necessary to determining the relationship between biomarkers. Some of the biomarkers are mutually exclusive that they will never exist in the same cell, for example CD4 is the key marker for Th cells while CD8 is for Tc cells, either cells will express only one of them.
But the things become different between CD3 and CD4, as CD3 is expressed in all T cells, which means all CD4 positive cells will express CD3. In this situation, CD3 can be regarded as a parent-marker, and CD4 is called sub-marker.
Another relationship is called co-expression, which means the target cells must express both markers simultaneously (e.g., CD25 and Foxp3 for Treg identification).
,%20parent%20and%20sub-marker%20(CD3%20and%20CD4),%20co-expression%20markers%20(CD25%20and%20Foxp3)_.png)
Fig. 2 Different relationship between biomarkers: mutually exclusive (CD4 and CD8), parent and sub-marker (CD3 and CD4), co-expression markers (CD25 and Foxp3).
02 How to make the analysis of instrument configurations and fluorochromes
2.1 Instrument configuration
Instrument configuration is essential for panel design. In theory, the number of instrument channels determines the maximum number of targets and their band ranges determines the fluorochromes that can be used. If the number of biomarkers is no more than the number of channels, all biomarkers could be detected in one assay, one fluorochrome can be assigned from each channel to be used. Otherwise, the experiment must be split into multiple panels until the number of biomarkers is fewer than that of available channels in each panel.
2.2 Brightness of fluorochromes
Additional relevant information of fluorochromes is also needed to make an optimal panel.
Brightness is one of the most important properties. For a given target, brighter fluorochromes produce stronger signals and improve data resolution and cell identification. In panel design, prioritize bright fluorochromes such as PE, APC, PE Cy7, and FITC.
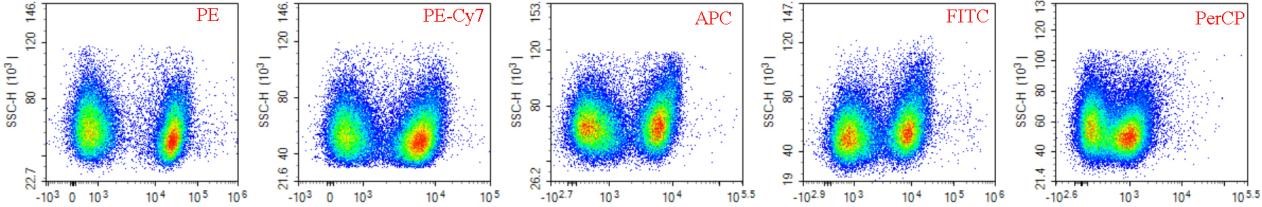
Fig. 3 Effect of fluorochrome brightness: CD40 were labeled by different kinds of fluorochromes from bright (PE) to dim (PerCP), with brighter fluorochrome, comes larger distance between positive and negative population.
2.3 Chemical properties of fluorochromes
Another factor is to follow the chemical property of fluorescence. Some conjugated fluorochromes (such as PE-Cy5 and APC-Cy7) are prone to fluorescence quenching or spectral shifts after fixation. They are not recommended for surface targets when samples require subsequent fixation and permeabilization.
Table 1. Characteristics of some specific fluorochrom
|
Fluorescence |
Characteristics |
|
FITC |
Easily affected by pH value. The fluorescence intensity will be decreased significantly in low pH value. |
|
Elab Fluor® 488 |
Resistant to light and remains stable in wide range of pH (pH 4-10). |
|
PE |
High brightness, relatively stable. |
|
APC |
High brightness, less stable than PE. |
|
PE-Cyanine5 |
High brightness, easy to quench. Unstable with fixation. |
|
PE-Cyanine7 |
High brightness, easy to quench. Unstable with fixation. |
|
APC-Cyanine7 |
Dim. Unstable with fixation. |
|
PerCP-Cy5.5 |
Moderate brightness. Relatively stable with fixation (only used for labeling biomarkers with high abundance). |
|
Elab Fluor® 780 |
Dim (brighter than APC-Cy7). Suitable for fixation. |
2.4 Spectrum and spillover
The third thing is about the spectrum, especially the emission spectrum. The emission wavelength of fluorescence will range in a large period, leading to fluorescence spillover, signal of a fluorochrome leaks into other channels, causing false positives. A spectrum viewer could be applied for overlap analyzing.
The process of compensation adjustment can reduce errors but decreases resolution and complicates analysis, so it is better to minimized the spillover by selecting fluorochromes with minimal spectral overlap, widely separated detection channels or different excitation lasers.
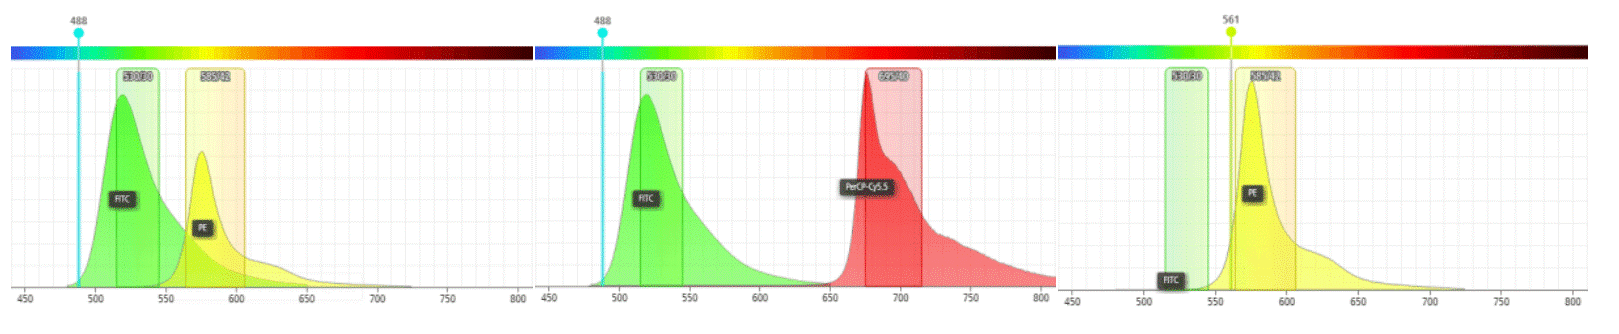
Fig. 4 Spectrum and Spillover: spillover can be obtained between FITC and PE when exciting with 488 nm laser (left); the spillover can be avoided by using FITC and PerCP-Cy5.5 (middle), or using 561 nm laser for PE excitation (right).
03 What is the basic pairing principle of panel design
After the list of biomarkers and fluorochromes had been selected, and all the characteristics and properties were cleared, it is time to pair up the biomarkers and fluorochromes by following principles.
First of all, the suitability of staining protocols. It is not recommended to use conjugated fluorochromes to the surface biomarkers when fixation and permeabilization process exist, as this may cause experiment failure.
Moreover, the biomarkers with low abundance must be labeled by fluorochromes with high brightness in order to make the signal strong enough. For the biomarkers with high abundance, some moderate or dim fluorochromes are bright enough for staining.
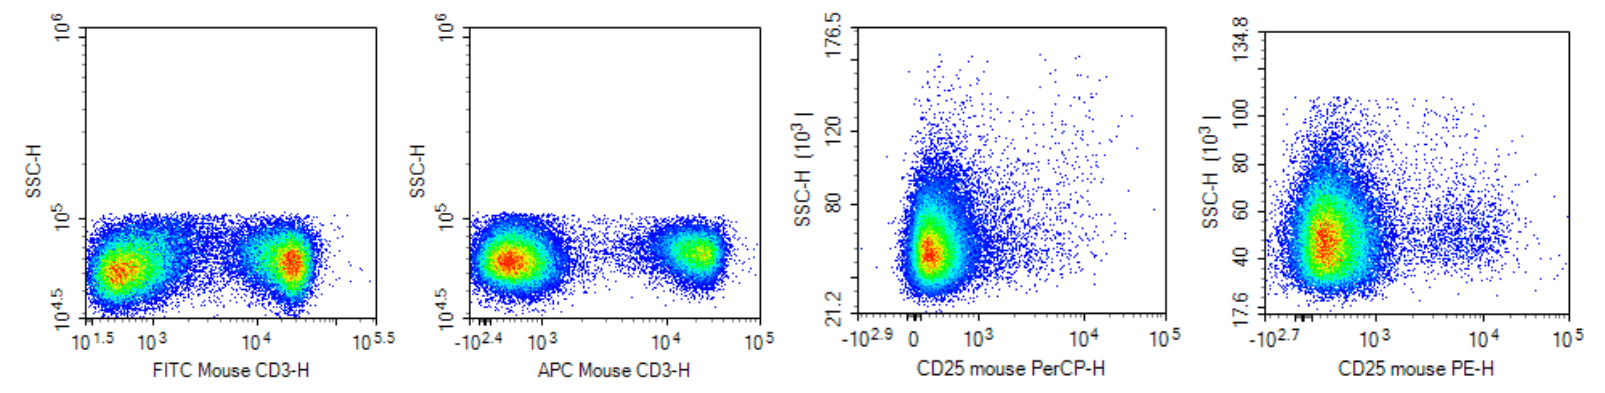
Fig. 5 Abundance and brightness: biomarkers with high abundance (e.g. CD3) can be labeled by either bright (APC) or dim (FITC) fluorochromes; biomarkers with low abundance (e.g. CD25) must be labeled by fluorochrome with high brightness (e.g. PE), if the fluorochrome is not bright enough (e.g. PerCP), no significant positive signal can be observed.
In addition, it is better to minimize the fluorochromes spillover by assigning low expression targets to channels with low interference, and labeling the critical targets with the brightest fluorochromes.
Finally, if interference were inevitable, it is better to manage the spillover by pairing highly overlapping fluorochromes with mutually exclusive biomarkers, and direct spillover from sub-marker to parent-marker, while avoid overlap between fluorochromes for co expressed targets as far as possible.
In fact, it is hardly to make a perfect panel design, especially when the number of detection channels is exactly sufficient to meet the experimental requirements. One can only optimize and make a suitable panel design as much as possible based on the actual situation.
A panel design service can be provided by Elabscience®, helping you with most of the panel design problems.

