As biological research enters the gene era, the application of transfection technology is more and more extensive. In this process, green fluorescent protein (GFP) tag is usually introduced to verify whether the transfection is successful.
In the previous article, we have mentioned the problem of panel design many times. Today, this article will show you how to design the panel and analyze the results of GFP-tagged cells in the detection of apoptosis by flow cytometry.
1. how to choose the right kit
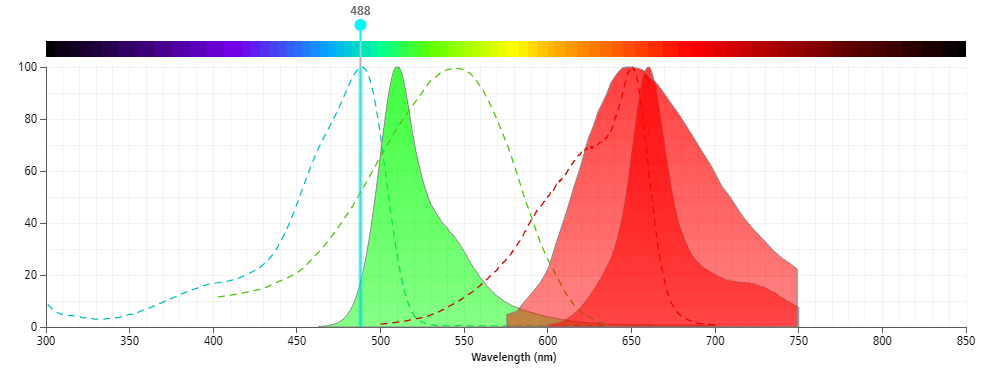
When choosing a kit, you need to choose a fluorescence combination with less interference. The excitation/emission wavelength of GFP is 488/510 nm, and usually the detection channel is FL1 in flow cytometry. Therefore, we cannot choose apoptosis detection kits with fluorescence as FL1 detection channel, such as Elab Fluor® 488, FITC, EGFP, etc.
Here, the fluorescence combination recommended for comparison is Annexin-V APC/7-AAD. The excitation/emission wavelength of APC is 650/660 nm, and that of 7-AAD is 546/650 nm, which can reduce the interference caused by GFP well and make the analysis of the results more accurate.
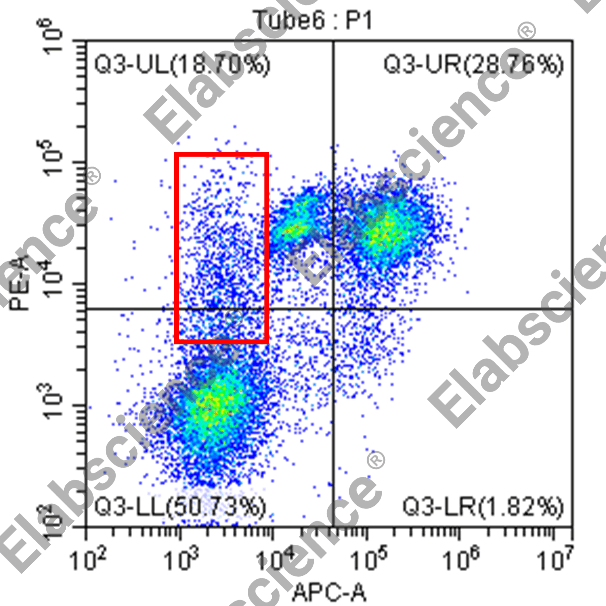
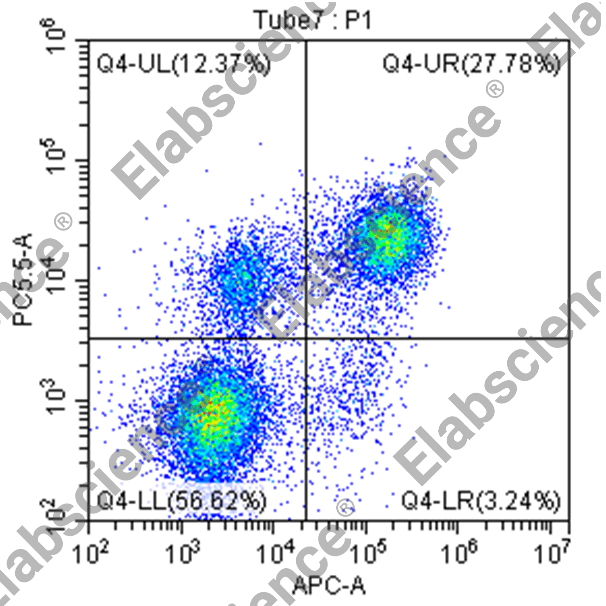
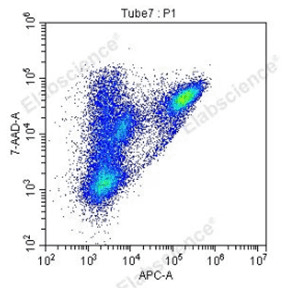
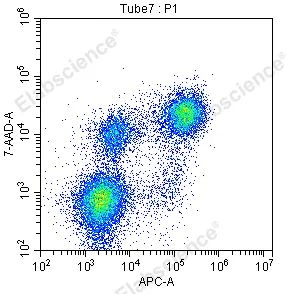
EGFP-transfected Juakat cells were treated with 10 μM Camptothecin for 24 h, and detected by Annexin V-APC/PI (left picture) and Annexin V-APC/7AAD (right picture), respectively. As can be seen from the figure, the high expression of GFP in the left picture overlaps more with the PI spectrum, resulting in a cell population that cannot be regulated by compensation (the area shown in the red box), while the right picture can present a good cell population by reasonable adjustment of compensation.
2. How to analyze the results
After choosing the right kit for the detection, the appropriate result analysis is also crucial for the perfect presentation of the data. Take the previous data as an example, let's see how to analyze it:
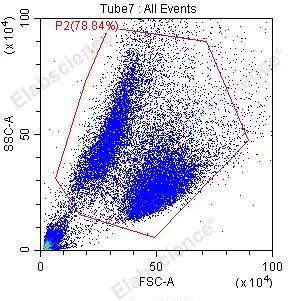
a) Set the FSC/SSC gate
According to the size and granularity, circle the cell population to be analyzed to exclude the influence of debris and adhesions;
b) Adjust fluorescence compensation
Through the fluorescence spectrum map, it can be seen that the overlap area between the Annexin-V APC/7AAD combination and the GFP spectrum is small, but there is still some overlap. In order to make the results more accurate, fluorescence compensation adjustment is needed.
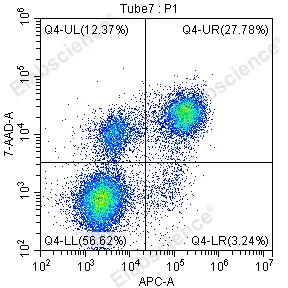
c) Delimit the cross gate to get the final apoptosis result
After the above steps, it can be seen from the figure that the final experimental result is relatively ideal.
In conclusion, the following points should be noted for flow apoptosis detection of cells with GFP fluorescence:
- Select the detection kit with less fluorescence interference;
- Reasonable delimiting of the gate;
- Adjust fluorescence compensation correctly.
Elabscience® related product recommendation: Annexin V Apoptosis Detection Kits
Elabscience® Flow Cytometry Antibodies Features (← Click to view)
Multi-color optional: up to 13 fluorescent markers, suitable for more experimental protocols
Cost-Effective: Small package,only need $15-60
Adequate inventory: conventional antibody, spot stock, delivery within 24 hours
High-quality: derived from classical cloning, the third generation of non-destructive labeling process, grouping is obvious

