Mitochondria are essential for energy metabolism and signal transduction in eukaryotic cells, and their dysfunction is linked to neurodegenerative diseases, metabolic disorders, cancer, and aging. Given their central role in cell fate, how can we accurately assess mitochondrial functional status?
Precise mitochondrial function assays are critical for both basic research and drug discovery. Among available methods, fluorescence‑based techniques stand out for their high sensitivity, real‑time monitoring capability, and spatial resolution.

Fig. 1 Common methods for assessing mitochondrial structure and function[1].
Table of Contents
1. Five core indicators for assessing mitochondrial function
2. Advantages of fluorescence-based mitochondrial function assays
3. Recommended fluorescent assay kits for mitochondrial research
01 Five core indicators for assessing mitochondrial function
Mitochondrial function is complex and requires multidimensional evaluation. The five assays described below cover key functional parameters and are widely used in research.
1.1 Energy Output Assessment: ATP Production Assay
Principle
Based on the firefly luciferase–luciferin system, ATP serves as the substrate to drive oxidative luminescence. The chemiluminescent signal is proportional to ATP concentration, directly reflecting mitochondrial energy production efficiency.
Method
Using an ATP assay kit, you can quickly and sensitively quantify ATP in cell lysates or isolated mitochondrial samples. An ATP standard curve enables absolute quantification. The procedure is straightforward and reliable.
_.png)
Fig. 2 ATP content measured in multiple cell lines using an ATP assay kit (E-BC-F300).
1.2 Oxidative Stress Assessment: Reactive Oxygen Species (ROS) Detection
Classic Probe – DCFH-DA
DCFH-DA is the most widely used general ROS indicator. Its working mechanism is as follows:
Entry into cells: Non-fluorescent DCFH-DA crosses the cell membrane.
Hydrolysis and retention: Intracellular esterases hydrolyze DCFH-DA to DCFH, which is retained inside cells.
Oxidation and fluorescence: DCFH is oxidized by ROS (e.g., H2O2、•OH) to generate green-fluorescent DCF.
Fluorescence intensity can be measured using a fluorescence microplate reader, flow cytometer, or fluorescence microscope to semi-quantitatively compare ROS levels across treatment groups.
Considerations
DCFH responds to a broad range of ROS species (low specificity). Control incubation time and dye concentration carefully, and include appropriate positive/negative controls to ensure reproducibility.
1.3 Inner Membrane Integrity Assessment: Mitochondrial Membrane Potential(ΔΨm)Detection
Significance
ΔΨm is the core proton-motive force driving ATP synthesis and a key indicator of mitochondrial health, abnormalities in membrane potential typically indicate mitochondrial damage.
Representative Dye – JC-1
JC-1 exhibits distinct fluorescence properties depending on ΔΨm, making interpretation straightforward:
Table 1. Fluorescence characteristics of JC-1 dye under different mitochondrial membrane potential (ΔΨm) states
|
Mitochondrial State |
ΔΨm Level |
JC-1 Form |
Fluorescence |
Emission Max |
|
Healthy |
High |
J-aggregates |
Red |
~590 nm |
|
Impaired |
Low |
Monomers |
Green |
~529 nm |
Data Analysis
Quantify ΔΨm changes by calculating the red/green fluorescence intensity ratio. A decreased ratio indicates mitochondrial depolarization, commonly seen in early apoptosis or mitochondrial injury.
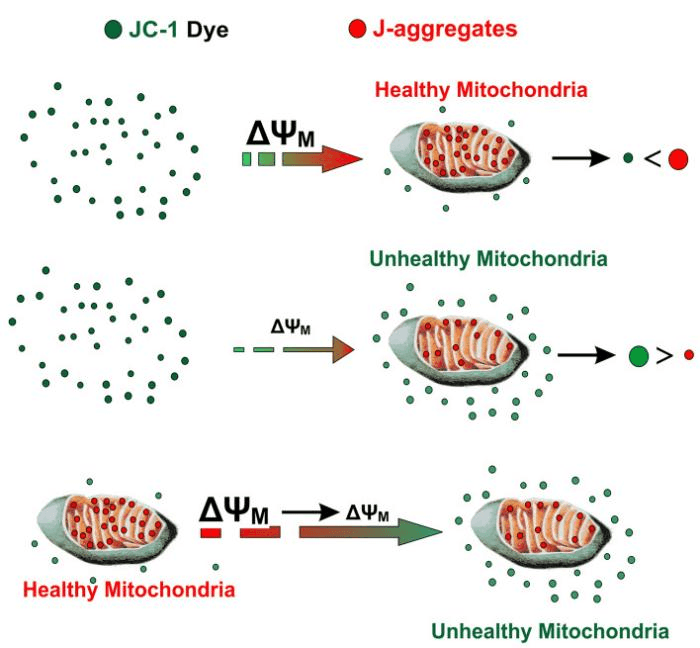
Fig. 3 Principle of JC-1 detection[2].
1.4 Pore Opening Assessment: Mitochondrial Permeability Transition Pore (mPTP) Detection
Core Method
Calcein-AM quenching method – simple to perform and relatively specific.
Principle
Cells are loaded with Calcein-AM, which is hydrolyzed by intracellular esterases to the green-fluorescent dye calcein. Cobalt ions (Co2+) are then added to quench calcein in the cytosol.
Interpretation
mPTP closed (normal state): Calcein inside mitochondria is protected; fluorescence remains stable.
mPTP open (damaged state): Co2+ enters the mitochondrial matrix and quenches internal calcein, leading to fluorescence decay.
Monitoring the kinetics of fluorescence decay directly reflects the degree of mPTP opening, making this a key tool for studying the mitochondrial apoptosis pathway.
%20(1%C3%97Calcein,%201%C3%97CoCl2,%201%C3%97Ionomycin)_.png)
Fig. 4 Fluorescence microscopy data of HeLa cells using an mPTP assay kit (E-BC-F064) (1×Calcein, 1×CoCl2, 1×Ionomycin).
1.5 Respiratory Function Assessment: Oxygen Consumption Rate (OCR) Detection
Principle
By real-time monitoring of dissolved oxygen concentration in a sealed micro-chamber, OCR directly reflects cellular or mitochondrial respiratory function – higher oxygen consumption indicates more active mitochondria.
Technical Highlights
Uses an oxygen‑sensitive phosphorescent probe whose phosphorescence lifetime/intensity is inversely proportional to oxygen partial pressure. As cells consume oxygen, the probe’s phosphorescence signal increases. A fluorescence microplate reader records the signal in real time to calculate OCR. By adding metabolic inhibitors such as oligomycin, FCCP, and rotenone/antimycin A, you can further resolve parameters including basal respiration, ATP‑linked oxygen consumption, and maximal respiratory capacity – enabling detailed profiling of mitochondrial respiratory function.
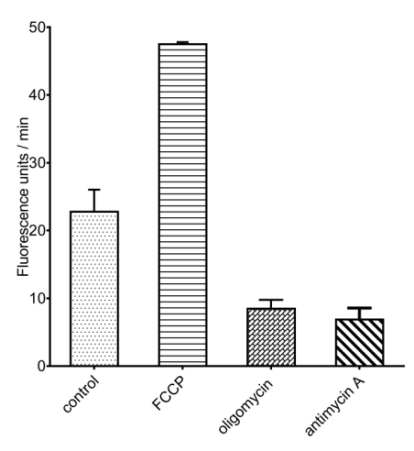
Fig. 5 OCR measured in A549 cells using a fluorometric OCR assay kit (E-BC-F070) after treatment with 2 μM FCCP, 1 μM oligomycin, or 1 μM antimycin A.
02 Advantages of fluorescence-based mitochondrial function assays
Compared to traditional biochemical and colorimetric methods, fluorescence assays offer unique advantages for mitochondrial assessment, making them well suited for research and drug development:
Ultra‑high sensitivity
Detects changes at the nmol or even pmol level, capturing subtle mitochondrial abnormalities.
Real‑time dynamic monitoring
Continuously and non‑invasively records kinetic processes in living cells, avoiding artifacts from cell lysis.
High spatial resolution
Using confocal microscopy, enables localization and quantification of signals in single cells or even individual mitochondria.
Multiplexing capability
By employing probes with distinct emission spectra, multiple parameters can be measured simultaneously in a single experiment (e.g., ΔΨm and ROS, or Ca2+ and ROS), improving experimental efficiency.
High‑throughput screening compatibility
Compatible with 96‑well plate formats, meeting the demands of large‑scale drug screening.
03 Recommended fluorescent assay kits for mitochondrial research
Table 2. Fluorescent assay products for mitochondrial function analysis
|
Cat. No. |
Product Name |
|
E-BC-F300 |
ATP Assay Kit |
|
E-BC-F070 |
Enhanced Oxygen Consumption Rate (OCR) Fluorometric Assay Kit |
|
E-BC-F100 |
Fluo-4 Calcium Fluorometric Assay Kit |
|
E-CK-A403 |
MitoBright Deep Red Probe Assay Kit |
|
E-CK-A401 |
MitoBright Green Probe Assay Kit |
|
E-CK-A402 |
MitoBright Red Probe Assay Kit |
|
E-CK-A301 |
Mitochondrial Membrane Potential Assay Kit (with JC-1) |
|
E-BC-F064 |
Mitochondrial Permeability Transition Pore (mPTP) Fluorometric Assay Kit |
|
E-BC-F008 |
Mitochondrial Superoxide Fluorometric Assay Kit |
|
E-BC-K138-F |
Reactive Oxygen Species (ROS) Fluorometric Assay Kit (Green) |
|
E-BC-F005 |
Reactive Oxygen Species (ROS) Fluorometric Assay Kit (Red) |
With high sensitivity, real‑time monitoring, and spatial resolution, fluorescence‑based detection has become a core tool for mitochondrial functional assessment. The five assays described (ATP, ROS, membrane potential, mPTP, and OCR) provide a multidimensional view of energy output, oxidative stress, membrane integrity, and respiration, capturing even subtle functional abnormalities.
In drug discovery, these assays enable target validation, hit screening, mechanism studies, preclinical safety assessment, and pharmacodynamic evaluation, supporting breakthroughs in mitochondrial‑targeted therapies and research on neurodegenerative diseases, cancer, and beyond.
Follow Elabscience® for more cell metabolism insights, experimental tips, and product updates to accelerate your research.
References:
[1] Rickard, B. P., Overchuk, M., Chappell, V. A., et al. Methods to Evaluate Changes in Mitochondrial Structure and Function in Cancer. Cancers, 2023, Apr 29;15(9):2564.
[2] Sivandzade, F., Bhalerao, A., Cucullo, L. Analysis of the Mitochondrial Membrane Potential Using the Cationic JC-1 Dye as a Sensitive Fluorescent Probe. Bio-protocol, 2019, Jan 5;9(1):e3128.

