Enzyme-Linked Immunosorbent Assay (ELISA) is one of the most widely used immunoassay techniques for detecting and quantifying proteins, antibodies, and antigens in biological samples. It is valued for its high sensitivity, specificity, and compatibility with high-throughput analysis.
This technical guide explains how ELISA works and provides a practical framework for interpreting ELISA results, including standard curve analysis, concentration calculation, and quality control criteria.
Table of Contents
1. How does ELISA work?
2. How to interpret ELISA results?
3. Analysis of abnormal ELISA results
01 How does ELISA work?
The essence of ELISA lies in “solid-phase reaction + enzymatic amplification”: antigens or antibodies are immobilized onto polystyrene microplates, allowing the immune reaction to occur directionally on the carrier surface. Enzyme-labeled molecules are then used to track binding signals, and finally, substrate color development “amplifies” the presence of trace targets. This design ensures detection specificity while solving the problem of capturing substances.
In practical applications, the sandwich method (especially the double-antibody sandwich method) is widely adopted for its high efficiency, primarily for detecting large-molecule antigens.
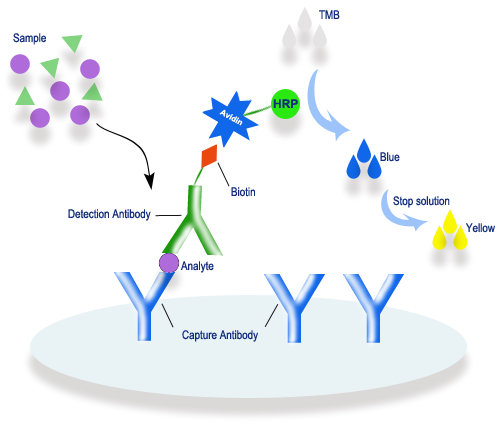
Fig. 1 Principle of sandwich biotin-streptavidin ELISA. The target analyte is captured by the immobilized antibody, then bound by a biotinylated detection antibody. Streptavidin-HRP reacts with TMB substrate, producing a color change from blue to yellow for detection.
Depending on the experimental design, ELISA can be divided into the four main types (direct ELISA, indirect ELISA, sandwich ELISA, and competitive ELISA) to suit different detection needs.
%20Direct%20ELISA;%20(b)%20Indirect%20ELISA;%20(c)%20Sandwich%20ELISA;%20(d)%20Competitive%20ELISA_.png)
Fig. 2 (a) Direct ELISA; (b) Indirect ELISA; (c) Sandwich ELISA; (d) Competitive ELISA.
02 How to interpret ELISA results?
In biological research, ELISA has become an indispensable method in the daily work of researchers due to its high sensitivity, strong specificity, and broad applicability. However, to truly leverage the detection advantages of ELISA, the key lies in accurate ELISA data analysis and in-depth interpretation. The following will guide you through data analysis and interpretation techniques for ELISA experiments.
2.1 Preparing a standard curve
The standard curve is the core of ELISA quantification. OD values obtained from standard samples of known concentrations (prepared by serial dilution) are used to plot the curve: X-axis is concentration (often logarithmic scale), Y-axis is background-corrected OD value. An ideal curve is S-shaped (with low- and high-concentration plateaus and a linear middle segment). ELISA standard curves are typically fitted using a four-parameter logistic (4-PL) model.
The standard curve is used to evaluate the linear relationship of the detection system; the key metric is the correlation coefficient (R-value). An R-value greater than 0.99 is typically required, indicating good linearity between concentration and OD value. If the R-value does not meet this standard, check whether the dilution gradient of the standards is accurate or if there are issues with replicate reproducibility.
2.2 Calculating sample concentration
By substituting the absorbance value of the test sample into the standard curve equation, the sample concentration can be calculated. During this process, attention must be paid to the dilution factor of the sample to ensure accurate results. The sample OD value must fall within the range of the standard curve; if the OD value exceeds the standard curve range, the sample should be diluted and retested.
2.3 Assessing experimental reproducibility
Reproducibility is typically evaluated by calculating the coefficient of variation (CV%) between replicate wells within the same experiment. Generally, CV values for both standards and samples should be ≤10%. If replicates show large variation, check for pipetting errors or cross-well contamination.
To avoid subjective interpretation errors, it is recommended to follow the "four guidelines" to scientifically interpret ELISA data and ensure the reliability of the results:
1. In the sandwich method, the OD value of the blank control well is ≤ 0.1, and the maximum OD value of the standard curve is usually above 1.2.
2. The OD value of the sample must fall within the range of the standard curve before it can be calculated.
3. Precision (SD/Mean * 100) ≤ 10%
4. The R2 value of the standard curve is ≥ 0.99
Beyond mastering the basic data analysis methods, one should also comprehensively consider multi-dimensional information such as experimental background and relevant literature to provide systematic and in-depth interpretation of the results. At the same time, always maintain a prudent scientific attitude, neither exaggerating the implications of the results nor neglecting important details.
03 Analysis of abnormal ELISA results
During the experiment, abnormal data is inevitable. Therefore, we have sorted out the three most common problems encountered when interpreting ELISA data, and provided precise solutions to help you quickly identify and eliminate the faults.
3.1 Possible reasons for no signal in standards & samples
Fig. 3 No color development observed in standards and samples of the ELISA plate.
Table 1. Causes and solutions for no color development in ELISA assays
|
Possible Causes |
Solutions |
|
a. The kit has lost its activity. |
Use a new kit and store the kit according to the instructions. |
|
b. Kit components are not balanced to room temperature. |
Each component of the kit needs to be balanced to room temperature for testing. |
|
c. Mixed with other reagents or didn’t mix up well. |
Please do not mix use the reagents from other brand or different batch to avoid mismatch issue. Ensure the solution is well mixed. |
|
d. Wash buffer was contaminated or wash the plate improperly. |
Prepare fresh wash buffer, operate according to manual. |
|
e. Insufficient incubation time. |
Note that the three incubation times in the experiment are 90 min, 60 min and 15 min respectively. |
|
f. Incubation temperature is unstable. |
Check the incubator to ensure that the incubation temperature is stable at 37°C. |
|
g. Biotinylated Detection Ab or HRP enzyme conjugate is insufficient. |
Ensure accurate concentration extraction amount, completely dilute and prepare the working fluid 15 min in advance. |
|
h. Biotinylated Detection Ab or HRP conjugates are diluted incorrectly or the steps are reversed. |
① Firstly, the performance of HRP concentrate was judged by whether the color changed after mixing the substrate with HRP concentrate. ② Then experiment was repeated according to the correct steps when the performance of HRP concentrate was normal. |
|
i. Stop solution is not added. |
Stop solution should be added to each well before measurement. |
3.2 Standard /samples duplicate well vary greatly
Table 2. ELISA duplicate well variation example
|
Standard OD values |
Samples OD values |
||
|
2.458 |
2.306 |
0.765 |
0.423 |
|
1.566 |
1.327 |
0.341 |
0.307 |
|
0.953 |
0.945 |
0.211 |
0.426 |
|
0.460 |
0.852 |
0.412 |
0.422 |
|
0.277 |
0.264 |
0.827 |
0.791 |
|
0.168 |
0.174 |
0.675 |
0.366 |
|
0.120 |
0.137 |
0.607 |
0.662 |
|
0.046 |
0.053 |
0.453 |
0.473 |
Table 3. Troubleshooting for large duplicate well variation
|
Possible Causes |
Solutions |
|
a. Inconsistent volume of liquid added to each well. |
① Use a calibrated pipette. ② Add samples quickly in a vertical direction. |
|
b. Pipette tip touching the wall or bottom of the well. |
Do not let the pipette tip touch the wall or bottom of the well. |
|
c. Mixing reagents from different brands or kits. |
Do not mix reagents from other brands or different lots to avoid compatibility issues. |
|
d. Sample/reagent not mixed thoroughly. |
Always ensure thorough mixing of samples and reagents. |
|
e. Incomplete washing plate |
Perform washing steps as instructed and control the washing time. |
|
f. Inconsistent order of adding substrate solution and stop solution. |
Ensure the same order for all dispensing steps. |
|
g. Kit components not equilibrated to room temperature. |
Each component of the kit needs to be equilibrated at room temperature for the required time before use. |
|
h. Improper sample storage. |
Ensure correct sample collection and storage; avoid repeated freeze‑thaw cycles. |
|
i. Insufficient stop step (e.g., incomplete termination). |
After completing the shaking/mixing operation, read the terminated solution as required. |
3.3 Standard curve shows low signal
Table 4. Example of low OD values in ELISA standard curve
|
Standard OD values |
|
|
0.585 |
0.706 |
|
0.341 |
0.307 |
|
0.219 |
0.226 |
|
0.112 |
0.122 |
|
0.082 |
0.091 |
|
0.078 |
0.066 |
|
0.071 |
0.062 |
|
0.054 |
0.073 |
Table 5. Troubleshooting for low signal in ELISA standard curve
|
Possible Causes |
Solutions |
|
a. Improper storage of the kit. |
Store the kit strictly according to the instructions. |
|
b. The reagent is not balanced to room temperature before use. |
Before the experiment, place the kit at room temperature for about 20 min. |
|
c. The working solution takes a long time to configure. |
The working solution should be configured about 15 min before use. |
|
d. The dilution ratio of the working solution is incorrect. |
It is necessary to configure 100× working solution into 1×. |
|
e. Insufficient reagent volume or missed addition. |
Make sure all reagents are added in order and in sufficient quantities. |
|
f. Incubation time/temperature did not meet the requirements. |
Check the incubator to ensure that the incubation temperature is stable at 37°C. |
|
g. The substrate coloration time is short and the color development is insufficient. |
The color development time can be extended, generally not more than 25 min. |
For more analysis of the causes of abnormal ELISA results and solutions, please refer to the Elabscience® ELISA Experiment Operation Guide.
Summary
Accurate interpretation of enzyme-linked immunosorbent assay (ELISA) results and troubleshooting of common abnormalities depend on a deep understanding of the assay principles, strict operational protocols, and meticulous data analysis. By observing color development, quantifying OD values, validating standard curves, and assessing precision, a reliable result interpretation system can be established. For common issues such as completely blank plates (no color development), low signals, and large variability between replicate wells, it is necessary to examine each step of the experimental procedure to identify the causes and implement targeted corrective measures.

