T cell is derived from hematopoietic stem cells and consists of highly specialized functional subsets, which are essential for maintening homeostasis of immune system[1,2]. T cell development process begins in the bone marrow, where hematopoietic stem cells (HSCs) give rise to common lymphoid progenitors (CLPs)[4]. Then these CLPs migrate to the thymus, the primary site for T cell maturation, and further develop into T cell precursors. Within the thymus, T cell progenitors undergo T cell receptor (TCR) gene rearrangement, producing a diverse TCR repertoire capable of recognizing a wide range of antigens. Through subsequent positive and negative selection, they differentiate into mature CD4+ helper T cells(CD4+ T Cells) or CD8+ cytotoxic T cells(CD8+T Cells). These mature T cells then enter the systemic circulation and home to various peripheral tissues to carry out their effector functions[4,6,8].
This issue introduces the journey of T cells, the master regulators of our immune system, uncovering their origin, training,character and ultimate mission.
Table of Contents
1. T cell development stages and key events
2. How do T cells develop in the thymus?
3. Classification of T cell functional subsets
4. Naive T cells vs. Memory T cells
5. Cytotoxic T lymphocytes (CTLs) function in immunity
6. CD4+ T cells function in immunity
7. Regulatory T cells (Tregs) and immune tolerance
01 T cell development stages and key events
T cell development begins with hematopoietic stem cells (HSCs) in the bone marrow, which differentiate into common lymphoid progenitors (CLPs). These CLPs migrate to the thymus, where they undergo selection processes to mature into CD4+ and CD8+ T cells. The mature CD4+ and CD8+ T cells (cytotoxic t cells) then migrate to peripheral lymphoid organs, such as lymph nodes and spleen. Upon pathogenes invasion, they can be activated by antigen-presenting cells (APCs). This activation primarily requires specific interaction between MHC-peptide complex and TCR, then involves interactions between co-stimulatory molecules and CD28 molecule. Ultimately, depending on contextual signals, these T cells differentiate into various T helper (Th) cell and cytotoxic T (Tc) cell subsets[10].
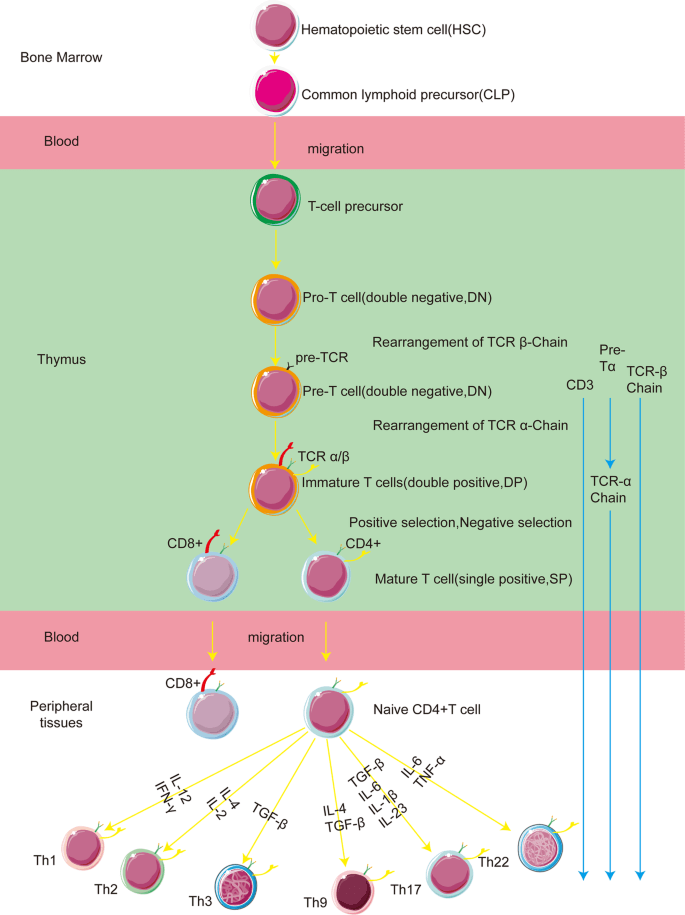
Fig. 1 The stage of T cell development[10]
02 How do T cells develop in the thymus?
In thymus, T cells undergo positive selection and negative selection to ensure mature T cells only response to pathogens or abnormal cells.Thus thimic T cells progress through distinct developmental stages: double-negative (DN) → double-positive (DP) → single-positive (SP)[11]:
Double-negative (DN) stage: Cells at this stage express neither CD4 nor CD8 on their surface. Development is initiated by TCR β-chain rearrangement, progressing through DN1 to DN4 sub-stages, ultimately leading to the formation of a functional TCR β chain.
Double-positive (DP) stage: Cells simultaneously express both CD4 and CD8. They undergo positive selection based on their interaction with self-major histocompatibility complex (MHC) molecules on thymic cortical epithelial cells. This process determines the MHC restriction of the TCR. Cells that fail this selection undergo apoptosis (programmed cell death)[12].
Single-positive (SP) stage: Cells differentiate into either CD4+ T cells (CD4 Helper T Lymphocytes,which interact with MHC class II molecules) or CD8+ T cells (Cytotoxic T Lymphocytes,which interact with MHC class I molecules). Negative selection then eliminates self-reactive T cells, establishing peripheral tolerance[3,13].
Once T cells complete their rigorous training in the thymus, they do not immediately engage in immune responses. Instead, they take up residence in the immune system's "command centers": peripheral lymphoid organs such as lymph nodes and the spleen. From there, they circulate throughout the body via the lymphatic system, perpetually vigilant and ready to respond to any immunological threats.
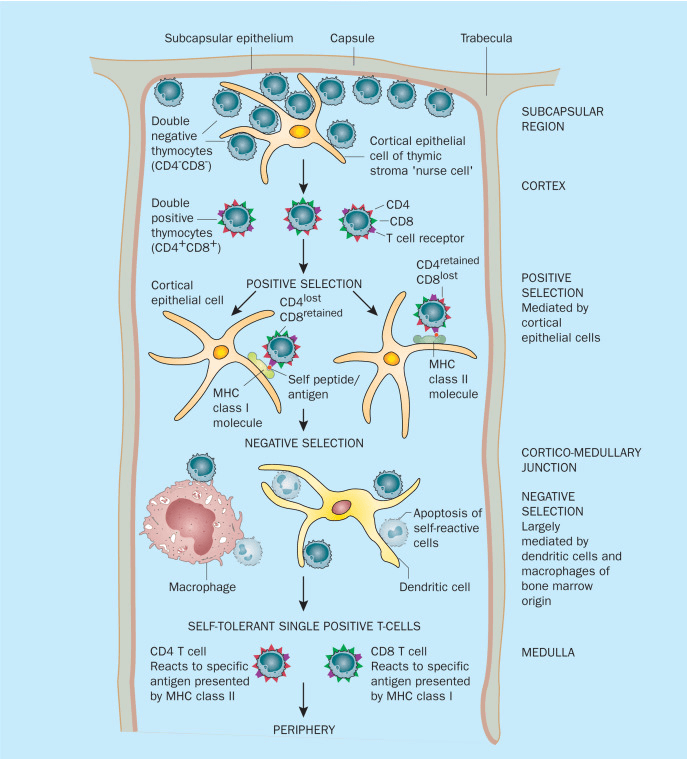
Fig. 2 Developmental Process of T Cell in the Thymus[3]
03 Classification of T cell functional subsets
T cells are heterogeneous lymphocytes, comprising various subsets with distinct biological functions. These T cell subsets are classified based on different criteria, with common classification standards including:
Classification Based on TCR Molecular Composition and Diversity
The T cell receptor (TCR) is the core molecule for antigen recognition by T cells and a defining marker of T cells. TCR is generally composed of two different subunits, each containing a variable region. T cells can be divided into the conventional αβ T cells and the unconventional T cells (γδ T cells, NKT cells, and MAIT cells) based on structural differences in their TCR molecules.
αβ T cells: Their TCR consists of an α-chain and a β-chain. Both chains are generated through gene rearrangement (random combination of V, D, and J segments), resulting in highly diverse structures.
γδ T cells: Their TCR consists of a γ-chain and a δ-chain. Gene rearrangement is simpler, and their diversity is much lower than that of αβ TCR. They recognize non-peptide antigens presented by non-classical MHC molecules of the CD1 family[18].
NKT cells: They express an "invariant TCR" (e.g., Vα14-Jα18 in mice, Vα24-Jα18 in humans) with almost no diversity. They recognize non-peptide antigens presented by non-classical MHC molecules of the CD1 family[19].
MAIT cells: Their TCR is predominantly composed of Vα7.2-Jα33 in humans, exhibiting a constant structure with very low diversity. They primarily recognize bacterial metabolites and guard mucosal barriers[20].
Classification Based on T Cell Activation Status
Naive T cell: These are mature T cells that have never encountered antigen stimulation. Naive T cells have low metabolic activity and weak proliferative capacity.
Activated T cell: When naive T cells receive activation signals, typically through TCR recognition of the peptide-MHC complex presented by antigen-presenting cells (APCs) and co-stimulatory signals (e.g., CD28-B7 binding), their metabolic activity increases. They enter a state of proliferation and further differentiate into various effector T cells.
Effector T cell: After antigen stimulation, naive T cells proliferate and differentiate into effector T cells capable of performing different effector functions. These functions include cytokine release (e.g., IFN-γ) and cell-killing activities (e.g., via granzyme B).
Memory T cell: These are long-lived T cells generated after antigen-induced proliferation and differentiation. They mount a rapid response upon re-encountering the same antigen. Based on phenotype and migratory properties, memory T cells can be further categorized into central memory T cells (Tcm), effector memory T cells (Tem), tissue-resident memory T cells (Trm), and stem cell-like memory T cells (Tscm)[21].
Classification Based on Effector Function (for αβ T Cells)
Helper T cells or CD4+T Cells (Th1, Th2, Th9, Th17, Th22, Tfh): Often regarded as the "commanders" of the immune system, helper T cells primarily express the CD4 surface marker[5]. They secrete cytokines to activate other immune cells such as B cells and macrophages[14].
Cytotoxic T cells or CD8+T Cells (Tc1, Tc2, Tc9, Tc17): These cells primarily express the CD8 surface marker.They directly eliminate target cells through mechanisms like perforin and granzyme release , thus they are core players in anti-tumor and anti-viral immunity[15].
Regulatory T cells (Treg cells): These cells suppress excessive immune responses, maintain self-tolerance, and prevent autoimmune diseases. They act as the "brakes" of the immune system[16].
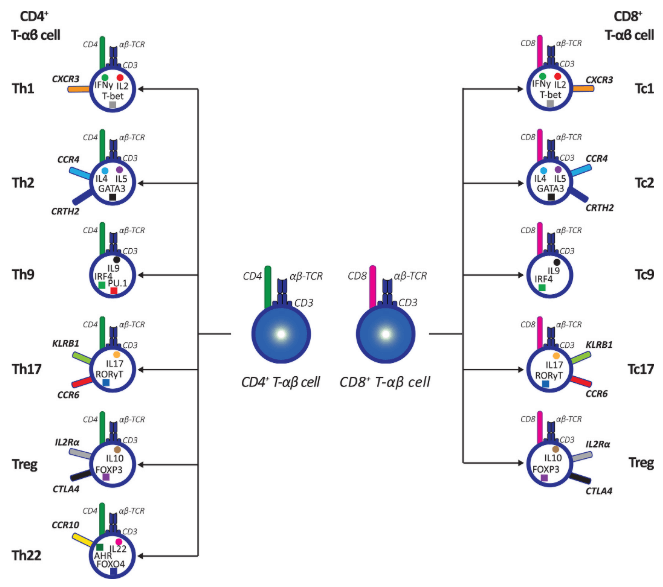
Fig. 3 Classification and Identification of CD4+ and CD8+ T-αβ Subpopulations[17]
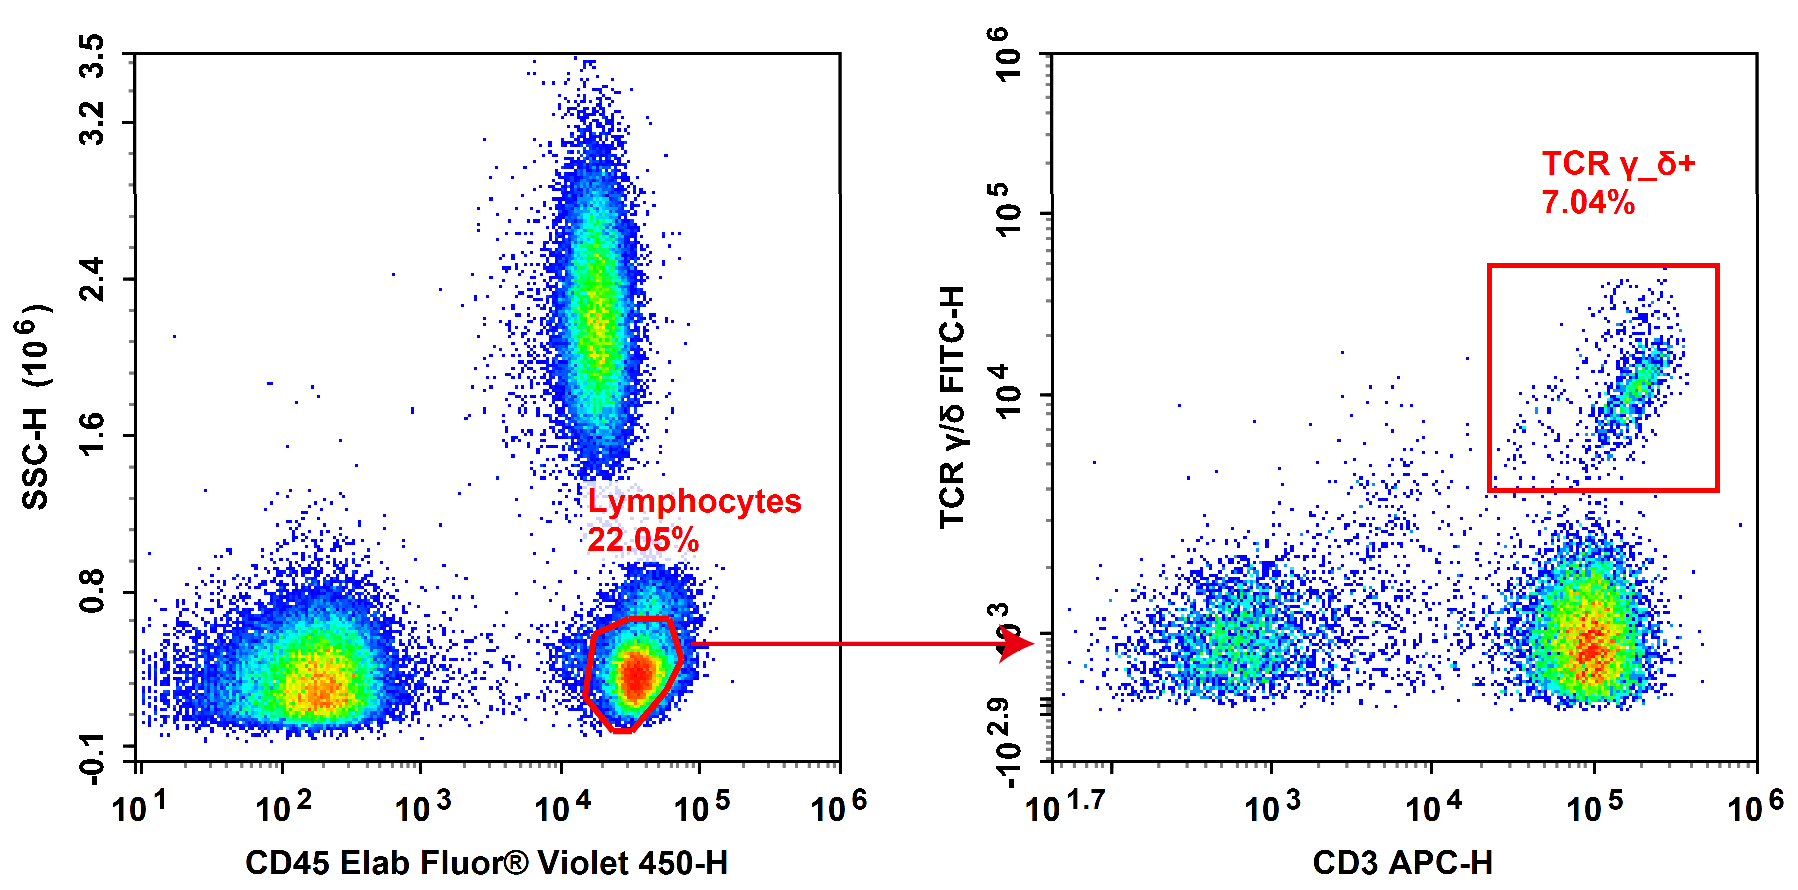
Fig. 4 Normal human peripheral blood cells are stained with FITC Anti-Human TCRγ/δ, APC Anti-Human CD3 and Elab Fluor® Violet 450 Anti-Human CD45, followed by analysis via flow cytometry. Cells positive for both CD45 and CD3 (CD45+CD3+) were identified as T cells, while cells positive for both CD3 and TCR γ/δ (CD3+TCR γ/δ+) were defined as γ/δ T cells.
Elabscience® Quick Overview of Popular Products:
Table 1. Multicolor Panel for Flow Cytometric Analysis of Human γ/δ T cells
|
Marker |
Clone |
Fluorochrome |
Cat. No. |
Species Reactivity |
|
HI30 |
Elab Fluor® Violet 450 |
E-AB-F1137Q |
Human |
|
|
UCHT1 |
APC |
E-AB-F1230E |
Human |
|
|
B1 |
FITC |
E-AB-F1145C |
Human |
04 Naive T cells vs. Memory T cells
Naive T cells and memory T cells represent two critical differentiation stages within the T cell lifecycle, playing distinct roles in the initiation, execution, and long-term protection of immune responses. Understanding the characteristics, differentiation pathways, and functional disparities between these two T cell subsets is crucial for elucidating the complexities of the adaptive immune system.
Naive T cells are mature T lymphocytes that have not been exposed to specific antigens. After developing and undergoing selection in the thymus, they migrate to peripheral lymphoid organs and enter the systemic circulation. These cells remain in a quiescent state (G0 phase), characterized by low metabolic activity and limited proliferative capacity, yet they possess a long lifespan, capable of circulating in the body for weeks to years while awaiting encounter with antigens[21].
Naive T cells typically express high levels of the homing receptors CD62L and CCR7, as well as CD45RA; this phenotypic profile enables them to home to secondary lymphoid organs such as lymph nodes and the spleen. Their primary function is as follows: upon the first recognition of antigenic peptides (presented by MHC molecules on antigen-presenting cells (APCs)) via the T cell receptor (TCR), and concurrent reception of co-stimulatory signals (e.g., the binding of CD28 to B7), naive T cells become activated, proliferate, and differentiate into effector T cells and memory T cells. This cascade of events initiates the primary immune response[21].
Memory T cells are differentiated from naive T cells following the initial antigen stimulation, activation, and effector phases. Based on their homing properties and functions, they can be categorized into two major subsets: central memory T cells (TCM) and effector memory T cells (TEM).TCM highly express the homing receptors CD62L and CCR7, which allows them to home to secondary lymphoid organs. They also possess strong proliferative potential.In contrast, TEM lowly express the aforementioned homing receptors. Instead, they are capable of migrating to non-lymphoid tissues and inflammatory sites, where they can exert effector functions immediately[21].
Memory T cells exhibit three key characteristics: a lower activation threshold, stronger proliferative capacity, and long-term survival (with a lifespan of up to several decades). Upon subsequent antigen re-exposure, these cells can rapidly initiate a robust immune response. By quickly clearing pathogens, they provide long-term immune protection and thus serve as the core foundation of the secondary immune response[21].
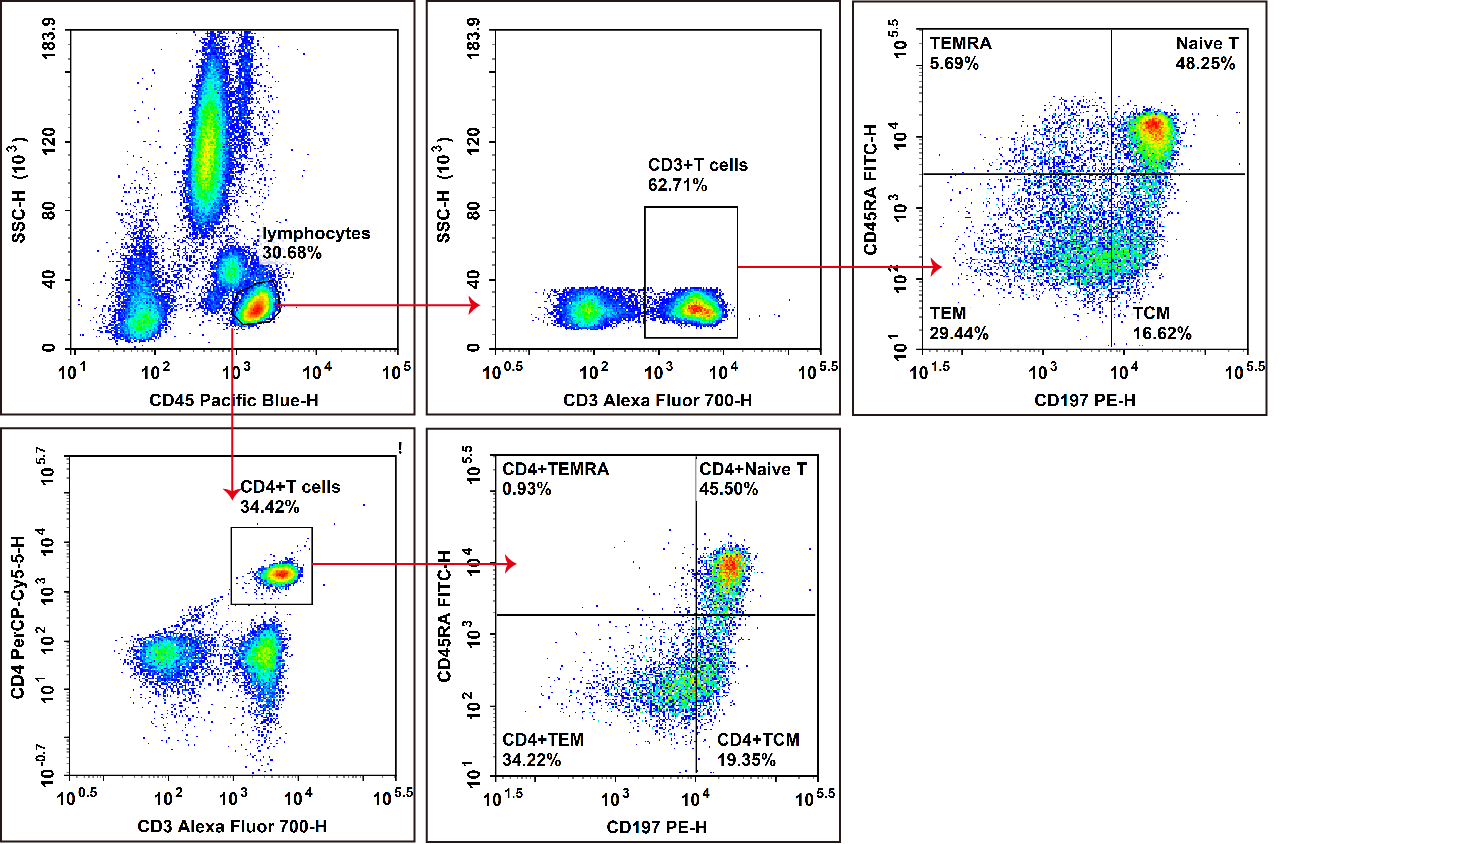
Fig. 5 Peripheral blood cells from healthy individuals were treated with ACK Lysis Buffer to remove erythrocytes, then stained with Elab Fluor® Violet 450 Anti-human CD3, APC Anti-human CD4, FITC Anti-human CD45RA, and PE Anti-human CD197/CCR7,followed by flow cytometric analysis. CD3+ cells were identified as total T cells, and CD3+CD4+cells as helper T (Th) cells. The phenotypic profiles were defined as follows: naive T cells (Naive T) exhibited the phenotype CD45RA+CCR7+, effector memory T cells (TEM) displayed the phenotype CD45RA-CCR7-, and central memory T cells (TCM) showed the phenotype CD45RA-CCR7+.
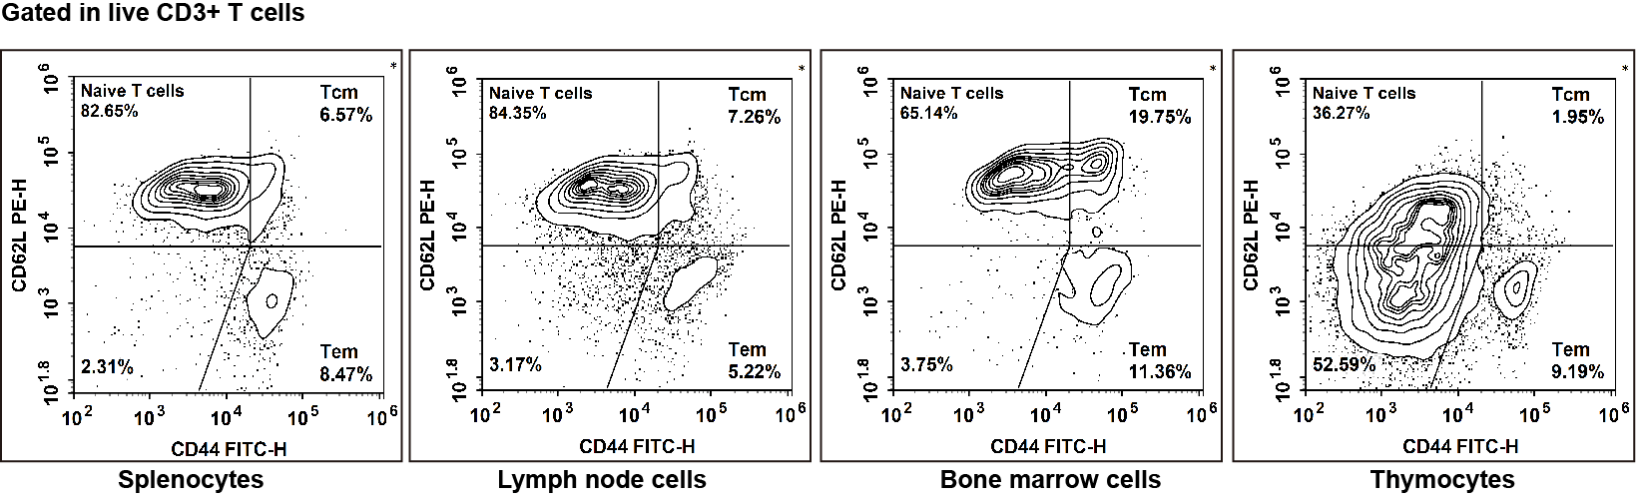
Fig. 6 Staining of C57BL/6 splenocytes, lymph node cells, bone marrow cells and thymocytes with PerCP/Cyanine5.5Anti-Mouse CD45, APC Anti-Mouse CD3, Elab Fluor® Violet 610 Anti-Mouse CD4, Elab Fluor® Violet 450 Anti-Mouse CD8, PE Anti-Mouse CD62L and FITC Anti-Mouse CD44,followed by flow cytometric analysis. CD3+ cells were identified as total T cells, CD3+CD4+cells as helper T (Th) cells, and CD3+CD8+cells as Cytotoxic T (Tc) cells. The phenotypic profiles were defined as follows: naive T cells (Naive T) exhibited the phenotype CD62L-CD44-, effector memory T cells (TEM) displayed the phenotype CD62L-CD44+, and central memory T cells (TCM) showed the phenotype CD62L+CD44+.
Elabscience® Quick Overview of Popular Products:
Table 2. Multicolor Panel for Flow Cytometric Analysis of Human and Mouse Naive T cells vs. Memory T cells
|
Marker |
Clone |
Fluorochrome |
Cat. No. |
Species Reactivity |
|
CD3 |
OKT-3 |
Elab Fluor® 700 |
E-AB-F1001M1 |
Human |
|
CD4 |
SK3 |
PerCP/Cyanine5.5 |
E-AB-F1109J |
Human |
|
CD45RA |
HI100 |
FITC |
E-AB-F1052C |
Human |
|
CD197/CCR7 |
G043H7 |
PE |
E-AB-F1159D |
Human |
|
CD45 |
30-F11 |
PerCP/Cyanine5.5 |
E-AB-F1136J |
Mouse |
|
CD3 |
17A2 |
APC |
E-AB-F1013E |
Mouse |
|
CD4 |
GK1.5 |
Elab Fluor® Violet 610 |
E-AB-F1097T |
Mouse |
|
CD8 |
53-6.7 |
Elab Fluor® Violet 450 |
E-AB-F1104Q |
Mouse |
|
CD62L |
MEL-14 |
PE |
E-AB-F1011D |
Mouse |
|
CD44 |
IM7 |
FITC |
E-AB-F1100C |
Mouse |
If you have any questions about the panel design, we can provide professional and free Panel Design Services.
05 Cytotoxic T lymphocytes (CTLs) function in immunity
Cytotoxic T cells (CD8+ T cells) play a pivotal role in immune responses, particularly in host defense against viral infections and the clearance of tumor cells. Naive CD8+ T can be activated when they recognize MHC class I-antigen peptide complexes on the surface of antigen-presenting cells (APCs), such as dendritic cells (DCs. Subsequently, these activated naive CD8+ T cells differentiate into effector CD8+ T cells.
Effector CD8+ T cells exhibit potent cytotoxic activity and secrete a diverse array of cytokines. They can be further subdivided into distinct effector subsets based on three key criteria: differences in cytokine secretion profiles, variations in cytotoxicity strength, and distinct functional properties. The three major effector subsets are Type 1 Cytotoxic T Cells (Tc1 cells), Type 2 Cytotoxic T Cells (Tc2 cells), and Type 17 Cytotoxic T Cells (Tc17 cells)[3,23].
Table 3. The characteristic markers of each cytotoxic T cell subset
|
Type of Cell |
Cell surface Markers |
Effector Cytokines |
Transcription Factors |
|
Tc1 |
CD49d |
Perforin, granzyme B, IFN-γ, TNF-α |
STAT4, T-bet, EOMES |
|
Tc2 |
CyslT1, BLT-1 |
IL-4, IL-5, IL-13 |
STAT6, GATA3 |
|
Tc9 |
IL-9R |
IL-9, IFN-γ |
STAT6, IRF4 |
|
TC17 |
CD161, CD26, CD6, CD39, CD69, CD120b, PD-1 |
IL-17, IL-22, GM-CSF |
STAT3, RORγt |
|
TC22 |
CD122, Ly49 |
IL-22, IL-17 |
AhR, STAT1, STAT3, STAT5 |
|
Tfcs |
CXCR5 |
IL-4, IL-21, IFN-γ |
TCF-1, BCL-6, E2a, Runx3 |
|
Qa1-restricted CD8+ Tregs |
CD122, Ly49 |
TGF-β, perforin |
Eomes |
|
Foxp3+CD8+ Tregs |
CD103 |
IL-10, TGF-β |
Foxp3 |
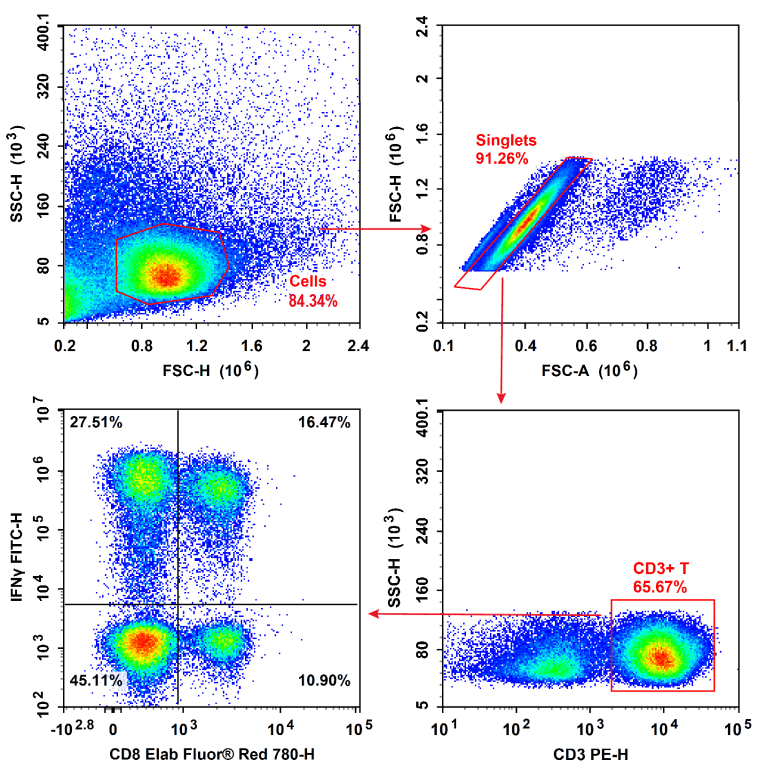
Fig. 7 Normal human peripheral blood lymphocytes (PBMCs) were stimulated with Cell Stimulation MIX and Protein Transport Inhibitor MIX. Then PBMCs were fixed, permeabilized, and stained with PE Anti-Human CD3,Elab Fluor® Red 780 Anti-Human CD8 and FITC Anti-Human IFN-γ,followed by analysise via flow cytometry. Tc1 cells exhibit the phenotype of CD3+CD8+IFN-γ+.
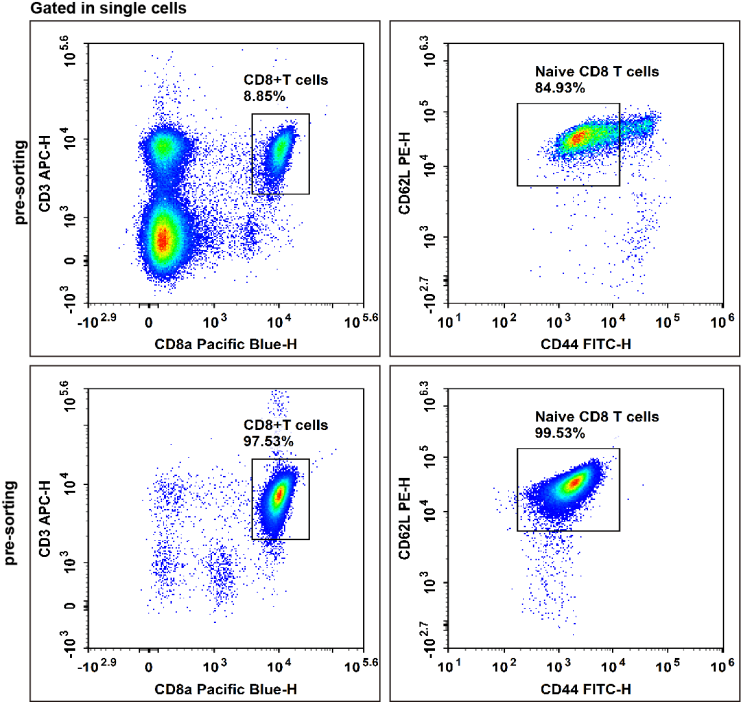
Fig. 8 Naive CD8 T cells were isolated from C57BL/6 mouse splenocytes using the EasySortTM Mouse Naïve CD8+T Cell Isolation Kit, followed by staining with APC Anti-Mouse CD3, Elab Fluor® Violet 450 Anti-Mouse CD8a, FITC Anti-Mouse CD44, and PE Anti-Mouse CD62,then analysised via flow cytometry. CD8+ naive T cells (CD44low/−CD62L+) were gated within the CD3+CD8+ double-positive T cell population, the purity of CD8+ naive T cells after sorting reached over 99.53%.
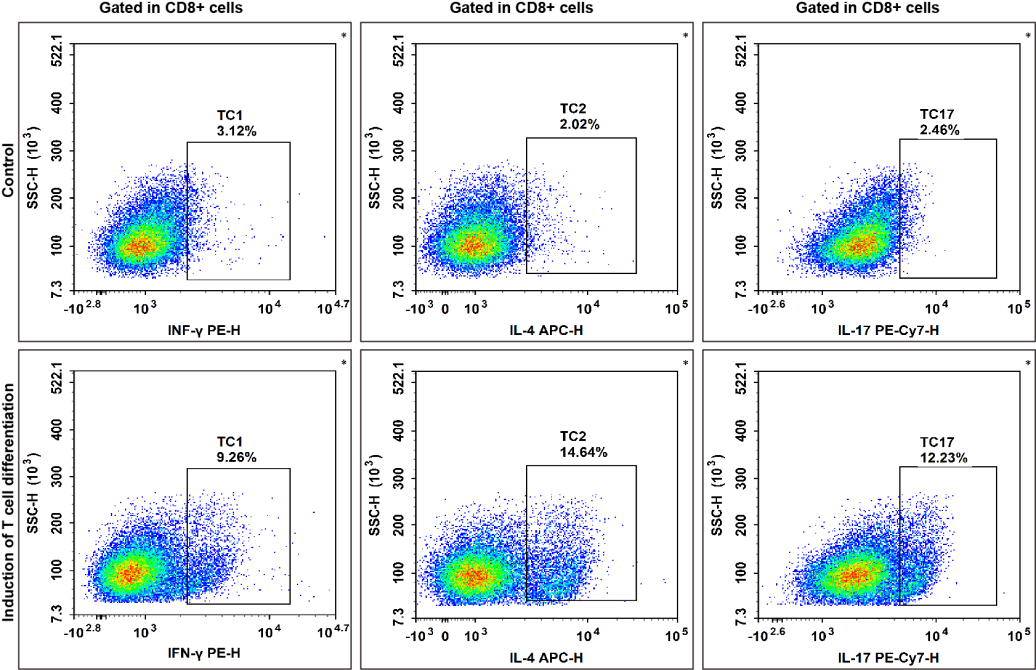
Fig. 9 High-purity isolated CD8+ naive T cells were activated in the presence of Mouse CD3/CD28 T Cell Activation Beads and recombinant IL-2 protein (20 U/mL) for 48 hours. For the directed differentiation of Tc1 and Tc17 cells, the activated cells were subsequently cultured for an additional 96 hours with recombinant IL-6 (50 ng/mL) and recombinant TGF-β (2 ng/mL). For the directed differentiation of Tc2 cells, the activated cells were subsequently cultured for 96 hours with recombinant IL-4 (20 ng/mL) and mouse anti-IFN-γ antibody (5 μg/mL).Then all cells were stimulated with Cell Stimulation MIX and Protein Transport Inhibitor MIX, fixed, permeabilized, and stained with PE Anti-Mouse IFN-γ, APC Anti-Mouse IL-4 and PE-Cyanine7 Anti-Mouse IL-17A for analysis of their ability to secrete effector cytokines.
Elabscience® Quick Overview of Popular Products:
Table 4. Multicolor Panel for Flow Cytometric Analysis of Human and Mouse Cytotoxic T cells (CD8+ T cells)
|
Marker |
Clone |
Fluorochrome |
Cat. No. |
Species Reactivity |
|
CD3 |
UCHT1 |
PE |
E-AB-F1230D |
Human |
|
CD8 |
OKT-8 |
Elab Fluor® Red 780 |
E-AB-F1110S |
Human |
|
IFN-γ |
B27 |
FITC |
E-AB-F1196C |
Human |
|
CD3 |
17A2 |
APC |
E-AB-F1013E |
Mouse |
|
CD8a |
63-6.7 |
Elab Fluor® Violet 450 |
E-AB-F1104Q |
Mouse |
|
CD44 |
IM7 |
FITC |
E-AB-F1100C |
Mouse |
|
CD62L |
MEL-14 |
PE |
E-AB-F1011D |
Mouse |
|
IL-17A |
17F3 |
PE-Cyanine7 |
E-AB-F1272H |
Mouse |
|
IL-4 |
11B11 |
APC |
E-AB-F1204E |
Mouse |
|
IFN-γ |
XMG1.2 |
PE |
E-AB-F1101D |
Mouse |
If you have any questions about your flow cytometry data, we can provide professional and free Flow Cytometry Data Analysis Services.
Elabscience® Additional Relevant Experimental Materials
Table 5. Reagents for Human and Mouse Cytotoxic T cells (CD8+ T cells) Research
|
Product Name |
Cat. No. |
|
Human PBMC Separation Solution (P 1.077) |
E-CK-A103 |
|
Cell Stimulation and Protein Transport Inhibitor Kit |
E-CK-A091 |
|
Intracellular Fixation/Permeabilization Buffer Kit |
E-CK-A109 |
|
10×ACK Lysis Buffer |
E-CK-A105 |
|
EasySort™ Mouse CD8+T Cell Isolation Kit |
MIM003N |
|
EasySort™ Mouse CD3+T Cell Isolation Kit |
MIM001N |
|
Human CD3/CD28 T Cell Activation Beads |
MIH001A |
|
Mouse CD3/CD28 T Cell Activation Beads |
MIM001A |
For more products and related reagents, click here to view our complete CD8+ T cells (Cytotoxic T cells) product list.
06 CD4+ T cells function in immunity
Helper T cells are derived from naive CD4+ T cells following differentiation induced by specific stimuli, including antigens and cytokines. Based on the distinct profiles of cytokines secreted by activated CD4+ T cells, these cells are classified into multiple subsets: Th1 cells (Type 1 Helper T Cells), Th2 cells (Type 2 Helper T Cells), Th17 cells (Type 17 Helper T Cells), regulatory T cells (Treg), Th9 cells (Type 9 Helper T Cells), Th22 cells (Type 22 Helper T Cells), and follicular helper T cells (Tfh)[3,7,9].
Each subset is activated by a unique set of cytokines and transcription factors, and is characterized by its specific cytokine secretion profile and effector functions. Helper T cells provide auxiliary support to other cells of the immune system, particularly antigen-presenting cells (APCs), such as macrophages, dendritic cells, and B cells, and play a crucial role in regulating the activation and function of these target cells.
Table 6. The characteristic markers of each helper T cell subset[3,23]
|
Type of Cell |
Cell Surface Markers |
Effector Cytokines |
Effector Chemokines |
Transcription Factors |
|
Th1 |
CD4, CD183(CXCR3) |
IL-1b, IL-2, IL-12, TNF-α, IFN-γ |
CXCR3, CCR5, CCR7, CXCL9, CXCL10, CXCL11 |
T-bet, STAT4, STAT1 |
|
Th2 |
CD4, CD196(CCR4), CD294(CRTH2) |
IL-4, IL-5, IL-10, TGF-β |
CCR3, CCR4, CCR8, MDC, TCA3, TARC |
GATA3, IRF4 |
|
Th9 |
CD4, CD196(CCR6) |
IL-9, IL-3, IL-21 |
CCL20, CCR6 |
IRF4, PU.1 |
|
Th17 |
CD4, CD161, CD194(CCR4), CD196(CCR6), IL23R |
IL-17A, IL-17F, IL-21, IL-22, IL-23 |
CCL4, CCL17, CCL22 |
IRF4, RORγT |
|
Th22 |
CD4, CCR10, CD194(CCR4), CD196(CCR6) |
IL-22, TNF-α, IL-13 |
CCR4, CCR6, CCR10, PD-1 |
FOXO4, AHR |
|
Tfh |
CD4, CXCR5 |
IL-21, IL-4 |
CXCR3, CCR6 |
Bcl-6, STAT3, c-Maf |
|
Treg |
CD25, CD127, CD152(CTLA4) |
IL-4, IL-10, TGF-β |
CCR4,CCR5,CCR8,CCR10 |
Foxp3 |
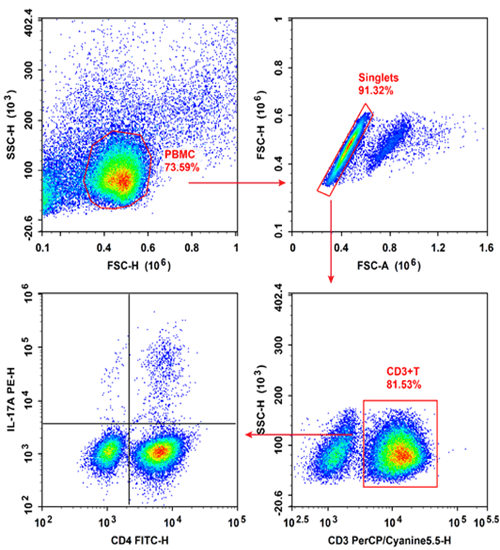
Fig. 10 Peripheral blood mononuclear cells (PBMCs) were cultured with Cell Stimulation MIX and Protein Transport Inhibitor MIX for 5 hours, then were harvested, fixed, and permeabilized, followed by staining with PerCP/Cyanine5.5 Anti-Human CD3, Elab Fluor® 488 Anti-Human CD4 and PE Anti-Human IL-17A for analysis of the proportion of Th17 cells and their functional capacity to secrete the effector cytokine IL-17A. Th17 cells were defined by the phenotype CD3+CD4+IL-17A+.
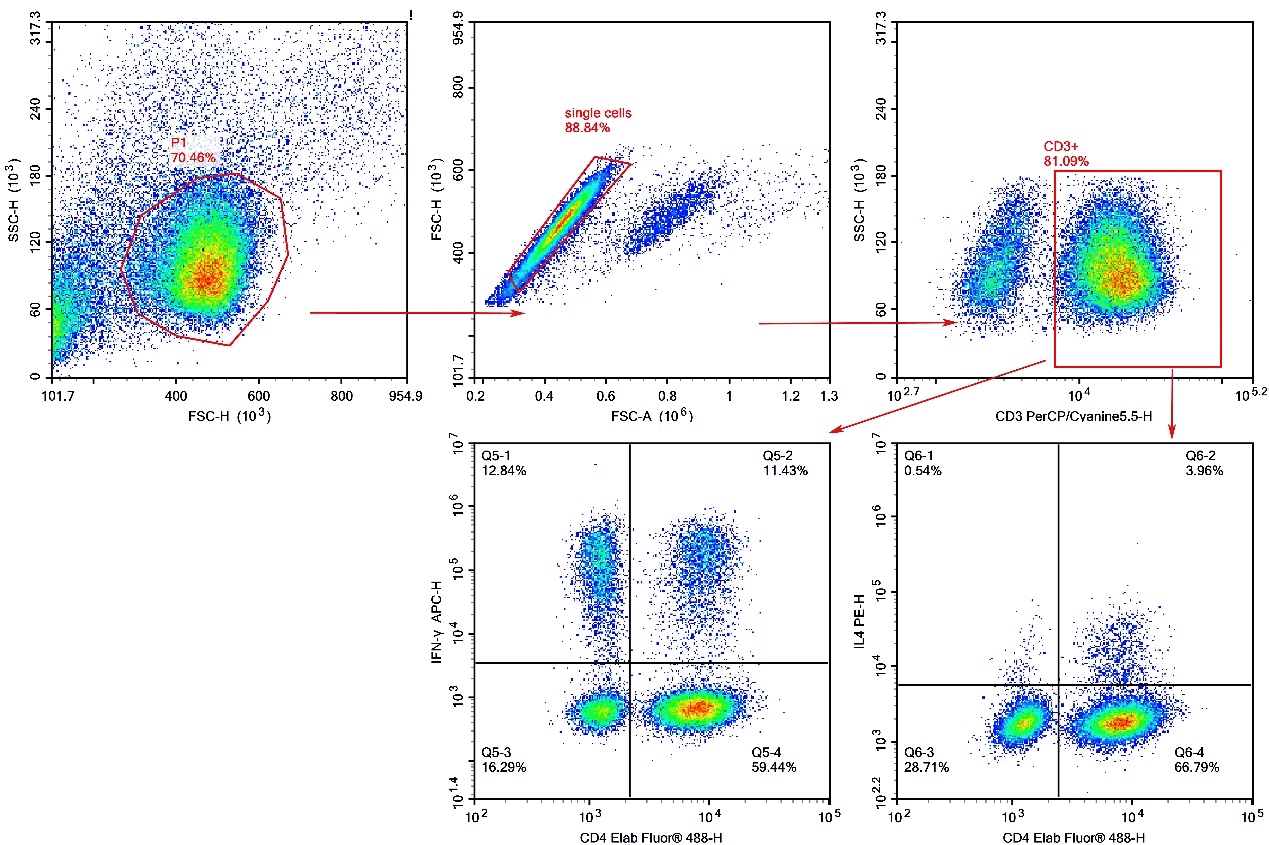
Fig. 11 Peripheral blood mononuclear cells (PBMCs) were treated with Cell Stimulation MIX and Protein Transport Inhibitor MIX for 5 hours, then were harvested, fixed, and permeabilized, followed by staining with PerCP/Cyanine5.5 Anti-Human CD3, Elab Fluor® 488 Anti-Human CD4, PE Anti-Human IL-4 and APC Anti-Human IFN-γ for analysis of the proportion of Th1/Th2 cells and their functional capacity to secrete the effector cytokine IFN-γor IL-4 . Th1 cells were defined by the phenotype CD3+CD4+IFN-γ+, Th2 cells were defined by the phenotype CD3+CD4+IL-4+.
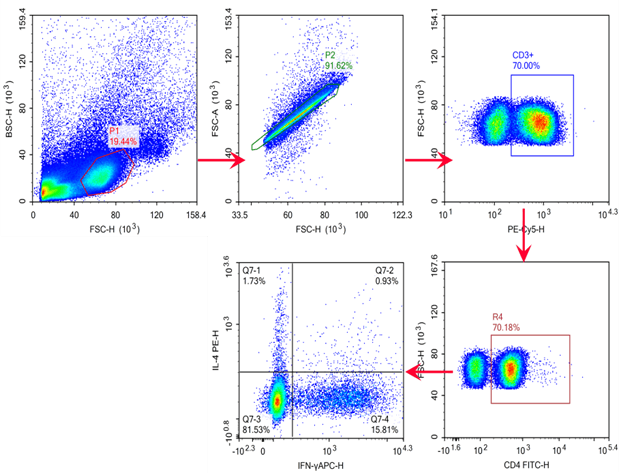
Fig. 12 C57BL/6 mouse splenocytes were treated with Cell Stimulation MIX and Protein Transport Inhibitor MIX for 5 hours, then were harvested, fixed, and permeabilized, followed by staining with PE/Cyanine5 Anti-Mouse CD3, FITC Anti-Mouse CD4, PE Anti-Mouse IL-4 and APC Anti-Mouse IFN-γ for analysis of the proportion of Th1/Th2 cells and their functional capacity to secrete the effector cytokine IFN-γ or IL-4. Th1 cells were defined by the phenotype CD3+CD4+IFN-γ+, Th2 cells were defined by the phenotype CD3+CD4+IL-4+.
Elabscience® Quick Overview of Popular Products:
Table 7. Multicolor Panel for Flow Cytometric Analysis of Human and Mouse Helper T cells (CD4+ T cells)
|
Marker |
Clone |
Fluorochrome |
Cat. No. |
Species Reactivity |
|
CD3 |
OKT-3 |
PerCP/Cyanine5.5 |
E-AB-F1001J |
Human |
|
CD4 |
SK3 |
Elab Fluor® 488 |
E-AB-F1352L |
Human |
|
IL-17A |
BL168 |
PE |
E-AB-F1173D |
Human |
|
IFN-γ |
B27 |
APC |
E-AB-F1196E |
Human |
|
IL-4 |
MP4-25D2 |
PE |
E-AB-F1203D |
Human |
|
CD3 |
17A2 |
PE/Cyanine5 |
E-AB-F1013G |
Mouse |
|
CD4 |
GK1.5 |
FITC |
E-AB-F1097C |
Mouse |
|
IFN-γ |
XMG1.2 |
APC |
E-AB-F1101E |
Mouse |
|
IL-4 |
11B11 |
PE |
E-AB-F1204D |
Mouse |
|
IL-17A |
17F3 |
PE |
E-AB-F1272D |
Mouse |
Elabscience® Additional Relevant Experimental Materials
Table 8. Reagents for Human and Mouse Helper T cells (CD4+ T cells) Research
|
Product Name |
Cat. No. |
|
Human PBMC Separation Solution (P 1.077) |
E-CK-A103 |
|
Cell Stimulation and Protein Transport Inhibitor Kit |
E-CK-A091 |
|
Intracellular Fixation/Permeabilization Buffer Kit |
E-CK-A109 |
|
10×ACK Lysis Buffer |
E-CK-A105 |
|
EasySort™ Mouse CD4+T Cell Isolation Kit |
MIM002N |
|
EasySort™ Mouse CD3+T Cell Isolation Kit |
MIM001N |
|
Human CD3/CD28 T Cell Activation Beads |
MIH001A |
|
Mouse CD3/CD28 T Cell Activation Beads |
MIM001A |
|
Human Th17 Flow Cytometry Staining Kit |
XJH002 |
|
Human Th1/Th2 Flow Cytometry Staining Kit |
XJH001 |
|
Mouse Th1/Th2 Flow Cytometry Staining Kit |
XJM001 |
|
Mouse Th17 Flow Cytometry Staining Kit |
XJM002 |
For more products and related reagents, click here to view our complete CD4+ T cells (CD4 Helper T Lymphocytes) product list.
07 Regulatory T cells (Tregs) and immune tolerance
Regulatory T cells (Tregs), a specialized subset of CD4+ T cells defined by the transcription factor Foxp3, are central mediators of immune tolerance, critical for balancing the immune system’s ability to combat pathogens and tumors and avoid autoimmunity or excessive reactions to harmless antigens (e.g., commensals, fetal tissues). Categorized into thymus-derived natural Tregs (nTregs, CD4+CD25highFoxp3+, self-antigen-specific) and peripherally induced Tregs (iTregs, CD4+CD25+Foxp3+, induced by TGF-β/retinoic acid, targeting non-self antigens), Tregs exert suppressive effects on effector immune cells (Tconvs, CD8+ T cells, APCs) via three core mechanisms: cell-contact-dependent pathways (e.g., CTLA-4-B7 binding to inhibit APCs, CD25-mediated IL-2 sequestration), cytokine-dependent suppression (TGF-β, IL-10, IL-35), and metabolic disruption (adenosine production, glucose and glutamine depletion). Physiologically, Tregs maintain self-tolerance (preventing autoimmunity like IPEX syndrome), support maternal-fetal tolerance (reducing miscarriage risk), regulate commensal microbiota tolerance (preventing IBD), and limit allergic responses; pathologically, Treg dysfunction causes autoimmune diseases (RA, SLE), while excessive Treg activity facilitates tumor immune evasion (recruited via TME chemokines, suppressing anti-tumor T cells) and chronic infections (impairing pathogen clearance in HIV/TB). Therapeutically, Tregs are targeted to enhance their function (ex vivo expansion, rapamycin) for autoimmune diseases and transplantation or inhibit their activity (anti-CCR4/CTLA-4 antibodies) for cancer immunotherapy, underscoring their pivotal role in immune homeostasis and disease intervention[3,7,9,22,23].
Table 9. The characteristic markers of each Regulatory T cell(Treg cell) subset
|
Type of Cell |
Cell Surface Markers and Transcription Factor |
Effector Cytokines and Chemokines |
|
Naive Treg |
CD4+ CD25hi CD127-/low CD152- Foxp3low CD45RO- |
TGF-β |
|
Effector Treg |
CD4+ CD25hi CD127lowCD152+ Foxp3+ CD45RO+ |
IL-10, TGFβ, IFN-γ, IL-17, CCL22, CXCL10 |
|
Terminal effector Treg |
CD4+ CD25hi CD127- CD152+Foxp3+ CD45RO+ |
IL-10, TGFβ |
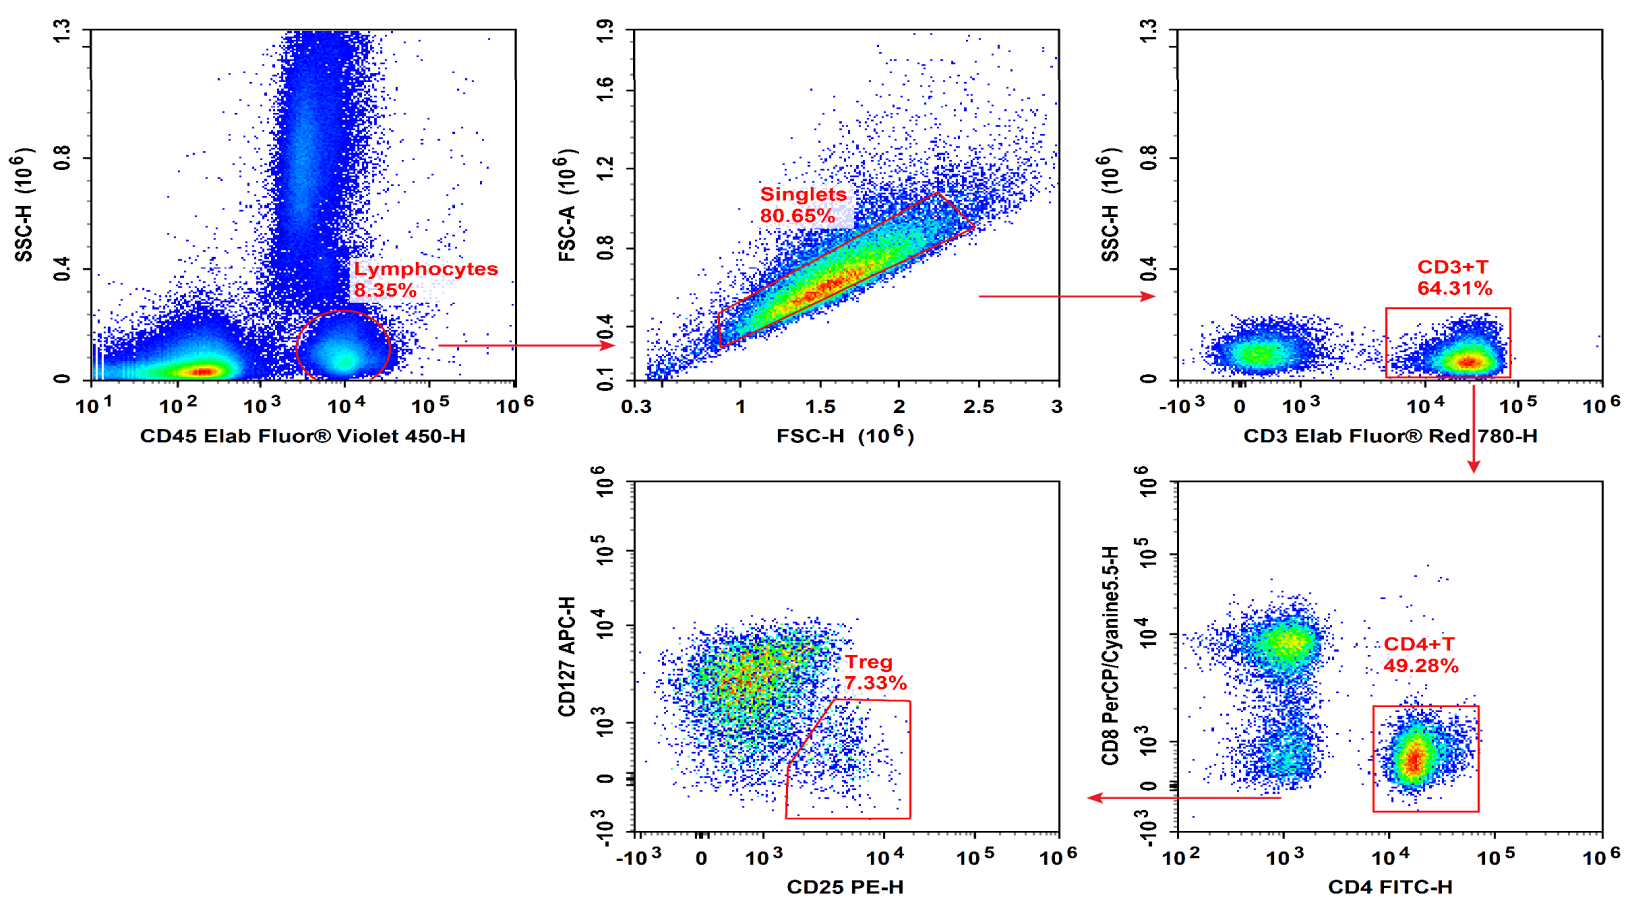
Fig. 13 Peripheral blood mononuclear cells (PBMCs) were stained with Elab Fluor® Violet 450 Anti-Human CD45, Elab Fluor® Red 780 Anti-Human CD3, FITC Anti-Human CD4, PerCP/Cyanine5.5 Anti-Human CD8, PE Anti-Human CD25 and APC Anti-Human CD127, followed by analysise via flow cytometry. Regulatory T cells(Treg cells) exhibit the phenotype of CD45+CD3+CD4+CD127LOW/-CD25+.
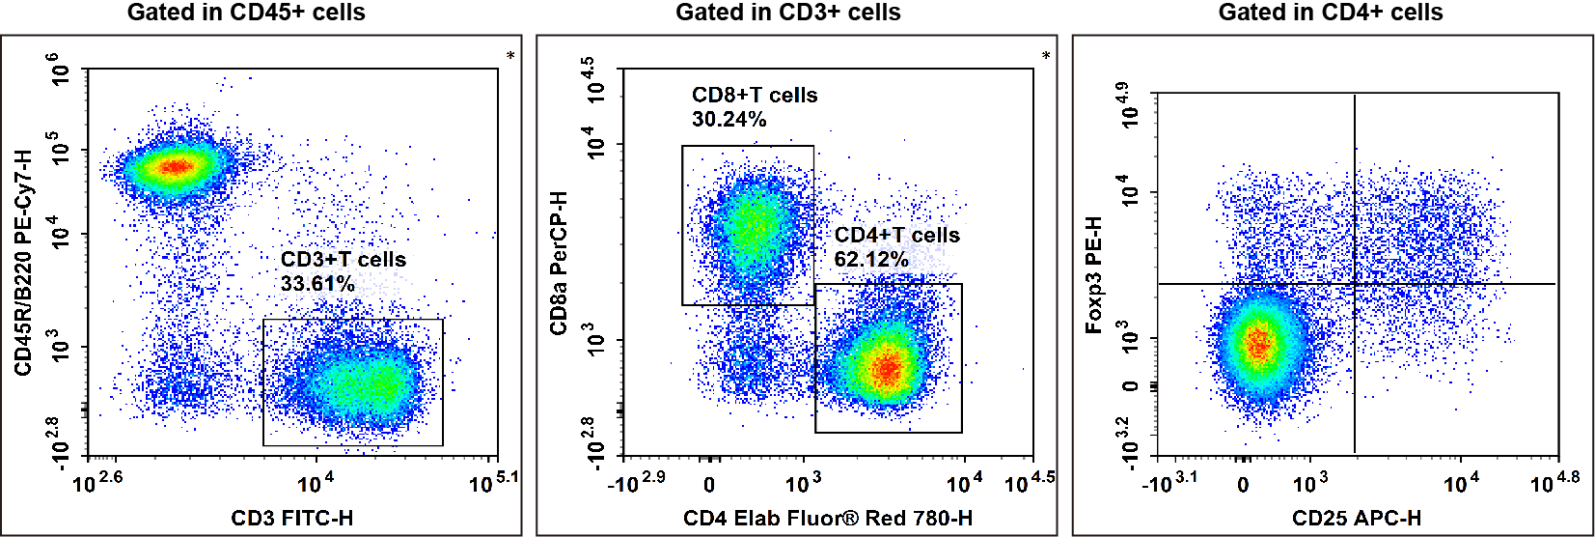
Fig. 14. C57BL/6 mouse splenocytes were surface stained with Elab Fluor® Violet 450 Anti-Mouse CD45, PE/Cyanine7 Anti-Mouse CD45R/B220, FITC Anti-Mouse CD3, Elab Fluor® Red 780 Anti-Mouse CD4, PerCP Anti-Mouse CD8a and APC Anti-Mouse CD25 and then treated with Foxp3/Transcription Factor Staining Kit.Cells were then stained with PE Anti-Mouse Foxp3, followed by analysise via flow cytometry. Regulatory T cells(Treg cells) exhibit the phenotype of CD45+CD45R/B220-CD3+CD4+CD25+Foxp3+.
Elabscience® Quick Overview of Popular Products:
Table 10. Multicolor Panel for Flow Cytometric Analysis of Human and Mouse Regulatory T cells (Tregs)
|
Marker |
Clone |
Fluorochrome |
Cat. No. |
Species Reactivity |
|
CD45 |
HI30 |
Elab Fluor® Violet 450 |
E-AB-F1137Q |
Human |
|
CD3 |
UCHT1 |
Elab Fluor® Red 780 |
E-AB-F1230S |
Human |
|
CD4 |
SK3 |
FITC |
E-AB-F1352C |
Human |
|
CD8 |
OKT-8 |
PerCP/Cyanine5.5 |
E-AB-F1110J |
Human |
|
CD25 |
BC96 |
PE |
E-AB-F1194D |
Human |
|
CD127 |
A019D5 |
APC |
E-AB-F1152E |
Human |
|
Foxp3 |
FJK-16s |
PE |
E-AB-F1351D |
Mouse |
|
CD45R/B220 |
RA3.3A 1/6.1 |
PE/Cyanine7 |
E-AB-F1112H |
Mouse |
|
CD25 |
PC-61.5.3 |
APC |
E-AB-F1102E |
Mouse |
|
CD4 |
GK1.5 |
Elab Fluor® Red 780 |
E-AB-F1097S |
Mouse |
|
CD45 |
30-F11 |
Elab Fluor® Violet 450 |
E-AB-F1136Q |
Mouse |
|
CD3 |
17A2 |
FITC |
E-AB-F1013C |
Mouse |
|
CD8a |
53-6.7 |
PerCP |
E-AB-F1104F |
Mouse |
Elabscience® Additional Relevant Experimental Materials
Table 11. Reagents for Human and Mouse Regulatory T cells (Tregs) Research
|
Product Name |
Cat. No. |
|
Human PBMC Separation Solution (P 1.077) |
E-CK-A103 |
|
Cell Stimulation and Protein Transport Inhibitor Kit |
E-CK-A091 |
|
Intracellular Fixation/Permeabilization Buffer Kit |
E-CK-A109 |
|
10×ACK Lysis Buffer |
E-CK-A105 |
|
EasySort™ Mouse CD4+T Cell Isolation Kit |
MIM002N |
|
EasySort™ Mouse CD8+T Cell Isolation Kit |
MIM003N |
|
EasySort™ Mouse CD3+T Cell Isolation Kit |
MIM001N |
|
Human CD3/CD28 T Cell Activation Beads |
MIH001A |
|
Mouse CD3/CD28 T Cell Activation Beads |
MIM001A |
|
Foxp3/Transcription Factor Staining Kit |
E-CK-A108 |
References:
[1] Fowlkes, B. J., & Pardoll, D. M. (1989). Molecular and Cellular Events of T Cell Development. In Advances in Immunology (pp. 207–264). Elsevier. https://doi.org/10.1016/s0065-2776(08)60643-4.
[2] Yoganathan, K., Chen, E. L. Y., Singh, J., & Zúñiga-Pflücker, J. C. (2019). T-Cell Development: From T-Lineage Specification to Intrathymic Maturation. In Thymus Transcriptome and Cell Biology (pp. 67–115). Springer International Publishing. https://doi.org/10.1007/978-3-030-12040-5_4.
[3] 1.Parkin, J., & Cohen, B. (2001). An overview of the immune system. Lancet (London, England), 357(9270), 1777–1789. https://doi.org/10.1016/S0140-6736(00)04904-7.
[4] Ma, D., Wei, Y., & Liu, F. (2013). Regulatory mechanisms of thymus and T cell development. Developmental & Comparative Immunology, 39(1–2), 91–102. https://doi.org/10.1016/j.dci.2011.12.013.
[5] Kortekaas Krohn, I., Aerts, J. L., Breckpot, K., Goyvaerts, C., Knol, E., Van Wijk, F., & Gutermuth, J. (2021). T‐cell subsets in the skin and their role in inflammatory skin disorders. Allergy, 77(3), 827–842. https://doi.org/10.1111/all.15104.
[6] Robert, P. A., Kunze-Schumacher, H., Greiff, V., & Krueger, A. (2021). Modeling the Dynamics of T-Cell Development in the Thymus. Entropy, 23(4), 437. https://doi.org/10.3390/e23040437.
[7] Sakaguchi S , Yamaguchi T , Nomura T ,et al.Regulatory T cells and immune tolerance.[J].Cell, 2008, 133(5):775-787.DOI:10.1016/j.cell.2008.05.009.
[8] Ruiz Pérez, M., Vandenabeele, P., & Tougaard, P. (2024). The thymus road to a T cell: migration, selection, and atrophy. Frontiers in Immunology, 15. https://doi.org/10.3389/fimmu.2024.1443910.
[9] Headen K , Jakaite V , Mesaric V A ,et al.The Role of Regulatory T Cells and Their Therapeutic Potential in Hypertensive Disease of Pregnancy: A Literature Review[J].International Journal of Molecular Sciences, 2024, 25(9):14.DOI:10.3390/ijms25094884.
[10] Liu, J., Liu, F., Liang, T., Zhou, Y., Su, X., Li, X., Zeng, J., Qu, P., Wang, Y., Chen, F., Lei, Q., Li, G., & Cheng, P. (2024). The roles of Th cells in myocardial infarction. Cell Death Discovery, 10(1). https://doi.org/10.1038/s41420-024-02064-6.
[11] Buck, M. D., O'Sullivan, D., & Pearce, E. L. (2015). T cell metabolism drives immunity. The Journal of experimental medicine, 212(9), 1345–1360. https://doi.org/10.1084/jem.20151159.
[12] Ashby, K. M., & Hogquist, K. A. (2024). A guide to thymic selection of T cells. Nature reviews. Immunology, 24(2), 103–117. https://doi.org/10.1038/s41577-023-00911-8.
[13] Larosa, D. F., & Orange, J. S. (2008). 1. Lymphocytes. The Journal of allergy and clinical immunology, 121(2 Suppl), S364–S412. https://doi.org/10.1016/j.jaci.2007.06.016.
[14] Larosa, D. F., & Orange, J. S. (2008). 1. Lymphocytes. The Journal of allergy and clinical immunology, 121(2 Suppl), S364–S412. https://doi.org/10.1016/j.jaci.2007.06.016.
[15] Franco, F., Jaccard, A., Romero, P., Yu, Y. R., & Ho, P. C. (2020). Metabolic and epigenetic regulation of T-cell exhaustion. Nature metabolism, 2(10), 1001–1012. https://doi.org/10.1038/s42255-020-00280-9.
[16] Sakaguchi S. (2005). Naturally arising Foxp3-expressing CD25+CD4+ regulatory T cells in immunological tolerance to self and non-self. Nature immunology, 6(4), 345–352. https://doi.org/10.1038/ni1178.
[17] Mousset, C. M., Hobo, W., Woestenenk, R., Preijers, F., Dolstra, H., & van der Waart, A. B. (2019). Comprehensive Phenotyping of T Cells Using Flow Cytometry. Cytometry. Part A : the journal of the International Society for Analytical Cytology, 95(6), 647–654. https://doi.org/10.1002/cyto.a.23724.
[18] Aljurf M , Ezzat A , Musa M O .Emerging role of γδ T-cells in health and disease[J].Blood Reviews, 2002, 16(4):203-206.DOI:10.1016/S0268-960X(02)00029-2.
[19] Godfrey DI, Uldrich AP, McCluskey J, Rossjohn J, Moody DB. The burgeoning family of unconventional T cells. Nat Immunol. 2015; 16(11): 1114-1123.
[20] Martin E , Treiner E , Duban L ,et al.Stepwise Development of MAIT Cells in Mouse and Human[J].PLoS Biology, 2009, 7(3):e1000054-.DOI:10.1371/journal.pbio.1000054.
[21] Wyatt, A., & Levy, D. (2020). Modeling the Effect of Memory in the Adaptive Immune Response. Bulletin of Mathematical Biology, 82(9). https://doi.org/10.1007/s11538-020-00798-9.
[22] Nishikawa H , Sakaguchi S .Regulatory T cells in tumor immunity[J].International Journal of Cancer, 2010, 127(4):759-767.DOI:10.1002/ijc.25429.
[23] Liechti T R M .OMIP-060: 30-Parameter Flow Cytometry Panel to Assess T Cell Effector Functions and Regulatory T Cells[J].Cytometry, Part A: the journal of the International Society for Analytical Cytology, 2019, 95(11).

