As the "vanguard" of the body's innate immune system, neutrophils are closely associated with various diseases such as infections, inflammation, and autoimmune disorders due to abnormalities in their numbers and functions. Flow cytometry has become a core tool for identifying neutrophils and studying their functions, thanks to its high sensitivity and capability for multiparameter analysis. However, many researchers face confusion when designing protocols: How should specific markers be selected? How should samples be processed to ensure cell viability? What are the key considerations for instrument parameter settings? In this guide, we will break down the essential steps of protocol design: rom sample preparation, antibody selection, instrument setup, data analysis, important considerations and common issues, to complete your experiments efficiently!
Table of Contents
1. Sample preparation: Freshness is critical to avoid cell activation/apoptosis
2. Antibody Selection: Precise combination of markers to avoid fluorescence interference
3. Instrument Setup: Calibration and Precise Gating
4. Data Analysis: Standardized Gating and Appropriate Statistical Methods
5. Precautions: Key Practical Tips and Guidelines
6. Troubleshooting
01 Sample preparation: Freshness is critical to avoid cell activation/apoptosis
Neutrophils are sensitive to the external environment. The core principles of sample processing are "swift, gentle, and avoiding activation," with variations in sample preparation depending on the sample source.
Table 1. Sample Processing Protocols for Flow Cytometry:
Core Steps and Key Considerations for Blood, Bone Marrow, and Tissue Samples
|
Sample Type |
Core Steps of Processing |
Key Considerations |
|
Peripheral Blood |
1) Anticoagulation Treatment: Collect blood using EDTA or heparin anticoagulation tubes to prevent clotting. 2) Red Blood Cell Lysis: Gently lyse red blood cells using 1×ACK red blood cell lysis buffer to avoid hypertonic/hypotonic damage to cells. 3) Washing and Centrifugation: Centrifuge at 1000 rpm for 3-5 minutes and wash twice to remove residual lysis buffer. |
1) Processing should be completed within 2-4 hours after blood collection to avoid prolonged storage, which may lead to cell activation. 2) The duration for red blood cell lysis should not be excessive (typically 3-5 minutes, performed at 4°C or on ice). |
|
1) Dilute 1-2 times with PBS after anticoagulation. 2) Filter through a 200-mesh sieve to remove tissue debris. 3) Perform red blood cell lysis and washing/centrifugation steps (same as for peripheral blood). |
The sieving step is essential to prevent debris from interfering with subsequent cell population analysis. |
|
|
Tissue Samples (e.g., Lung, Spleen) |
1) Perform mechanical grinding or digestion with collagenase/hyaluronidase (37°C, 30-60 minutes). 2) Filter the mixture through a 200-mesh sieve to obtain a single-cell suspension. 3) Centrifuge, wash, and then lyse red blood cells. |
1) Perform mechanical grinding gently by cutting the tissue into small particles, then transfer them to a cell strainer or nylon mesh immersed in PBS buffer for grinding. Filter the mixture again after grinding. 2) The concentration of digestive enzymes needs optimization to avoid excessive digestion and damage to cell surface markers. DNase I can be added to reduce cell clumping. 3) Avoid prolonged red blood cell lysis, as it may affect cell viability (typically 3-5 minutes, performed at 4°C or on ice). |
02 Antibody Selection: Precise combination of markers to avoid fluorescence interference
The flow cytometric identification of neutrophils relies on a combination of "specific markers + exclusion markers," while also ensuring the rationality of fluorochrome panel design. The specific experimental design can be divided into two sections:
2.1 Selection of Target Markers
Specific surface markers for neutrophils include CD16 (FcγRIII), CD66b, CD11b/CD18 (Mac-1), among others. CD16 is highly expressed on mature neutrophils, while its expression is relatively low on immature neutrophils (e.g., band cells). CD66b exhibits the highest specificity and is almost exclusively expressed on neutrophils.
Exclusion markers: Commonly used markers include CD3 (to exclude T cells), CD19 (to exclude B cells), CD56 (to exclude NK cells), CD14 (to exclude monocytes), and Siglec-8 (to exclude eosinophils). These markers help eliminate lymphocytes, monocytes, eosinophils, and other contaminating cells.
Table 2. Reference Marker Combinations for Different Experimental Purposes
|
Sample Type |
Recommended Protocols and Core Markers |
Application |
|
Human Peripheral Blood |
Routine detection: CD45/CD15/CD16 |
Basic phenotyping for a rapid and standardized gating of peripheral blood neutrophil populations. CD66b is more stable than CD16, making it particularly suitable for activated samples |
|
Standard detection: CD45/CD15/CD66b |
||
|
Activation State Detection: CD45/CD16/CD66b/CD11b/CD62L/CD35 |
Activation state analysis: Based on the basic identification, markers such as CD11b (upregulated upon activation), CD62L (downregulated upon activation), and CD35 (complement receptor 1, upregulated upon activation) are added to analyze the activation state |
|
|
Separated granulocytes |
CD66b/CD16/7-AAD/Caspase-3/7 or CD66b/CD16/7-AAD/Annexin V |
Analysis of maturity and functional state to distinguish between necrotic and apoptotic granulocytes. |
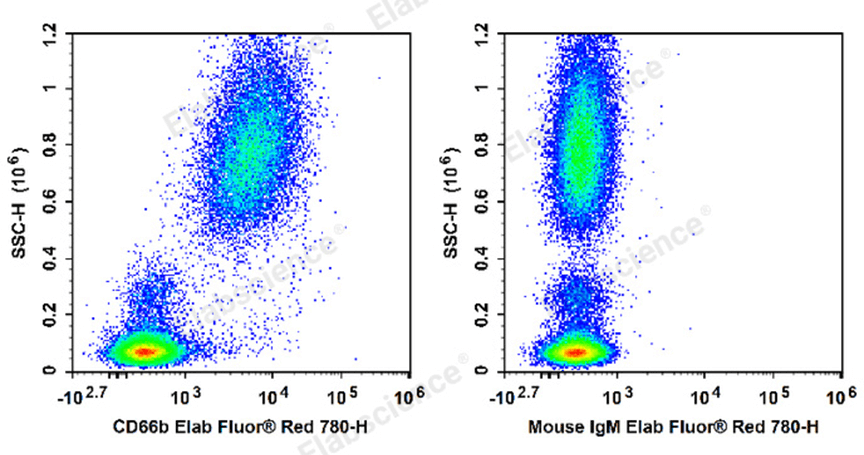
Fig. 1 Human peripheral blood leucocytes are stained with Elab Fluor® Red 780 Anti-Human CD66b Antibody[G10F5] (E-AB-F1267S) (Left). Leucocytes are stained with Elab Fluor® Red 780 Mouse IgM,κ Isotype Control[MM-30](E-AB-F09782S)(Right).
Table 2. Reference Panel for Human Peripheral Blood Granulocyte Detection
|
Marker |
Fluorochrome |
Cat. No. |
Application |
|
CD45 |
Elab Fluor®Violet 450 |
Reference Panel for Human Peripheral Blood Granulocyte Detection |
|
|
CD3 |
FITC |
||
|
CD14 |
Elab Fluor®Red 780 |
||
|
CD16 |
Elab Fluor®700 |
||
|
CD11b |
Elab Bright™Violet 510 |
||
|
CD35 |
APC |
||
|
CD62L |
PE/Cyanine 7 |
||
|
CD66b |
PE |
||
|
7-AAD |
—— |
2.2 Fluorochrome Panel Design Principles
① Brightness Matching Principle: Specific markers with strong, high-level expression (e.g., CD66b) should be paired with "low-brightness" fluorochromes (e.g., FITC), while exclusion markers or low-expression markers should be paired with "high-brightness" fluorochromes (e.g., PE, APC).
② Avoid Spectral Overlap: Fluorochromes with significant spectral overlap (e.g., FITC and PE) should not be used together. Instead, choose "non-overlapping fluorochrome combinations," such as FITC (CD66b) + PE (CD16) + APC (CD14) + PE-Cy7 (CD3).
③ Consider Instrument Configuration: Select fluorochromes based on the laser channels available on the flow cytometer (e.g., a 3-laser instrument can accommodate common fluorochromes like FITC, PE, and APC).
03 Instrument Setup: Calibration and Precise Gating
The core of instrument setup lies in "ensuring signal stability" and "accurately gating the target cell population." The specific steps are as follows:
1.1 Instrument Calibration
Before the experiment, calibrate the instrument's light scatter channels (FSC, SSC) and fluorescence channels using standard beads to ensure signal consistency across different batches of experiments. Additionally, set a "threshold" (typically based on FSC) to exclude debris and noise signals.
1.2 Gating Strategy
The gating logic follows a stepwise narrowing process: "total cells → nucleated cells → granulocytes → neutrophils → target subpopulations/functional cells."
Step 1: Use FSC-A vs SSC-A to gate the total cell population and exclude small debris.
Step 2: Use FSC-H vs FSC-A to gate single cells and exclude cell aggregates (to avoid signal interference from overlapping cells).
Step 3: Use SSC-A vs CD45 to gate nucleated cells (CD45+) and exclude anucleated cells such as red blood cells and platelets.
Step 4: Within nucleated cells, gate granulocytes based on SSC intensity (neutrophils belong to granulocytes, characterized by high SSC expression, distinguishing them from lymphocytes with low SSC and monocytes with moderate SSC).
Step 5: Within granulocytes, use specific markers to gate neutrophils (e.g., CD66b+CD16+), while excluding contaminating cells such as CD14+ monocytes.
Step 6: If subpopulation or functional analysis is required, further gate within the neutrophil population for CD16high (mature) / CD16low (immature) or CD11b+ (activated) cells.
04 Data Analysis: Standardized Gating and Appropriate Statistical Methods
4.1 Control Setup
It is essential to include a blank control (unstained cells for adjusting autofluorescence), an isotype control (an irrelevant antibody of the same subtype as the primary antibody to exclude nonspecific binding), and single-stained controls (for adjusting fluorescence compensation, especially in multicolor experiments).
4.2 Result Analysis
Key data include "the proportion of neutrophils in total cells," "the proportion of neutrophils in granulocytes," and "the proportion of target subpopulations (e.g., activated neutrophils) within neutrophils." Additionally, the mean fluorescence intensity (MFI) can be analyzed to reflect the expression levels of markers.
4.3 Software Selection
Commonly used software for data analysis includes FlowJo and ModFit. During gating, consistency must be maintained to avoid result bias caused by variations in gating criteria across different samples.
05 Precautions: Key Practical Tips and Guidelines
5.1 Sample Processing
Must Be "Fast": Neutrophils are prone to activation, so the entire process from blood collection/tissue sampling to staining should ideally be completed within 2 hours. Performing all steps on ice (except for digestion) can help minimize activation.
5.2 Antibody Incubation
Must Be "Accurate": Follow the optimal dilution ratio strictly and incubate for 20-30 minutes (protected from light at 4°C). After incubation, wash twice with cold PBS to remove unbound antibodies.
5.3 Avoid Cell Clumping
Gently pipette cells during processing and avoid vigorous shaking. The sieving step is essential, and single-cell populations must be strictly gated during data analysis.
5.4 Prioritize Compensation
Optimization in Multicolor Experiments: Fluorescence compensation is critical for multicolor flow cytometry. Improper compensation adjustment can lead to misinterpretation of marker positivity rates. It is recommended to use single-stained controls to fine-tune compensation values for each fluorescence channel.
06 Troubleshooting
6.1 Why is the positivity rate of neutrophils very low in the experimental results?
Possible causes: ① Sample activation leading to downregulation of marker expression; ② Antibody concentration too low or insufficient incubation time; ③ Incorrect gating, resulting in missed granulocyte populations; ④ Excessive digestion of tissue samples, damaging cell surface markers. It is recommended to review the sample processing workflow and gating strategy.
6.2 How to distinguish neutrophils from eosinophils?
Both are granulocytes (high SSC) but can be distinguished using specific markers: Neutrophils are CD66b+CD16+, while eosinophils are Siglec-8+. Including a Siglec-8 antibody in the panel can effectively exclude eosinophil interference.
6.3 What are the key points for identifying immature neutrophils?
Immature neutrophils (e.g., band cells, promyelocytes) exhibit lower CD16 expression (CD16low). They can be distinguished using markers such as CD33 (upregulated in immature cells) and CD66b (positive). Additionally, immature neutrophils typically show slightly lower SSC intensity compared to mature neutrophils.
In summary, the core logic of designing a flow cytometry protocol for neutrophil identification lies in "precisely aligning with experimental objectives, strictly controlling sample viability, and standardizing operational procedures." Mastering these key points can significantly reduce the need for experimental repetition and enhance data reliability!

