Research indicates that T cells must be transferred to long-term culture immediately after rapid activation. Long-term T cell culture is a critical technological platform bridging fundamental immunology research and clinical translational applications. This system, by simulating the chronic stimulation microenvironment in vivo, enables dynamic tracking of the continuous trajectory of T cell evolution from naïve states to effector, memory, or exhausted states. It provides an ideal tool for deeply exploring and precisely analyzing the molecular switches (such as TCF-1, TOX) that determine T cell fate. Concurrently, through optimized cytokine combinations (e.g., IL-2/IL-7/IL-15) and metabolic regulation strategies, it allows for the scalable enrichment of "stem-like" subsets like stem cell memory T cells (TSCM), offering high-quality seed cells for the development of next-generation cell therapies.
Our previous article detailed the crucial initial step in long-term T cell culture: the core strategies and technical key points for in vitro rapid activation. In this issue, we will introduce the experimental protocols and related technical points for long-term T cell culture, including replacing the medium with a low-stimulation intensity formulation containing IL-2/IL-7/IL-15 and maintaining dynamic subculture for 3-4 weeks. During the culture period, it is essential to regularly assess T cell phenotypic markers (CD62L, CD45RA, CD45RO, PD-1, CD95, CD197), functional effector characteristics (IFN-γ secretion levels, proliferative capacity), and mitochondrial activity. This allows for real-time evaluation of the maintenance of cell stemness and the progression of exhaustion.
This article comparatively analyzes human peripheral blood mononuclear cells (PBMCs), negatively selected human peripheral blood CD3+ T cells, and negatively selected human peripheral blood Pan Naive T cells cultured for 20 days in a medium containing only IL-2 (without IL-7+IL-15) as a single cytokine. It examines their proliferative status, changes in cell phenotype, and metabolic characteristics during short-term culture, hoping to provide a reference for researchers in their experiments.
Table of Contents
1. Presentation of experimental results: T cell phenotype, function, and metabolism
2. Protocol for rapid activation and long-term culture of PBMCs and T cells
3. Key operational considerations and quality control for long-term T cell culture
4. Key reagents for T cell expansion and function
01 Presentation of experimental results: T cell phenotype, function, and metabolism
1.1 Phenotypic and Metabolic Functional Analysis of T Cells During Long-Term Culture
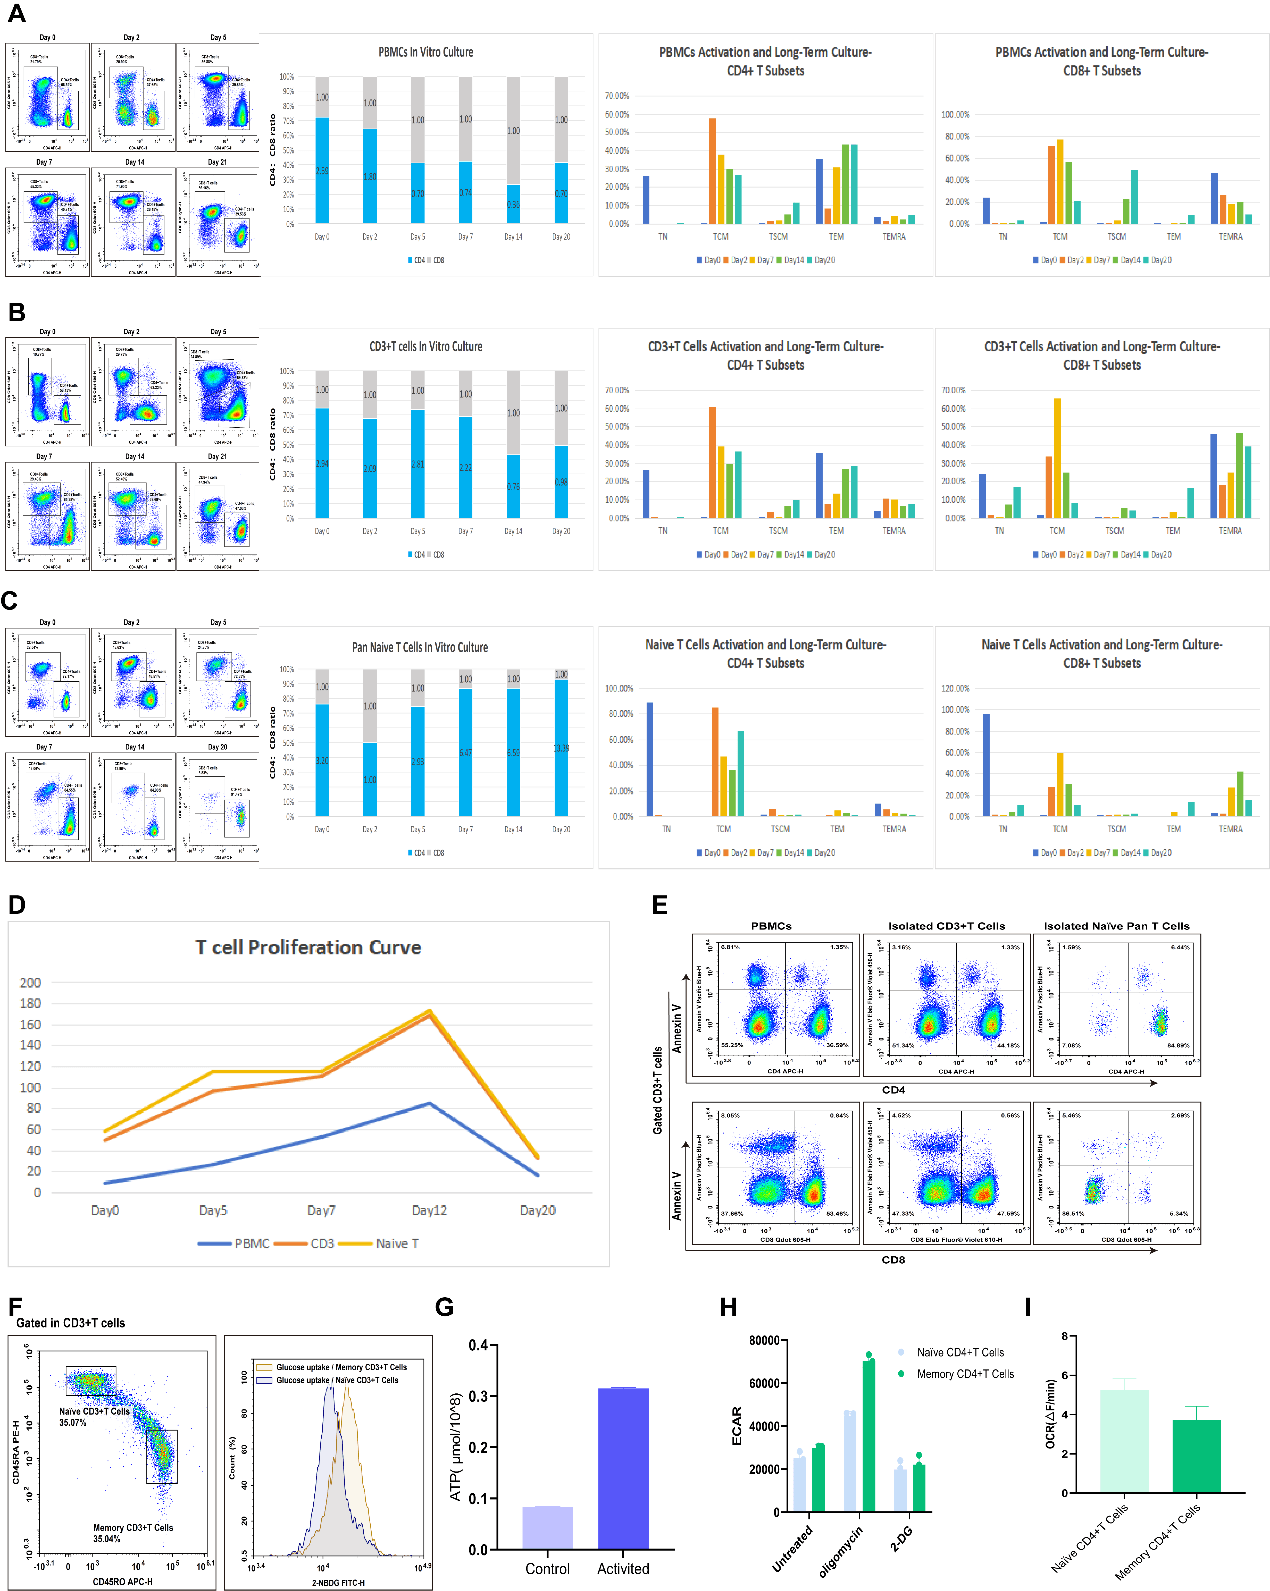
Fig. 1 Assessment of T cell status and function during long-term culture. (A) PBMCs isolated from human peripheral blood were activated with CD3/CD28 magnetic beads for 5 days. Beads were then removed, and cells were cultured until day 20. The CD4/CD8 ratio and the distribution of T cell subsets (TN, TCM, TEM, TEMRA, TSCM) were analyzed. (B) CD3+ T cells sorted from human peripheral blood were cultured for 20 days using the same method as in (A). The CD4/CD8 ratio and the proportions of target subsets were analyzed. (C) Pan Naive T cells sorted from human peripheral blood were cultured for 20 days using the same method as in (A). The CD4/CD8 ratio and the proportions of target subsets were analyzed. (D, E) Proliferation kinetics from day 0 to day 20 and apoptosis levels on day 20 were assessed for the three starting T cell populations. In culture medium lacking IL-7 and IL-15 bioactivity, the proliferative capacity of all three cell types significantly decreased by day 12. (F) Comparison of glucose uptake capacity between memory T cells (T mem) and naïve T cells (T naive). The T mem population exhibited higher glucose uptake capacity compared to T naive cells. (G) CD3+ T cells sorted from human peripheral blood were activated with CD3/CD28 beads for 3 days. Intracellular ATP levels were measured and compared to the control group. ATP levels were significantly elevated following activation. (H) CD4+ T naive and CD4+ T mem cells sorted from human peripheral blood were assessed for extracellular acidification rate (ECAR). CD4+ T mem cells displayed higher glycolytic activity. (I) CD4+ T naive and CD4+ T mem cells sorted from human peripheral blood were assessed for oxygen consumption rate (OCR). Mitochondrial respiration in CD4+ T mem cells was significantly lower than in CD4+ T naive cells.
Results Analysis
(1) In the absence of IL-7 and IL-15 in the culture medium, the proliferative capacity of all three cell types significantly decreased by day 12 of culture.
(2) During the culture of PBMCs, the CD4/CD8 ratio showed a gradual downward trend. The proportions of stem cell memory T cells (TSCM) and effector memory T cells (TEM) progressively increased, reaching peak levels by day 20. Notably, the proportion of CD8+ TSCM cells was significantly higher than that of CD4+ TSCM, while the proportion of CD4+ TEM was significantly higher than that of CD8+ TEM. Furthermore, the proportion of CD8+ terminally differentiated effector memory T cells (TEMRA) was markedly higher compared to CD4+ TEMRA.
(3) Using negatively selected human peripheral blood CD3+ T cells as the starting population, the CD4/CD8 ratio increased significantly between days 5-7 of culture and then gradually declined. The proportions of TSCM and central memory T cells (TCM) continued to rise, reaching their peaks at day 20. In this context, the proportion of CD4+ TSCM cells was slightly higher than that of CD8+ TSCM, the proportion of CD4+ TEM was significantly higher than that of CD8+ TEM, and the proportion of CD8+ TEMRA was significantly higher than that of CD4+ TEMRA.
(4) Using negatively selected human peripheral blood Pan Naive T cells as the starting population, the CD4/CD8 ratio decreased initially by day 2 of culture but then increased continuously, reaching its maximum value by day 20. During the proliferation process, the proportion of TSCM cells did not change significantly. Among the T cell subsets, TCM constituted the highest proportion.
1.2 Assessment of Cytokine Secretion Function in T Cells Activation and Culture
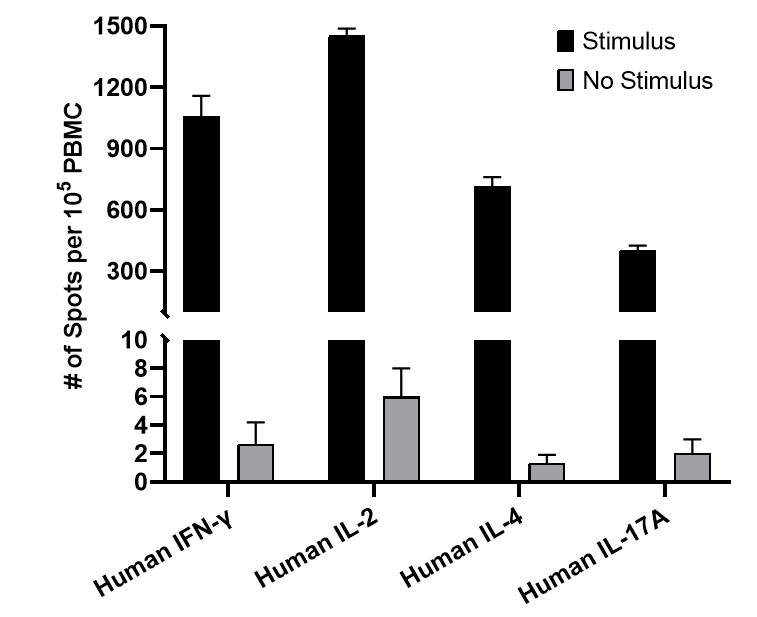
Fig. 2 Assessment of T cell function by ELISPOT. PBMCs were incubated for 20 h in the absence or presence of stimulatory Anti-CD3 mAb (500 ng/mL). The expression of T cell-associated cytokines, including IFN-γ, IL-2, IL-4, and IL-17A, was detected using ELISPOT assay.
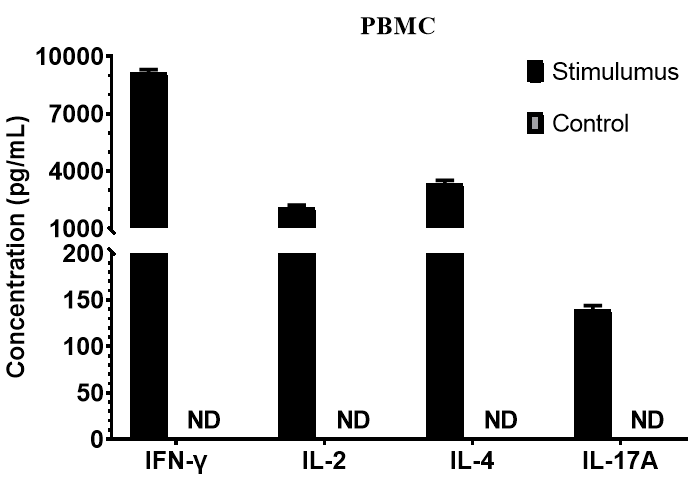
Fig. 3 Human PBMCs (1×10⁶ cells/mL) were either left untreated or stimulated for 1 day with 10 μg/mL PHA + 10 ng/mL PMA, or with PMA (50 ng/mL) + Ionomycin (500 ng/mL). The levels of IFN-γ, IL-2, IL-4, and IL-17A in the cell culture supernatants were measured by ELISA.
02 Protocol for rapid activation and long-term culture of PBMCs and T cells
2.1 Reagent Preparation
(1) T Cell Activation Medium: RPMI-1640 basal medium supplemented with 10% FBS, 1× L-Glutamine (2 mM), and 1× Penicillin-Streptomycin-Neomycin (PSN).
(2) T Cell Long-Term Culture Medium: RPMI-1640 basal medium supplemented with IL-2 (50 U/mL), 10% FBS, 1× L-Glutamine (2 mM), and 1× Penicillin-Streptomycin-Neomycin (PSN). (Note: IL-7 and IL-15 were not added in this experiment).
2.2 Cell Isolation
(1) Collect fresh human peripheral blood and isolate PBMCs. For detailed procedures, refer to the product manual for the Human PBMC Separation Solution (P 1.077) (E-CK-A103).
(2) Collect fresh human peripheral blood and isolate PBMCs. Subsequently, isolate CD3+ T cells and Pan Naive T cells using the EasySort™ Human CD3+T Cell Isolation Kit (MIH001N) and the EasySort™ Human Naïve Pan T Cell Isolation Kit (MIH006N), respectively. For detailed procedures, please refer to the corresponding product manuals.
2.3 Procedure for Rapid Activation and Long-Term Culture of T Cells
(1) Resuspend the isolated cells in T Cell Activation Medium. Perform cell counting, then centrifuge at 150-300 × g for 3 min and discard the supernatant.
(2) Resuspend the cell pellet using T Cell Activation Medium and adjust the cell density to 1 × 10⁶/mL.
(3) Based on the cell count, take an appropriate volume of Human CD3/CD28 T Cell Activation Beads (MIH001A). Add 1 mL of T Cell Activation Medium, magnetically wash the beads once, and then resuspend them. Co-incubate the beads with the cells at 37°C with 5% CO₂ for 24 h to complete the initial activation. (For detailed steps, please refer to the product manual).
(4) After 24 h, supplement the culture with half the volume of Activation Medium. Continue the activation culture for an additional 48-96 h, then remove the activation microbeads using a magnet.
Upon completion of activation, resuspend the cells in T Cell Long-Term Culture Medium (IL-2 single-factor maintenance medium). Adjust the cell density to 5 × 10⁵/mL and culture at 37°C with 5% CO₂. Observe cell status and take photographs daily. During the culture process, perform a half-medium change every 48 h and a complete medium change every 96 h. Collect samples on days 0, 2, 5, 7, 12, 14, and 20 to assess T cell subsets and apoptosis status. For detailed detection procedures, please refer to the provided link.
03 Key operational considerations and quality control for long-term T cell culture
(1) Sample collection must strictly adhere to aseptic protocol, and all steps should be completed within a laminar flow cabinet.
(2) Ideally, perform cell isolation experiments within 4 h of sample collection. If immediate activation is not possible after isolation, resuspend the cells in T Cell Activation Medium and store them temporarily in a refrigerator at 4°C for no more than 3 h.
(3) Within 3-5 days of cell activation, remove the activation microbeads promptly based on cell status to avoid premature exhaustion induced by continuous stimulation. Gradient ratios of cells to beads and gradient activation times can be tested to determine the optimal activation conditions.
(4) Before each complete medium change and subculture, verify cell viability by microscopy, and ensuring it is >90%. Record cell morphology, degree of clumping, and the proportion of suspended/adherent cells. If viability falls below the threshold, terminate the experiment immediately and investigate potential sources of contamination or operational deviations. During subculture, use gentle pipetting to collect cells; avoid vigorous shaking or repeated pipetting to minimize mechanical damage and non-specific apoptosis.
(5) When collecting cells for subculture, do not exceed a centrifugal force of 300 × g. If a high number of dead cells is present, the centrifugal force can be reduced to 100-150 × g to help remove them. Set the centrifuge acceleration to no more than 3 and deceleration to no more than 2 to reduce cell loss caused by centrifugation.
(6) During cell analysis, remember to add Human Fc Receptor Blocking Solution for blocking. Additionally, stain with a Fixable Viability Kit to exclude dead cells, ensuring more accurate data acquisition.
04 Key reagents for T cell expansion and function
Table 1. Key reagents and kits for T cell isolation, activation, expansion, and functional analysis
|
Product Name |
Cat. No. |
|
Human PBMC Separation Solution(P 1.077) |
E-CK-A103 |
|
EasySort™ Human CD3+T Cell Isolation Kit |
MIH001N |
|
EasySort™ Human Naïve Pan T Cell Isolation Kit |
MIH006N |
|
EasySort™ Human Naïve CD4+T Cell Isolation Kit |
MIH007N |
|
EasySort™ Human Memory CD4+T Cell Isolation Kit |
MIH009N |
|
Human CD3/CD28 T Cell Activation Beads |
MIH001A |
|
EasyStain™ Human Fc Receptor Blocking Solution |
E-CK-A171 |
|
APC Anti-Human CD279/PD-1 Antibody[EH12.2H7] |
E-AB-F1229E |
|
PE Anti-Human Granzyme B Antibody[QA18A28] |
AN00961D |
|
AF/LE Purified Anti-Human CD366 Antibody[F38-2E2] |
AN009710 |
|
STYX™ Green Fixable Viability Kit |
E-CK-A166 |
|
STYX™ Near-IR Fixable Viability Kit |
E-CK-A168 |
|
Foxp3/Transcription Factor Staining Kit |
E-CK-A108 |
|
Intracellular Fixation/Permeabilization Buffer Kit |
E-CK-A109 |
|
CFSE Cell Division Tracker Kit |
E-CK-A345 |
|
PerCP Anti-Human CD3 Antibody[OKT-3] |
E-AB-F1001F |
|
APC Anti-Human/Monkey CD4 Antibody[SK3] |
E-AB-F1352E |
|
Elab Fluor® Violet 610 Anti-Human CD8a Antibody[OKT-8] |
E-AB-F1110T |
|
PE/Cyanine7 Anti-Human CD45RA Antibody[HI100] |
E-AB-F1052H |
|
Elab Fluor® Violet 540 Anti-Human CD62L Antibody[DREG56] |
E-AB-F1051T3 |
|
Elab Fluor® 700 Anti-Human CD95/Fas Antibody[DX2] |
E-AB-F1168M1 |
|
FITC Anti-Human CD45RO Antibody[UCHL1] |
E-AB-F1139C |
|
Elab Fluor® Violet 450 Anti-Human CD197/CCR7 Antibody[G043H7] |
E-AB-F1159Q |
|
PE Anti-Human CD69 Antibody[FN50] |
E-AB-F1138D |
|
PE/Cyanine5 Anti-Human CD25 Antibody[BC96] |
E-AB-F1194G |
|
Elab Fluor® Violet 500 Anti-Human HLA-DR Antibody[L243] |
E-AB-F1111R |
|
Cell Staining Buffer |
E-CK-A107 |
|
2-NBDG Glucose Uptake Cell-Based Kit |
E-CK-A441 |
|
Extracellular Acidification Rate (ECAR) Fluorometric Assay Kit |
E-BC-F069 |
|
Enhanced Oxygen Consumption Rate (OCR)Fluorometric Assay Kit |
E-BC-F070 |
|
Enhanced ATP Chemiluminescence Assay Kit |
E-BC-F201 |
|
Annexin V-Elab Fluor® Violet 450 Reagent |
E-CK-A133 |
|
Human IFN-γ (Interferon Gamma) ELISPOT Kit |
ESP-H0002 |
|
Human IL-17A (Interleukin 17A) ELISPOT Kit |
ESP-H0004 |
|
Human IL-2 (Interleukin 2) ELISPOT Kit |
ESP-H0006 |
|
Human IL-4 (Interleukin 4) ELISPOT Kit |
ESP-H0007 |
|
CellaQuant™ Human IFN-γ (Interferon Gamma) ELISA Kit |
CQH003 |
|
CellaQuant™ Human IL-2 (Interleukin 2) ELISA Kit |
CQH008 |
|
CellaQuant™ Human IL-17A (Interleukin 17A) ELISA Kit |
CQH010 |
|
Human IL-4(Interleukin 4) ELISA Kit |
E-EL-H0101 |
This experiment provides a detailed comparison of the expansion efficacy, subpopulation fate trajectories, and functional homeostasis maintenance of three T cell populations (PBMCs, CD3+ T cells, and Pan Naive T cells) under a long-term culture system with IL-2 as the sole cytokine. Significant differences were observed among the three groups. If you would like to learn more about the detailed aspects, feel free to leave a comment to discuss. In the future, we will continue to share strategies for metabolic detection and state analysis in long-term T cell culture. Stay tuned!
References:
[1] Xu H, Wang N, Cao W, et al. Influence of various medium environment to in vitro human T cell culture[J]. In Vitro Cellular & Developmental Biology-Animal, 2018, 54(8): 559-566.
[2] Chow A, Perica K, Klebanoff C A, et al. Clinical implications of T cell exhaustion for cancer immunotherapy[J]. Nature reviews Clinical oncology, 2022, 19(12): 775-790.
[3] Van der Leun A M, Thommen D S, Schumacher T N. CD8+ T cell states in human cancer: insights from single-cell analysis[J]. Nature Reviews Cancer, 2020, 20(4): 218-232.
[4] Gebhardt T, Park S L, Parish I A. Stem-like exhausted and memory CD8+ T cells in cancer[J]. Nature Reviews Cancer, 2023, 23(11): 780-798.
[5] Sun Q, Dong C. Regulators of CD8+ T cell exhaustion[J]. Nature Reviews Immunology, 2025: 1-23.
[6] Xu J, Jia Z, Zhao X, et al. BCOR and ZC3H12A suppress a core stemness program in exhausted CD8+ T cells[J]. Journal of Experimental Medicine, 2025, 222(8): e20241133.

