

Efficient dendritic cell (DC)-T cell co-culture systems constitute an essential experimental foundation for investigating adaptive immune activation, antigen cross-presentation, and cytokine responses including IFN-γ. Optimization of key experimental parameters, ranging from DC maturation status to co-culture incubation duration, critically determines the reliability and reproducibility of immunological functional assessments.
This review systematically summarizes the dynamic expression patterns of CD80 and CD86 during dendritic cell (DC) activation and T cell priming. It further elaborates on the effects of DC maturation status on the magnitude of T cell activation, antigen loading efficiency in DC–T cell co-culture systems, and the cross-presentation capability of DCs in regulating the activation of CD8+ and CD4+ T cells. Additionally, this review characterizes the temporal dynamic changes of T cell activation markers, including CD69 and CD25, post DC stimulation. The flow cytometry-based detection of intracellular interferon-gamma (IFN-γ) in activated CD4+ T cells is also comprehensively described. Finally, this work discusses the optimal co-culture duration for lipopolysaccharide (LPS)-stimulated DCs and CD4+ T cells, which serves as a critical parameter for intracellular IFN-γ staining assays.
Table of Contents
1. CD80/CD86 expression dynamics during DC activation and T cell priming
2. Impact of DC maturation state on T cell activation strength
3. Antigen loading efficiency in dendritic cell–T cell co-culture systems
4. Cross-presentation capacity of dendritic cells in CD8+ and CD4+ T cell activation systems
5. Time-course dynamics of T cell activation markers (CD69, CD25) after DC stimulation
6. Flow cytometry-based intracellular IFN-γ detection in activated CD4+ T cells
7. Optimal co-culture duration of LPS-treated DCs and CD4⁺ T cells for IFN-γ intracellular staining
01 CD80/CD86 expression dynamics during DC activation and T cell priming
Dendritic cells (DCs) are pivotal for the initiation of T-cell immune responses, and their activation state is tightly governed by the dynamic expression of the co‑stimulatory molecules CD80 and CD86. Accumulating evidence has demonstrated that diverse immunomodulatory factors modulate DC maturation and the surface abundance of CD80/CD86, thereby dictating the activation and differentiation of T cells. For instance, cholera toxin (CT) functions as a mucosal adjuvant via a distinct mechanism: intact CT, rather than its individual subunits, triggers intestinal epithelial injury and subsequent HMGB1 release[1]. This process potently upregulates CD80 and CD86 expression on mucosal DCs, which facilitates antigen cross-presentation and elicits intestinal cytotoxic T lymphocyte (CTL) and IgA responses. Consistent with this regulatory pattern, galectin‑8 (Gal‑8) has been validated to activate DCs and elevate co‑stimulatory molecule levels, ultimately reinforcing antigen-specific immune activation[2].
In contrast, several endogenous factors exert inhibitory effects on DC-mediated immune activation. Specifically, IL‑37b suppresses DC maturation and the induction of CD80/CD86 by blocking the ERK/NF‑κB/S6K signaling cascade, which compromises the priming capacity of initial T-cell responses. Similarly, exogenous pharmacological intervention with ketamine impairs the functional maturation of bone marrow-derived DCs, markedly diminishes CD80/CD86 surface expression, and abrogates the initiation of Th1-type immune responses[3].
Collectively, these findings identify CD80/CD86 as core regulatory hubs governing DC-T cell crosstalk. Notably, most current studies are predominantly based on mouse models and in vitro culture systems. Two major limitations remain unaddressed: insufficient characterization of the temporal dynamics governing CD80 and CD86 expression, and the lack of single-cell-resolution phenotypic tracking and functional validation in existing mechanistic investigations. These methodological shortcomings highlight an urgent need for refined spatiotemporal profiling strategies to advance the precise understanding of DC-centered immune regulation[4].
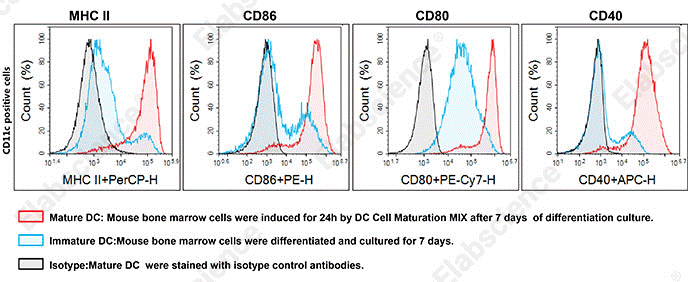
Fig. 1 Phenotypic analysis of BMDCs. Flow cytometric comparison of bone marrow cell differentiation derived from 7-week-old male C57BL/6 mice. Cells underwent 7 days of differentiation culture followed by 1 additional day of maturation induction. We obtained 7-day differentiated mature BMDCs with high expression of MHC II, CD86, CD80 and CD40. (The data are provided by Elabscience.)
Elabscience® Quick Overview of Popular Products:
Table 1. Reagents used for DC activation and maturation studies
|
Product Name |
Cat. No. |
|
Mouse Bone Marrow-derived Dendritic Cells (BMDC) Induction and Identification Kit |
XJM003 |
|
PE Anti-Mouse CD80 Antibody[16-10A1] |
E-AB-F0992D |
|
APC Anti-Mouse CD86 Antibody[GL-1] |
E-AB-F0994E |
|
PE Anti-Human CD86 Antibody[BU63] |
E-AB-F1012D |
|
APC Anti-Human CD80 Antibody[2D10] |
E-AB-F1232E |
|
FITC Anti-Mouse CD11c Antibody[N418] |
E-AB-F0991C |
|
FITC Anti-Human CD11c Antibody[BU15] |
E-AB-F1118C |
02 Impact of DC maturation state on T cell activation strength
The DC-T cell co-culture system is a core experimental platform for evaluating vaccine efficacy, optimizing adoptive cell therapy (ACT), and dissecting antigen-specific T cell receptor (TCR) recognition. Poor IFN-γ production, high background signals, and low reproducibility in such assays mainly result from inaccurate assessment or uncontrolled DC maturation. Accordingly, elucidating the quantitative correlation between DC maturation and T cell activation is essential for precise modulation of adaptive immune responses.
DC maturation is not a binary switch between immature and fully mature states but a continuous dynamic process. Thus, DCs at distinct maturation stages exhibit substantial phenotypic and functional heterogeneity, as summarized in Table 1[5,6].
Table 2. Comparison of phenotypic and functional characteristics of DCs at distinct maturation stages
|
Maturation State |
Induction Factor |
Immunophenotype |
Biological Function |
|
Immature dendritic cell (imDC) |
Steady-state differentiation, retention in peripheral tissues |
Low MHC II/I; CD80/86/CD83-negative; high phagocytic capacity |
Immune surveillance, induction of T-cell inactivation, or Treg differentiation |
|
Semi-mature/tolerogenic DC |
Low-does TLR ligands, apoptotic cells, factors within the tumor microenvironment (VEGF, TGF-β), and endotoxin contamination |
Moderate expression of MHC; mild upregulation of CD80/86 (1–3-fold); high expression of PD-L1/IDO |
Immune tolerance leads to high background noise, which interferes with antigen-specific recognition |
|
Moderately mature DC |
Established protocol using LPS plus IFN-γ and poly(I:C) plus TNF-α |
High MHC expression (8–15-fold); high CD80/86 expression (5–10-fold); CD83/CD40-positive |
Potent immune activation, inducing Th1/CTL differentiation |
|
Overmature DC |
High-dose TLR agonists (>1 μg/mL LPS), prolonged incubation (>48 h), mechanical injury |
Extremely high levels of co-stimulatory molecules; increased apoptosis rate; surging levels of inhibitory molecules (PD-L1/CTLA-4) |
Functional exhaustion, or even a shift toward an immunosuppressive phenotype |
DC maturation regulates T cell activation in a canonical nonlinear S-shaped pattern controlled by costimulatory threshold effects and intrinsic negative feedback mechanisms. When surface CD80/CD86 mean fluorescence intensity (MFI) is below three-fold of the immature baseline, insufficient secondary costimulation (Signal 2) fails to initiate T cell activation, yielding IFN-γ production equivalent to negative controls; this tolerant state is driven by semi-mature DCs. At a moderate maturation level (3–8-fold baseline CD80/CD86 MFI), T cell activation positively correlates with costimulatory molecule abundance. Moderately mature DCs enable synergistic crosstalk among MHC-peptide presentation (Signal 1), costimulatory signaling (Signal 2), and IL-12p70-mediated polarization (Signal 3), thereby driving linear increases in T cell IFN-γ secretion[7].
In contrast, CD80/CD86 MFI exceeding 10-fold of the baseline induces plateaued and subsequently attenuated T cell activation. This suppressive effect arises from upregulated inhibitory molecules (including PD-L1 and CTLA-4 ligands) and elevated apoptosis in over-matured DCs, whose combined negative regulatory circuits counteract DC immunostimulatory functions. This nonlinear activation pattern provides a quantitative framework for precise DC maturation quality control in co-culture systems[8].
DC maturation status serves as a master switch governing the magnitude and functional polarity of T cell immune responses. Future studies should prioritize functional validation over conventional phenotypic profiling, including MHC tetramer-based quantification of antigen presentation efficiency and single-cell transcriptomic analysis of T cells primed by differentially matured DCs. For clinical translation, precise modulation of DC maturation to avoid immature and over-matured phenotypes is critical for improving tumor vaccine efficacy and reducing autoimmune risks.
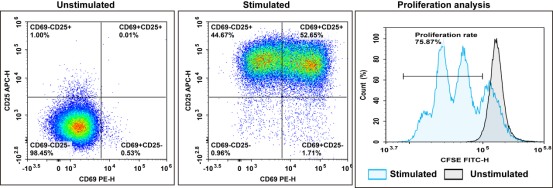
Fig. 2 Detection and analysis of activated CD3+ T cells. Human fresh peripheral blood mononuclear cells (PBMCs) were enriched for CD3+ T cells using the EasySort™ Human CD3⁺ T Cell Isolation Kit. Purified T cells were stimulated with Human CD3/CD28 T Cell Activation Beads for 3 days, followed by flow cytometric detection of CFSE+CD69+CD25+ populations. (The data are provided by Elabscience.)
Elabscience® Quick Overview of Popular Products:
Table 3. Reagents used for T Cell activation studies
|
Product Name |
Cat. No. |
|
EasySort™ Mouse CD8+T Cell Isolation Kit |
MIM003N |
|
EasySort™ Mouse CD3+T Cell Isolation Kit |
MIM001N |
|
EasySort™ Mouse CD4+T Cell Isolation Kit |
MIM002N |
|
EasySort™ Human CD3+T Cell Isolation Kit |
MIH001N |
|
EasySort™ Human CD4+ T Cell Isolation Kit |
MIH002N |
|
EasySort™ Human CD8+ T Cell Isolation Kit |
MIH003N |
|
EasySort™ Human Naïve Pan T Cell Isolation Kit |
MIH006N |
|
EasySort™ Human Naïve CD4+T Cell Isolation Kit |
MIH007N |
|
EasySort™ Mouse Pan-Naïve T Cell Isolation Kit |
MIM006N |
|
EasySort™ Mouse Naïve CD4+T Cell Isolation Kit |
MIM007N |
|
EasySort™ Mouse Naïve CD8+T Cell Isolation Kit |
MIM008N |
|
EasySort™ Human Naïve CD8+T Cell Isolation Kit |
MIH008N |
|
Human CD3/CD28 T Cell Activation Beads |
MIH001A |
|
Mouse CD3/CD28 T Cell Activation Beads |
MIM001A |
|
Cell Stimulation and Protein Transport Inhibitor Kit |
E-CK-A091 |
|
CFSE Cell Division Tracker Kit |
E-CK-A345 |
|
APC Anti-Human CD69 [FN50] |
E-AB-F1138E |
|
PE Anti-Human CD25 Antibody[BC96] |
E-AB-F1194D |
|
FITC Anti-Human HLA-DR [L243] |
E-AB-F1111C |
|
PerCP/Cyanine5.5 Anti-Human CD3 [UCHT1] |
E-AB-F1230J |
03 Antigen loading efficiency in dendritic cell–T cell co-culture systems
Dendritic cells (DCs) function as primary antigen-presenting cells that bridge innate immune surveillance and adaptive immune activation. In vitro DC–T cell co-culture systems have become a foundational experimental tool for uncovering T cell priming mechanisms, validating vaccine candidates, and advancing engineered adoptive cell therapies. Mechanistically, the antigen loading efficiency of such systems reflects the overall competence of DCs to internalize and process exogenous antigens, present peptide epitopes to T cells via peptide-MHC (pMHC) complexes, and initiate robust T cell-mediated immune responses.
3.1 Key Factors Modulating Antigen Loading Efficiency
(1) Antigen Form and Source
Antigen physical form and biological source are key variables that determine DC antigen loading performance and subsequent T cell activation. A glioblastoma (GBM)-focused study systematically compared three widely adopted DC antigen loading approaches including tumor stem cell lysate (GSC-lysate), acid eluate, and synthetic peptide pools for their ability to trigger T cell activation. The results demonstrated that synthetic peptide pools uniquely augmented T cell IFN-γ production and potentiated T cell cytotoxicity against GBM target cells. These findings support the conclusion that antigens from distinct sources and structural forms vary greatly in DC uptake, intracellular processing, and MHC-restricted presentation, thereby generating divergent T cell functional outcomes[9].
(2) Antigen Dosage
Antigen dosage is a pivotal parameter that defines the magnitude and quality of T cell activation in DC-T cell co-cultures. DC-T cell immune interactions occur in three temporally regulated functional stages. The initial stage consists of transient and iterative cell-cell contacts whose duration negatively correlates with antigen dosage. The subsequent stage involves the formation of stable DC-T cell conjugates, which is indispensable for full and durable T cell activation. By reshaping the kinetic patterns of intercellular interactions, antigen dosage sets a functional threshold for successful T cell priming. Importantly, CD4+ and CD8+ T cells display disparate sensitivity to antigen exposure duration. CD4+ T cell priming requires continuous antigen stimulation, whereas CD8+ T cells can achieve autonomous activation after brief antigen exposure and sustain effector functions without persistent antigenic signals[10].
(3) DC Functional State and Maturation Status
DC maturation status is a decisive determinant of antigen-presenting capability. Immature DCs continuously sample peripheral antigens and sense microenvironmental signals, yet they exhibit limited T cell activation potential due to low surface abundance of MHC molecules and co-stimulatory ligands. After antigen acquisition, DCs undergo progressive maturation within 24 to 48 hours, which markedly improves their antigen presentation capacity. Type 1 conventional DCs (cDC1s) are a unique DC subset characterized by superior cross-presentation activity and primarily drive the priming and expansion of anti-tumor CTLs.
(4) Antigen Loading Strategies
Distinct antigen loading regimens directly affect DC antigen presentation efficiency and the intensity of downstream T cell immune responses. Co-culturing DCs with irradiated CD40 ligand (CD40L)-engineered tumor cells enables simultaneous delivery of tumor-associated antigens and DC maturation cues, which efficiently induces the activation of tumor-specific CD8+ T cells. Additionally, the accelerated co-cultured DC (acDC) strategy promotes synchronized T cell activation during DC maturation by maintaining stable physical contact between differentiating DCs and lymphocytes. Functional validation experiments have confirmed that the acDC protocol yields high-purity and high-functionality DCs. Approximately 40.4% of acDCs can effectively phagocytose apoptotic tumor cells to support robust antigen presentation[11].
(5) Co-Culture Microenvironmental Conditions
Multiple co-culture conditions including the DC-to-T cell ratio, incubation time, and cytokine microenvironment jointly shape the final T cell activation phenotype. For consistent and reproducible functional assays, naive CD4+ T cells are purified using a commercial CD4+ T cell isolation kit prior to co-culture establishment. A 6-day short-term co-culture system serves as the standard paradigm for evaluating the intrinsic priming capacity of DCs. In this culture setting, mature DCs efficiently capture and present soluble protein antigens to initiate robust T cell activation. The addition of Toll-like receptor (TLR) 7/8 agonists further potentiates DC-mediated cross-presentation and T cell cross-priming. Notably, combined stimulation with TLR7/8 agonists and CD40 signaling exerts synergistic adjuvant effects, thereby substantially amplifying anti-tumor immune responses[12].
3.2 Evaluation Indicators of Antigen Loading Efficiency
The functional efficacy of antigen loading can be comprehensively reflected by the magnitude and phenotypic profiles of T cell responses, which are quantified using multiple core evaluation indicators.
(1) T Cell Proliferation
T cell proliferation serves as the most direct readout for evaluating antigen presentation efficiency. Co-culture of antigen-loaded mature DCs with naive T lymphocytes triggers specific binding between T cell receptors (TCRs) and pMHC complexes together with auxiliary co-receptors. This interaction activates intracellular signaling cascades and initiates T cell clonal expansion. Antigen-primed DCs exhibit potent capability to promote robust CD4+ T cell proliferation.
(2) T Cell Activation Phenotype
Flow cytometry is widely utilized to detect the surface expression of T cell activation markers and assess T cell activation status. In terms of effector cytokine secretion, antigen-loaded DCs secrete IL-12 and other pro-inflammatory cytokines to instruct T cells to produce IFN-γ and IL-2. The enzyme-linked immunospot (ELISpot) assay is regarded as a gold-standard technique for quantifying antigen-specific IFN-γ secretion, offering high-precision evaluation of antigen presentation efficacy (which can also be detected using the IFN gamma ELISA kit).
(3) T Cell Cytotoxic Function
T cell cytotoxic activity is evaluated by measuring the specific lysis of target tumor cells after DC-T cell co-culture. In addition to functional cytotoxicity detection, real-time monitoring of intracellular transcription factor activity enables molecular-level assessment of antigen presentation signal strength, providing mechanistic evidence for DC-dependent T cell priming efficiency.
3.3 Optimization Strategies for Enhancing Antigen Loading Efficiency
Based on the above regulatory mechanisms, multiple targeted optimization strategies have been developed to improve the antigen loading efficiency of DC-T cell co-culture systems.
Nanoparticle-based antigen delivery platforms are among the most effective optimization strategies. Soluble free antigens often fail to induce sufficient DC maturation and cross-presentation, leading to weak and transient CD8+ T cell immune responses. In contrast, antigen immobilization on polymeric nanoparticles markedly enhances the clonal expansion and functional activation of antigen-specific CD8+ T cells. Nanoparticle physicochemical features including particle size, surface charge, material composition, and antigen loading mode collectively modulate immune response magnitude and polarization. Accumulating studies have verified that nanoparticle-enhanced CD8+ T cell immunity relies strictly on cDC1 subsets. Furthermore, nanoparticle-based antigen delivery significantly improves the in vivo therapeutic potency of tumor vaccines, suppresses tumor progression, and prolongs the survival of tumor-bearing model mice.
Genetic modification and synthetic engineering of DC vaccines represent another promising optimization direction. The combination of nanoscale antigen delivery and synthetic immunology technologies has enabled the construction of novel high-efficiency DC vaccine platforms. These platforms enhance MHC-I-restricted tumor antigen cross-presentation to elicit potent anti-tumor cellular immunity. Meanwhile, surface-anchored anti-CD3 antibodies strengthen DC-T cell contact and stabilize immune synapses, thereby improving the transduction efficiency of T cell activation signals.
Synchronous delivery of tumor antigens and DC maturation signals is also an efficient approach to enhance antigen loading efficacy. CD40L-modified tumor cells can concurrently provide tumor-associated antigens and co-stimulatory maturation signals to DCs. This synchronized treatment coordinates DC maturation and antigen presentation processes to achieve robust and sustained T cell activation.
In summary, antigen loading efficiency in DC-T cell co-culture systems is determined by the synergistic interplay of multiple factors, including antigen intrinsic characteristics, DC maturation and functional states, antigen loading strategies, and co-culture microenvironmental conditions. Advances in DC immunobiology research and interdisciplinary technologies such as nanotechnology and synthetic immunology have greatly promoted the technical optimization of DC antigen processing and presentation. Nevertheless, current DC vaccines still exhibit limited clinical response rates. Insufficient DC cross-presentation capacity and defective T cell activation signal transduction are the primary bottlenecks restricting clinical therapeutic efficacy. Future studies should further explore the molecular mechanisms underlying DC antigen processing and cross-presentation, develop high-precision and high-efficiency antigen delivery systems, and establish standardized evaluation criteria for antigen loading efficiency. These efforts will facilitate the clinical translation and widespread application of DC-T cell co-culture-based immunotherapies in tumor treatment and other immune-related disorders.
%20maturation_.png)
Fig. 3 Flow cytometric analysis of dendritic cell (DC) maturation. Bone marrow-derived DCs from C57BL/6 mice were exposed to maturation stimuli, which significantly increased the expression of MHC II, CD80, CD40 and CD86. (The data are provided by Elabscience.)
_.png)
Fig. 4 Interaction between T cells and bone marrow-derived dendritic cells (BMDCs). CD8+ T cells were isolated from the splenocytes of C57BL/6 mice using EasySort™ Mouse CD8+T Cell Isolation Kit (cat. no. MIM003N). The purity of the isolated CD8+ T cells was verified by flow cytometry. Following CFSE labeling, CD8+ T cells were co‑cultured with mature BMDCs for 72 h in vitro, and the proliferation of CD8+ T cells was subsequently assessed. (The data are provided by Elabscience.)
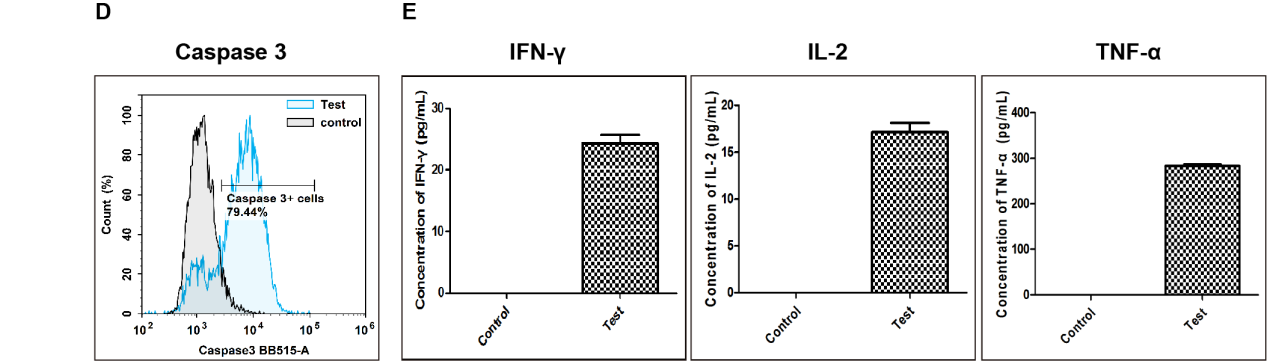
Fig. 5 Detection of apoptosis in target cells killed by CD8+ T cells. (D) After co‑culture of activated T cells with RAW264.7 target cells at a ratio of 1:10 for 24 h, caspase‑3 activity in target cells was measured by flow cytometry. Compared with the Control group (target cells cultured without activated T cells), the proportion of RAW264.7 cells with activated caspase‑3 increased to 79.44% in the co‑culture group (Test). (E) Cytokine levels in cell culture supernatants were measured by ELISA. Compared with the Control group, the levels of IFN‑γ, IL‑2, and TNF‑α were markedly increased in the co‑culture group (Test). (The data are provided by Elabscience.)
Elabscience® Quick Overview of Popular Products:
Table 4. Reagents for DC-T cell co-culture
|
Product Name |
Cat. No. |
|
EasySort™ Mouse CD8+T Cell Isolation Kit |
MIM003N |
|
EasySort™ Mouse CD3+T Cell Isolation Kit |
MIM001N |
|
EasySort™ Mouse CD4+T Cell Isolation Kit |
MIM002N |
|
EasySort™ Human CD3+T Cell Isolation Kit |
MIH001N |
|
EasySort™ Human CD4+ T Cell Isolation Kit |
MIH002N |
|
EasySort™ Human CD8+ T Cell Isolation Kit |
MIH003N |
|
EasySort™ Human Naïve Pan T Cell Isolation Kit |
MIH006N |
|
EasySort™ Human Naïve CD4+T Cell Isolation Kit |
MIH007N |
|
EasySort™ Human Naïve CD8+T Cell Isolation Kit |
MIH008N |
|
EasySort™ Mouse Pan-Naïve T Cell Isolation Kit |
MIM006N |
|
EasySort™ Mouse Naïve CD4+T Cell Isolation Kit |
MIM007N |
|
EasySort™ Mouse Naïve CD8+T Cell Isolation Kit |
MIM008N |
|
EasySort™-5 Magnet |
EC001 |
|
Mouse Bone Marrow-derived Dendritic Cells (BMDC) Induction and Identification Kit |
XJM003 |
|
FITC Anti-Mouse CD3 Antibody[17A2] |
E-AB-F1013C |
|
Elab Fluor® Violet 450 Anti-Mouse CD8a Antibody[53-6.7] |
E-AB-F1104Q |
|
Caspase 3/7 Activity Detection Substrate for Flow Cytometry |
E-CK-A483 |
|
Caspase 3/7 and Annexin V Double Staining Apoptosis Kit |
E-CK-A831 |
|
Caspase 1 Activity Detection Substrate for Flow Cytometry |
E-CK-A481 |
|
Reactive Oxygen Species (ROS) Fluorometric Assay Kit (Red) |
E-BC-F005 |
|
Lactate Dehydrogenase (LDH) Cytotoxicity Colorimetric Assay Kit |
E-BC-K771-M |
|
CellaQuant™ Mouse TNF-α (Tumor Necrosis Factor Alpha) ELISA Kit |
CQM002 |
|
CellaQuant™ Mouse IL-2 (Interleukin 2) ELISA Kit |
CQM006 |
|
CellaQuant™ Mouse IFN-γ (Interferon Gamma) ELISA Kit |
CQM005 |
04 Cross-presentation capacity of dendritic cells in CD8+ and CD4+ T cell activation systems
As primary antigen-presenting cells, dendritic cells control adaptive immunity. Unlike conventional antigen presentation, DCs can cross-present exogenous antigens on MHC-I to activate CD8+ cytotoxic T cells. This mechanism enables DCs to mount protective CD8+ T cell responses against viruses and tumor cells that cannot be directly recognized or infected by DCs[13].
4.1 DC Subpopulations Mediating Cross-Presentation
(1) Type 1 Conventional Dendritic Cells (cDC1): cDC1s are the dominant DC subset with potent cross-presentation capacity and are essential for CD8+ T cell-dependent antitumor immunity. After capturing peripheral antigens, cDC1s migrate to draining lymph nodes to cross-present tumor antigens to naive CD8+ T cells. Their cross-presentation activity is non-constitutive and strictly dependent on external activating cues, including inflammatory signals and damage-associated molecular patterns. Recent studies have identified Ms4a7 as a key regulator of cDC1 cross-presentation competence and antitumor immune function.
(2) Type 2 Conventional Dendritic Cells (cDC2): cDC2s are conventionally responsible for CD4⁺ T cell activation and humoral immunity. Nevertheless, accumulating evidence confirms that cDC2s also possess intrinsic cross-presentation ability. Pulmonary cDC2s alone can trigger naive CD8+ T cell cross-activation, and both cDC1s and cDC2s efficiently cross-present immune complex-coupled antigens. Consistent with this functional redundancy, mRNA-LNP vaccine-induced CD8+ T cell activation is not limited to cDC1s, as both subsets share a WDFY4-dependent cross-presentation pathway to mediate this response.
(3) Plasmacytoid Dendritic Cells (pDCs): pDCs are best known for robust type I interferon secretion during antiviral responses. Beyond this canonical function, pDCs exhibit potent antigen cross-presentation capacity. Co-culture assays using CD34+ hematopoietic stem and progenitor cell-derived autologous pDCs and CD8+ T cells verify that pDCs efficiently drive CD8+ T cell expansion and cytotoxic differentiation via cross-presentation. pDCs show antigen-presenting efficacy comparable to monocyte-derived DCs (moDCs) and myeloid DCs (mDCs). Transcriptomic analysis further reveals that pDC-primed CD8+ T cells have distinct transcriptional signatures from moDC-primed cells, indicating divergent T cell activation mechanisms induced by different DC subsets.
4.2 Molecular Mechanisms of Cross-Presentation
DC cross-presentation relies on two evolutionarily conserved intracellular pathways. The cytoplasmic pathway transports exogenous antigens from endosomes or phagosomes into the cytosol for proteasomal degradation; resultant peptides are translocated to the endoplasmic reticulum via TAP transporters for MHC class I loading. The vesicular pathway enables intravesicular antigen degradation and peptide-MHC class I assembly without cytosolic antigen translocation. Both pathways are modulated by antigen uptake patterns, endosomal acidification, and protease activity. Mechanistically, Perforin-2 enhances DC macropinocytosis for efficient antigen acquisition and restricts excessive endosomal acidification to prevent premature antigen degradation, coordinating antigen processing to support robust cross-presentation.
4.3 Regulatory Role of Cross-Presentation in CD8⁺ T Cell Activation
Cross-presentation delivers exogenous antigens to CD8⁺ T cells via MHC class I molecules, triggering TCR-dependent CTL proliferation, differentiation, and cytotoxic function acquisition. Optimal CD8+ T cell activation requires not only antigen-MHC I ligation but also CD4+ T cell-mediated DC licensing. CD4+ T cell-derived CD40L-CD40 signaling and IFN-γ secretion promote cDC1 maturation and potentiate cross-presentation, inducing chemokine expression to recruit naive CTLs for full cross-activation. Conversely, tumor microenvironment inhibitory mediators including TGF-β, IDO1, IL-6, and VEGF impair cDC1 function and disrupt cross-presentation, driving tumor immune evasion. Defective cDC1-mediated cross-presentation is a major cause of insufficient tumor-specific CTL responses in triple-negative breast cancer.
4.4 Crosstalk Between Cross-Presentation and CD4⁺ T Cell Activation
While cross-presentation primarily initiates CD8+ T cell immunity, CD4+ T cells provide essential licensing signals for DCs through CD40L-CD40 interactions and secretion of IFN-γ and TNF. These signals enhance cDC1 maturation and cross-presentation efficiency, promoting the accumulation and functional activation of tumor-infiltrating CD8+ T cells, while also facilitating moDC differentiation and amplifying Th1 and CTL effector responses. Additionally, DC-derived exosomes mediate intercellular antigen transfer, enabling antigen-inexperienced DCs to acquire cross-presentation capacity and expand the functional synergy of the DC network.
4.5 Key Factors and Targeted Strategies for Modulating Cross-Presentation Efficiency
Tumor microenvironment hypoxia triggers pathological mitochondrial fission, endoplasmic reticulum stress, and aberrant lipid droplet accumulation in DCs. Combined with CDC37-mediated inhibition of cDC1 cross-presentation, these pathological changes collectively impair DC antigen presentation efficacy. Multiple engineering strategies have been developed to overcome these immunosuppressive barriers and enhance cross-presentation efficiency. First, targeted antigen delivery to DC surface receptors (e.g., DEC205, DNGR-1/CLEC9A) optimizes antigen internalization, with DNGR-1 specifically facilitating cross-presentation of dying cell-associated antigens. Second, YTHDF1-targeting nanovaccines reduce lysosomal protease activity to attenuate antigen degradation, doubling cross-presentation efficiency. Furthermore, combinatorial treatment with TLR or STING agonists promotes DC maturation and further potentiates T cell activation.
In summary, DC cross-presentation bridges innate and adaptive immunity and serves as a core regulator of CD8+ CTL-mediated antiviral and antitumor responses. As the primary mediators of cross-presentation, cDC1 functions are tightly modulated by inflammatory and microenvironmental cues. cDC2s and pDCs also mediate cross-presentation under specific physiological and pathological conditions, endowing the DC network with functional redundancy. In this immune axis, CD4+ T cell-derived licensing signals potentiate DC cross-presentation capacity, forming a synergistic feedback loop that coordinates CD4+ and CD8+ T cell activation.
%20in%20bone%20marrow%20cells%20from%20C57BL%206%20mice_.png)
Fig. 6 Three-color flow cytometric detection of myeloid-derived suppressor cells (MDSCs) in bone marrow cells from C57BL/6 mice. Bone marrow cells from C57BL/6 mice were immunostained with PE-labeled anti-mouse CD11b, FITC-labeled anti-mouse Ly6G, and APC-labeled anti-mouse Ly6C antibodies. Granulocytic MDSCs (G-MDSCs) were identified as CD11b+Ly-6ClowLy-6G+, while monocytic MDSCs (M-MDSCs) were defined as CD11b+Ly-6ChighLy-6G-. (The data are provided by Elabscience.)
Table 5. Experimental reagents for myeloid-derived suppressor cell (MDSC) research
|
Product Name |
Cat. No. |
|
PE Anti-Mouse/Human/Monkey CD11b Antibody[M1/70] |
E-AB-F1081D |
|
FITC Anti-Mouse Ly6G Antibody[1A8] |
E-AB-F1108C |
|
APC Anti-Mouse Ly6C Antibody[Monts 1] |
E-AB-F1121E |
|
PE Rat IgG2b, κ Isotype Control[LTF-2] |
E-AB-F09842D |
|
FITC Rat IgG2a, κ Isotype Control[2A3] |
E-AB-F09832C |
|
APC Rat IgG2a, κ Isotype Control[2A3] |
E-AB-F09832E |
|
10×ACK Lysis Buffer |
E-CK-A105 |
|
10× RBC Lysis/Fixation Solution |
E-CK-A106 |
05 Time-course dynamics of T cell activation markers (CD69, CD25) after DC stimulation
Following DC-mediated antigenic stimulation, T cell activation markers CD69 and CD25 exhibit distinct sequential temporal kinetics. CD69 is rapidly upregulated upon initial TCR triggering as an early activation biomarker, whereas CD25 functions as a mid-to-late activation marker with delayed peak expression.
5.1 Temporal Dynamics of CD69 and CD25
(1) CD69 (Early Activation Marker): CD69 is one of the most rapidly induced surface antigens during T cell activation, which can be detected using the CD69 antibody. Its expression is detectable as early as 1-3 h following the engagement of naïve T cells with antigen-presenting DCs, with stable, reproducible upregulation observed at 4-6 h post-stimulation. Consistent with previous studies, robust CD69 induction has also been validated at 3 h, 6 h, and 16 h in DC-T cell co-culture systems.
(2) CD25 (Mid-to-Late Activation Marker): CD25, the α subunit of the IL-2 receptor (IL-2Rα), exhibits markedly delayed induction kinetics compared with CD69, which can be detected using the CD25 antibody. As a well-characterized mid-to-late T cell activation marker, CD25 expression typically peaks at 24-48 h, with moderate expression detectable at 6 h, 12 h, and 24 h post-stimulation. Accordingly, combined detection of these two markers at 24 h and 48 h is widely used to comprehensively evaluate T cell activation status.
5.2 Key Regulators Governing Activation Kinetics
(1) Sustained Costimulatory Signaling: Full naïve T cell activation and robust CD69/CD25 induction rely on synergistic TCR signaling and sustained CD80/CD86-mediated costimulation. Specifically, stable DC-T cell conjugation lasting over 6 h is essential for sufficient signal integration and successful T cell priming.
(2) Antigen Properties and Dosage: The magnitude and temporal pattern of T cell activation are directly modulated by antigen type, dosage, and presentation modality. Unlike the rapid CD69 kinetics during primary T cell activation, recall antigen-induced CD69 upregulation is optimally detected at 24-48 h post-stimulation.
(3) DC Subsets and Immune Microenvironment: Phenotypically distinct DC subsets, including CD8α+ lymphoid-type DCs and CD8α- myeloid-type DCs, vary significantly in their capacity to initiate and sustain T cell CD69 and CD25 expression (which can be detected using the CD69 antibody and CD25 antibody). Furthermore, DC-NK cell crosstalk in the immune microenvironment increases the proportion of CD69+ and CD25+ activated T cells.
(4) Quantitative Assessment Strategy: For accurate CD69 quantification, mean fluorescence intensity (MFI) is superior to the simple detection of marker-positive cell frequency. As MFI reflects single-cell-level antigen expression, it provides higher sensitivity to assess the magnitude of early T cell activation.
Collectively, CD69 and CD25 exhibit strictly ordered temporal expression patterns during DC-driven T cell activation. CD69 serves as a sensitive early sensor of TCR activation, whereas CD25 peaking at 24-48 h marks T cell transition into proliferation and functional differentiation. This sequential molecular cascade underpins complete T cell activation and subsequent adaptive immune responses.
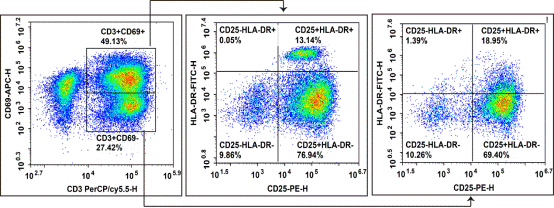
Fig. 7 Analysis of T cell activation. Peripheral blood samples were separated into PBMC cells using Human PBMC Separation Solution(P 1.077). Subsequently, PBMC cells were stimulated Human CD3/CD28 T Cell Activation Beads for 48 hours, and then The activation profiles of T lymphocytes were determined using the antibody panel: PerCP/Cy5.5 anti-human CD3, APC anti-human CD69, PE anti-human CD25, FITC anti-human HLA-DR. (The data are provided by Elabscience.)
Table 6. Experimental reagents for T cell activation analysis
|
Product Name |
Cat. No. |
|
Human PBMC Separation Solution(P 1.077) |
E-CK-A103 |
|
PerCP/Cyanine5.5 Anti-Human CD3 Antibody[UCHT1] |
E-AB-F1230J |
|
APC Anti-Human CD69 Antibody[FN50] |
E-AB-F1138E |
|
PE Anti-Human CD25 Antibody[BC96] |
E-AB-F1194D |
|
FITC Anti-Human/Monkey HLA-DR Antibody[L243] |
E-AB-F1111C |
|
Mouse CD3/CD28 T Cell Activation Beads |
MIM001A |
|
Human CD3/CD28 T Cell Activation Beads |
MIH001A |
|
10×ACK Lysis Buffer |
E-CK-A105 |
|
10× RBC Lysis/Fixation Solution |
E-CK-A106 |
06 Flow cytometry-based intracellular IFN-γ detection in activated CD4+ T cells
IFN‑γ is rapidly secreted after synthesis. Accordingly, intracellular cytokine detection requires Golgi trafficking inhibitors (Brefeldin A or Monensin) during the final hours of T cell activation. The primary readout is the percentage of IFN‑γ⁺ cells within viable CD4⁺ T cells. Additional readouts include single-cell median fluorescence intensity (MFI) and cellular polyfunctionality when multiple cytokines are co-detected.
This multiparameter flow cytometry assay quantifies intracellular IFN‑γ in activated CD4⁺ T cells. It relies on two core steps: blockade of protein secretion and cell permeabilization for intracellular antibody labeling. The detailed procedures are described below.
6.1 Key Experimental Procedures
(1) Cell stimulation and protein transport blockade: Cells are stimulated with PMA plus ionomycin to activate DAG and calcium signaling, with Brefeldin A (BFA) or Monensin added simultaneously. The incubation lasts 4-6 h; prolonged culture causes apoptosis and downregulation of surface phenotypic markers.
(2) Surface marker staining: Live-cell staining for CD3 and CD4 is performed first. Notably, PMA induces prominent CD4 internalization and may lead to gating errors. To avoid false-negative results, three alternative approaches are available: use antibodies targeting intracellular CD4, re-stain CD4 after fixation and permeabilization, or identify CD4⁺ T cells via the CD3⁺CD8⁻ gating strategy.
(3) Fixation and permeabilization: Cells are fixed with formaldehyde-based fixatives and then treated with permeabilization buffer to allow cytoplasmic entry of anti-cytokine antibodies.
(4) Intracellular cytokine staining: Fluorophore-conjugated anti-IFN‑γ antibodies are incubated with cells in darkness. The recommended clones are XMG1.2 for mouse samples, and 4S.B3 or B27 for human samples. After washing, samples are acquired on a flow cytometer.
6.2 Critical Reagents and Experimental Precautions
(1) Stimulation cocktail: PMA (50 ng/mL) combined with ionomycin (500 ng/mL) serves as a potent non-specific stimulant. For antigen-specific stimulation with peptide pools, culture time should be extended to 12-16 h, with continuous supplementation of BFA or Monensin throughout incubation.
(2) Selection of protein transport inhibitors: Brefeldin A blocks Golgi-to-membrane protein trafficking, whereas Monensin inhibits lysosomal transport. These two inhibitors can be used individually or in combination to maximize intracellular cytokine accumulation.
(3) Gating strategy: The sequential gating sequence is as follows: lymphocytes (FSC‑A vs. SSC‑A) → cellular debris exclusion → viable cells → CD3⁺ T cells → CD4⁺ subsets → quantification of IFN‑γ+ frequency.
(4) Control setup: Unstimulated controls define baseline background. More importantly, fluorescence minus one (FMO) controls are required to precisely demarcate positive and negative populations.
6.3 Troubleshooting of Common Technical Artifacts
(1) CD4 downregulation: Strong stimulation triggers CD4 endocytosis and surface loss, which causes false-negative gating. Remedies include staining intracellular CD4, shortening stimulation duration, or pre-blocking CD4 epitopes before surface staining.
(2) Elevated autofluorescence: T cell activation increases cellular autofluorescence. Isotype controls should be included, and PMT voltages need careful optimization to reduce non-specific background.
In conclusion, this protocol enables functional analysis of CD4⁺ T cells from human and murine peripheral blood and solid tissues, and stands as the gold-standard assay for evaluating Th1 immune responses.
_.png)
Fig. 8 Analysis of IFN-γ and IL-4 production in human peripheral blood mononuclear cells (PBMCs). Peripheral blood mononuclear cells (PBMCs) were treated with Cell Stimulation MIX and Protein Transport Inhibitor MIX for 5 hours, then were harvested, fixed, and permeabilized, followed by staining with PerCP/Cyanine5.5 Anti-Human CD3, Elab Fluor® 488 Anti-Human CD4, PE Anti-Human IL-4 and APC Anti-Human IFN-γ for analysis of the proportion of Th1/Th2 cells and their functional capacity to secrete the effector cytokine IFN-γ or IL-4. Th1 cells were defined by the phenotype CD3+CD4+IFN-γ+, Th2 cells were defined by the phenotype CD3+CD4+IL-4+. (The data are provided by Elabscience.)
Elabscience® Quick Overview of Popular Products:
Table 7. Reagents for T Cell cytokine secretion assays
|
Product Name |
Cat. No. |
|
Mouse Th17 Flow Cytometry Staining Kit |
XJM002 |
|
Mouse Th1/Th2 Flow Cytometry Staining Kit |
XJM001 |
|
Human Th1/Th2 Flow Cytometry Staining Kit |
XJH001 |
|
Human Th17 Flow Cytometry Staining Kit |
XJH002 |
|
Cell Staining Buffer |
E-CK-A107 |
|
Cell Stimulation and Protein Transport Inhibitor Kit |
E-CK-A091 |
|
Intracellular Fixation/Permeabilization Buffer Kit |
E-CK-A109 |
07 Optimal co-culture duration of LPS-treated DCs and CD4⁺ T cells for IFN-γ intracellular staining
For intracellular IFN‑γ staining of CD4⁺ T cells after co‑culture with LPS‑matured dendritic cells (DCs), the 16-24 h incubation period is the most widely adopted window. Specifically, Brefeldin A (Golgi Block) is supplemented during the final 4-6 h before cell harvesting and fixation. This part clarifies the mechanistic basis for this timeline, alternative culture schemes for distinct research goals, and key experimental variables that shift the optimal incubation length.
Standard Protocol
For direct intracellular cytokine staining (ICS) without secondary re‑stimulation, LPS‑matured DCs and CD4⁺ T cells are co‑cultured at a 1:10 ratio for 16-24 h, with Brefeldin A added in the last 4-6 h. This window balances two kinetic requirements. DCs require several hours to upregulate co‑stimulatory molecules and secrete IL‑12, whereas naïve T cells need 12-18 h after TCR ligation to accumulate IFN‑γ above the flow cytometric detection limit. Cultures shorter than 12 h produce weak signals. In contrast, incubation longer than 24-30 h increases apoptosis and triggers negative cytokine feedback that suppresses T cell responses.
The 16-24 h timeframe is jointly determined by both cell populations. LPS‑matured DCs upregulate CD80/CD86 and MHC class II and secrete bioactive IL‑12p70 over several hours, which initiates T cell IFN‑γ transcription. Naïve or quiescent CD4⁺ T cells then spend 12-18 h completing gene transcription, protein translation and intracellular cytokine accumulation. Short incubation leads to insufficient signal intensity, while prolonged culture introduces confounders including cell death, autocrine IFN‑γ self‑inhibition, and high background from necrotic cells. Taken together, the 16-24 h interval optimizes signal strength and experimental reproducibility.
Alternative Protocol for Th1 Polarization (CD3/CD28 T cell activation)
To measure long‑term Th1 lineage commitment rather than acute early activation, extend the DC‑T cell co‑culture to 5-7 days. Cells are then re‑stimulated with PMA plus ionomycin or plate‑bound anti‑CD3/CD28 for 4-6 h, and Brefeldin A is maintained during the final 4 h of re‑stimulation. This standard polarization assay detects stably differentiated Th1 effectors, rather than the transient cytokine burst observed within the first 24 h of cell contact.
Key Variables Modulating Incubation Timing
Optimal culture duration depends strongly on experimental conditions. First, costimulation with LPS plus IFN‑γ or higher LPS doses accelerates DC IL‑12 secretion and shortens incubation to 12-16 h; weakly matured DCs still require the full 24 h. Second, memory and effector T cells produce cytokines within 6-12 h, much faster than naïve T cells. Murine assays routinely use the 5-7 day polarization protocol, whereas human allogeneic mixed lymphocyte reactions (MLRs) rely mostly on 16-24 h short‑term co‑culture. Lower DC:T cell ratios also demand longer incubation to build up measurable intracellular IFN‑γ.
Practical Optimization Strategies
To reduce background signals, rest purified T cells in cytokine‑free medium for 6-18 h before co‑culture. Use Brefeldin A at 10 µg/mL, and keep the final DMSO concentration below 0.5%. Viability dyes are required to exclude false positives caused by cytokine leakage from necrotic cells. Essential controls include T cell monocultures, DC monocultures, and PMA/ionomycin‑treated positive samples. Owing to batch‑to‑batch variation in DC quality and inter‑donor heterogeneity of primary T cells, perform a pilot time‑course (12 h, 18 h, 24 h) to locate the peak IFN‑γ response in each independent experiment.
In summary, 16-24 h co‑culture plus 4-6 h Brefeldin A treatment is suitable for acute DC‑induced T cell activation, including allogeneic MLRs and antigen‑specific priming. For Th1 polarization studies, use 5-7 day primary culture followed by 4-6 h PMA/ionomycin re‑stimulation with Brefeldin A added in the last 4 h. In all cases, run a small pilot time‑course for each new DC batch and T cell source, since differences in LPS bioactivity and donor background can shift the peak response by several hours.
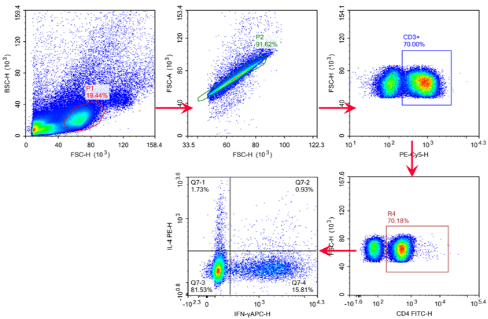
Fig. 9 Analysis of IFN-γ and IL-4 production in C57BL/6 mouse splenocytes. Splenocytes were treated with Cell Stimulation MIX and Protein Transport Inhibitor MIX for 5 hours, then were harvested, fixed, and permeabilized, followed by staining with PE/Cyanine5 Anti-Mouse CD3, FITC Anti-Mouse CD4, PE Anti-Mouse IL-4 and APC Anti-Mouse IFN-γ for analysis of the proportion of Th1/Th2 cells and their functional capacity to secrete the effector cytokine IFN-γ or IL-4. Th1 cells were defined by the phenotype CD3+CD4+IFN-γ+, Th2 cells were defined by the phenotype CD3+CD4+IL-4+. (The data are provided by Elabscience.)
References:
[1] Wantong,Wu,Weiqiang,et al.IL-37b suppresses T cell priming by modulating dendritic cell maturation and cytokine production via dampening ERK/NF-κB/S6K signalings[J].Acta Biochimica Et Biophysica Sinica, 2015.
[2] Carabelli J , Quattrocchi V , D'Antuono A ,et al.Galectin-8 activates dendritic cells and stimulates antigen-specific immune response elicitation[J].Journal of Leukocyte Biology, 2017, 102(5):jlb.3A0816-357RR.
[3] Bourque J H D .Immunomodulatory Bonds of the Partnership between Dendritic Cells and T Cells[J].Critical reviews in immunology, 2018, 38(5).
[4] Ayako W , Masumi S , Eiji S ,et al.HMGB1 released from intestinal epithelia damaged by cholera toxin adjuvant contributes to activation of mucosal dendritic cells and induction of intestinal cytotoxic T lymphocytes and IgA.[J].Cell Death & Disease, 2018, 9(6):631-.
[5] Feili-Hariri M , Morel P A .Phenotypic and Functional Characteristics of BM-Derived DC from NOD and Non-Diabetes-Prone Strains[J].Clinical Immunology, 2001, 98(1):133-142.
[6] Tang,L,l,et al.Phenotypic and functional characteristics of dendritic cells derived from human peripheral blood monocytes[J].Journal Zhejiang University Science B, 2005.
[7] Ahonen C L, Gibson S J, Smith R M, et al. Dendritic cell maturation and subsequent enhanced T-cell stimulation induced with the novel synthetic immune response modifier R-848[J]. Cellular immunology, 1999, 197(1): 62-72.
[8] Pletinckx K, Döhler A, Pavlovic V, et al. Role of dendritic cell maturity/costimulation for generation, homeostasis, and suppressive activity of regulatory T cells[J]. Frontiers in immunology, 2011, 2: 39.
[9] Bonehill A, Van Nuffel A M T, Corthals J, et al. Single-step antigen loading and activation of dendritic cells by mRNA electroporation for the purpose of therapeutic vaccination in melanoma patients[J]. Clinical Cancer Research, 2009, 15(10): 3366-3375.
[10] Ochyl L J, Moon J J. Dendritic cell membrane vesicles for activation and maintenance of antigen‐specific T cells[J]. Advanced healthcare materials, 2019, 8(4): 1801091.
[11] Paßlick D, Piradashvili K, Bamberger D, et al. Delivering all in one: Antigen-nanocapsule loaded with dual adjuvant yields superadditive effects by DC-directed T cell stimulation[J]. Journal of controlled release, 2018, 289: 23-34.
[12] Märten A, Greten T, Ziske C, et al. Generation of activated and antigen-specific T cells with cytotoxic activity after co-culture with dendritic cells[J]. Cancer Immunology, Immunotherapy, 2002, 51(1): 25-32.
[13] Jo S, Li L, Thakur C, et al. mRNA vaccines engage unconventional pathways in CD8+ T cell priming[J]. Nature, 2026: 1-10.

