

Precise identification of B cell subsets is critical for understanding immune responses and disease mechanisms. This review systematically outlines flow cytometry–based strategies for B cell phenotyping. First, we summarize classical surface marker combinations for identifying naïve, memory, and plasma B cells, and discuss key markers for distinguishing transitional B cells from mature B cells. Second, we focus on the variable marker profiles of regulatory B cells (Bregs) and their functional validation approaches, and recommend multiparameter flow cytometry panel designs suitable for comprehensive subset analysis. Furthermore, we emphasize the complementary value of functional biomarkers such as CD69 and CD86 in reflecting B cell activation status. Finally, we discuss strategies that integrate multi‑omics and protein‑level assays for cross‑validation of subsets, aiming to provide a systematic technical reference for B cell immune monitoring.
Table of Contents
1. Surface Marker Combinations for Naïve, Memory, and Plasma B Cell Identification
2. How to Distinguish Transitional B Cells from Mature B Cells
3. Regulatory B Cell (Breg) Markers and Functional Validation
4. Multiparameter Flow Cytometry Panels for Comprehensive B Cell Subset Analysis
5. Functional Biomarkers Beyond Surface Markers for B Cell Activation
6. Validating B Cell Subsets Using Multi-Omics and Protein-Level Assays
01 Surface Marker Combinations for Naïve, Memory, and Plasma B Cell Identification
The basic classification of human peripheral blood B cells relies primarily on combinations of markers such as CD19, CD20, IgD, CD27, CD38, and CD24. CD19 is the most reliable lineage‑specific marker for B cells, being expressed from early developmental stages throughout all B‑cell subsets except long‑lived plasma cells. Anti-CD20 Antibody is also widely used as a B‑cell lineage marker; however, its expression is downregulated during plasmablast differentiation, so that most antibody‑secreting cells are CD20⁻ but still retain CD19 expression[1]. CD27 is the most classic marker for distinguishing naïve B cells from memory B cells, with naïve B cells being CD27⁻ and memory B cells being CD27⁺.
Based on this framework, naïve B cells are typically defined as CD19⁺CD27⁻IgD⁺. They express high levels of IgD and IgM and primarily function to circulate between the blood and secondary lymphoid organs, searching for their specific antigens. Memory B cells can be further subdivided based on IgD and IgM expression into unswitched memory B cells (CD27⁺IgD⁺ and/or IgM⁺) and class‑switched memory B cells (CD27⁺IgG⁺ or IgA⁺). Anti-CD27 Antibody is currently the most widely used marker for memory B cells, but its expression is not absolute; some IgG⁺ memory B cells can be CD27⁻, with an increasing trend particularly in autoimmune diseases and elderly populations. Plasma B cells (plasmablasts/plasma cells) have a typical immunophenotype of CD19⁺CD20⁻CD27⁺CD38⁺⁺. CD20 is lost at the plasma cell stage, while CD38 expression is significantly upregulated, becoming a key marker for identifying plasma cells.
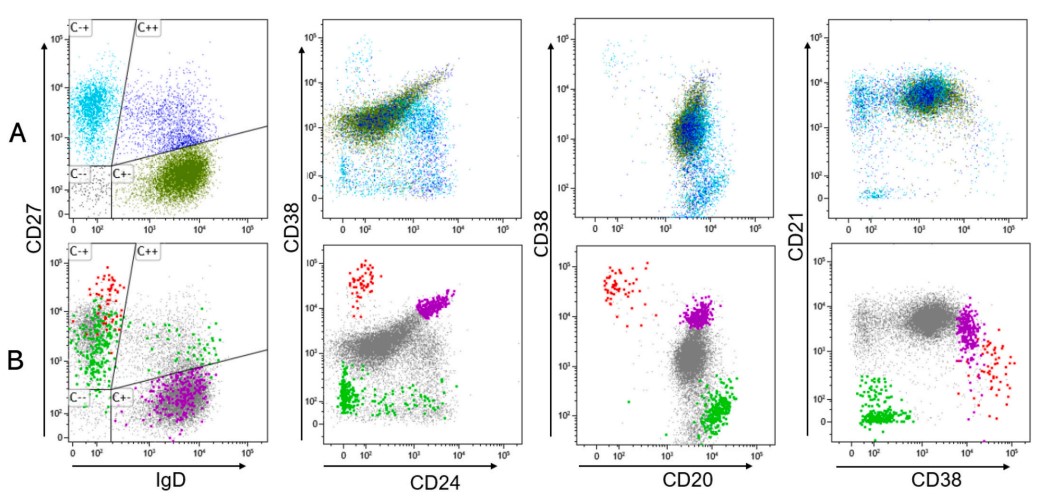
Fig. 1 B-cell subset analysis was performed using a 7-color antibody combination[1]. B cells were gated as CD45⁺SSClowCD19⁺ single cells. Four subsets were defined: naïve (CD27⁻IgD⁺), memory (CD27⁺IgD⁻), marginal zone/unswitched memory (CD27⁺IgD⁺), and double‑negative (IgD⁻CD27⁻). These subsets were overlaid on CD24/CD38, CD20/CD38, and CD38/CD21 scatter plots with consistent colors, revealing marker overlap and nonspecificity when used alone. In panel B, the same plots highlight minor subsets (transitional, antibody‑secreting, and CD21low cells) as large dots for rare‑event visualization.
02 How to Distinguish Transitional B Cells from Mature B Cells
Transitional B cells represent a critical stage in the transition from immature bone marrow B cells to mature naïve B cells in the periphery, and serve as an important checkpoint for the deletion or anergy of autoreactive B cells. In clinical practice, transitional B cells are typically identified by high expression of CD24 and CD38 (CD24hiCD38hi) or by expression of CD10. Transitional B cells account for approximately 1%–2% of CD19⁺ B cells in peripheral blood[1].
CD93 is the most important distinguishing marker for mouse transitional B cells: CD93⁺ cells are transitional B cells, while CD93⁻ cells are naïve mature B cells. In mouse spleen, the CD93⁺ population can be further subdivided into T1 and T2 subsets based on CD23 and CD21 expression. In humans, based on the expression of CD21, CD24, and CD38, transitional B cells can be further divided into three consecutive subsets: T1, T2, and T3. T1 cells (the most immature) express high levels of CD38 and CD24 and low levels of CD21; T2 cells show increased CD21 expression; and T3 cells have a phenotype closer to mature naïve B cells, but can be distinguished from true naïve B cells by Rhodamine 123 efflux assay[1].
Based on multiple literature sources[1-3], recommended core strategies for discrimination include: (1) initial screening for transitional B cells using high co‑expression of CD24 and CD38 (CD24hiCD38hi); (2) further confirmation by CD10 expression, as transitional B cells are CD10⁺ while mature B cells are CD10⁻; (3) additional distinction based on IgM and IgD expression levels, as transitional B cells have relatively high expression of both; and (4) application of Rhodamine 123 or MitoTracker efflux assays, because transitional B cells lack ABCB1 transporters and thus retain the dye, whereas mature naïve B cells can efflux it effectively[4].
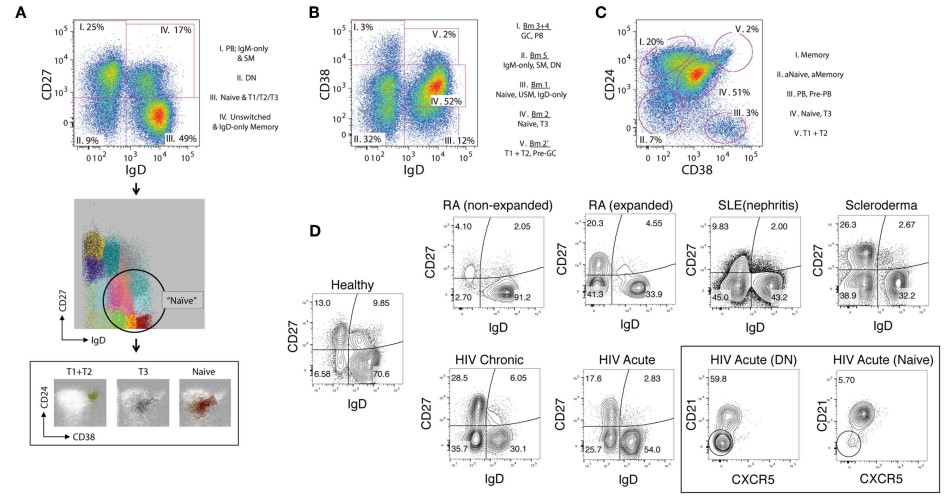
Fig. 2 B cell gating strategy[3]. A. In healthy donors, CD27/IgD gating on CD19⁺ cells defines four subsets: switched-memory (SM) with plasmablasts, CD27⁻IgD⁻ double-negative (DN), total naïve (including transitional 1–3 via FLOCK), and unswitched/IgD-only memory. B. The Bm1–Bm5 strategy yields five subsets but poorly resolves memory vs. effector and naïve vs. memory. C. CD24/CD38 gating defines five subsets, offering good resolution between memory and naïve (except subset II, which mixes activated memory and naïve) and between naïve and transitional; combining CD27/IgD with subsequent CD24/CD38 within the naïve gate improves resolution. Transitional 3 (T3) cells, however, require MitoTracker Green. D. Representative FACS plots show DN cells in RA, SLE, scleroderma, and acute/chronic HIV; DN cells can be further defined by markers such as CXCR5.
03 Regulatory B Cell (Breg) Markers and Functional Validation
Bregs are a subset of B cells with immunosuppressive functions, which regulate immune responses through the production of anti‑inflammatory cytokines such as IL‑10, IL‑35, and TGF‑β, as well as the expression of surface molecules including PD‑L1, CD1d, and TIM‑1. Breg cells play important roles in various pathological processes, including autoimmune diseases, allergies, infections, tumors, and transplant rejection[5,6]. However, there is currently no single surface marker that can uniquely identify Breg cells; their identification still relies primarily on functional characteristics[3,5].
3.1 Known subsets and markers of human Breg cells
Jansen et al.[5] systematically summarized the distinct subsets and phenotypic characteristics of human Breg cells: (1) B10 cells: CD24hiCD27⁺, which inhibit monocyte TNF‑α production via IL‑10; (2) Transitional Breg: CD19⁺CD24hiCD38hi, which suppress Th1 and Th17 differentiation and induce Treg cells through IL‑10, CD80, and CD86; (3) Br1 cells: CD19⁺CD25hiCD71hiCD73⁻, which produce large amounts of IL‑10 and induce IgG4 production, playing a critical role in allergen‑specific immune tolerance; (4) GrB⁺ B cells: CD19⁺CD38⁺CD1d⁺IgM⁺CD147⁺, which mediate immunosuppression via granzyme B; (5) CD9⁺ B cells: which inhibit Th2 and Th17 inflammation through IL‑10; (6) Plasmablasts/plasma cells: CD27intCD38hi or CD138⁺, which exert regulatory functions through IL‑10 and IL‑35. Catalan et al.[6] pointed out that the mechanisms of Breg suppressive function also include the conversion of pro‑inflammatory ATP into anti‑inflammatory adenosine via CD39/CD73, as well as inhibition of follicular helper T (Tfh) cell responses through the PD‑L1/PD‑1 pathway.
3.2 The functional verification method of Breg
Given the lack of specific surface markers, accurate identification of Bregs must rely on functional validation. Currently recommended methods include: (1) detection of IL‑10 and IL‑35 production by intracellular cytokine staining after short‑term in vitro stimulation, typically using PMA + ionomycin, CpG, CD40L, or LPS, such as IL-10 elisa and IL-35 elisa; (2) functional suppression assays, in which candidate Breg cells are co‑cultured with effector T cells to assess their capacity to inhibit T‑cell proliferation and cytokine production; and (3) ELISpot to determine the frequency of IL‑10‑secreting cells[5,7]. Dasgupta et al.[7] emphasized that although different Breg subsets have distinct surface marker combinations, Breg function can be present at multiple B‑cell differentiation stages (from transitional B cells to plasma cells), and IL‑10‑producing capacity is not exclusive to any particular subset, which further complicates phenotypic identification.
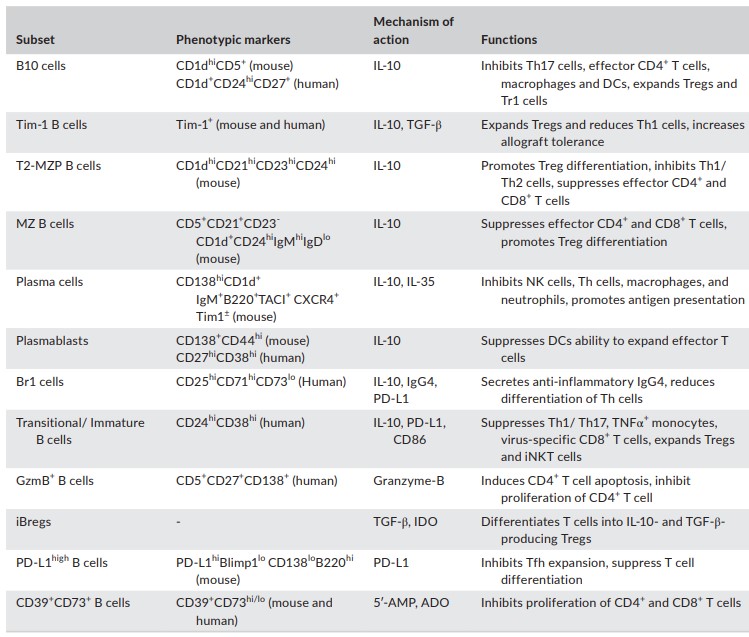
Fig. 3 Phenotype and function of Breg subsets[6]. Abbreviations: 5′-AMP, adenosine 5′-monophosphate; ADO, adenosine; Br1, B regulatory 1 (Br1) cells; DC, dendritic cell; GzmB, Granzyme B; IDO,indoleamine 2,3 dioxygenase; iNKT, inducible natural killer T cell; MZ, marginal zone; NK, natural killer cell; PD-L1, programmed cell death-ligand 1;T2-MZP, transitional-2 marginal zone precursor; Tim-1, T cell immunoglobulin and mucin-domain-containing protein 1; Tregs, regulatory T cells
04 Multiparameter Flow Cytometry Panels for Comprehensive B Cell Subset Analysis
The design of a multiparameter flow cytometry panel requires a balance among marker selection, fluorochrome conjugation, antibody titration, and gating strategy. For B‑cell subset analysis, Knight[1] recommends a basic panel comprising seven core markers: CD19 (B‑cell lineage), IgD and CD27 (to distinguish naïve/memory), CD38 and CD24 (to identify transitional cells and ASCs), CD21 (to assess activation/resting status), as well as a dump channel for non‑B cells (e.g., CD3 and CD14). This combination allows simultaneous application of both the IgD vs CD27 and IgD vs CD38 classification schemes.
Table 1. Quick Check of the Functions of Core Markers of B cells
|
Markers |
Main functions |
Key application scenarios |
|
CD19 |
Universal markers for B-cell lineages |
Throughout all stages of B cells (partial loss at the plasma cell stage) |
|
CD20 |
B-cell lineage markers |
Plasma cell stage loss is used to distinguish plasma cells |
|
IgD / IgM |
Naive vs. Memory distinction |
The core of the classic classification scheme |
|
CD27 |
Memory B cell marker |
CD27⁺=Memory,CD27⁻=Naïve |
|
CD38 |
Activation/plasma cell markers |
CD38⁺⁺ recognizes ASC/ plasma blasts |
|
CD24 |
Transitional B/Breg marker |
CD24ʰⁱCD38ʰⁱdefine Transitional B and tBreg |
|
CD21 |
Resting/active state |
CD21low is associated with activated/depleted memory |
|
CD10 |
Transitional vs mature B |
Distinguish between early bone marrow development and peripheral mature B cells |
|
CD45RB |
Early memory B cells |
The new classification scheme adds new marks |
|
CD73 / CD95 |
Memory B cell subsets |
Fine subgroups such as discriminative effect memory |
|
CD11c |
CD19ʰⁱCD11c⁺ memory group |
Subgroups related to autoimmune diseases |
|
CD39 |
Regulatory/tissue-specific population |
Tonsilla-specific B cell population |
Table 2. 24‑color panel for antigen‑specific B cell subsets flow cytometry discrimination in chronic infections (such as hepatitis B)
|
Categories |
Markers |
Functions |
|
B-cell lineage |
CD19、CD20 |
B-cell identity confirmation |
|
B-cell differentiation / subsets |
CD10、CD38、CD24、IgM、IgD、CD27、CD21、CD43、CD5 |
Distinguish the developmental stages and subsets of B cells |
|
chemokine receptor |
CXCR3、CXCR5 |
Organizational migration and homing |
|
costimulatory molecules |
CD86 |
Activation status of B cells |
|
Fc receptor |
CD32 |
Immune complex binding and signal regulation |
|
regulatory molecules |
BTLA、CD39 |
Immunosuppression and regulation |
|
Inhibition / exhaustion marker |
PD-1、FcRL5、CD11c、CD22 |
Chronic infection/consumption-related phenotypes |
|
Antigen-specific probe |
Hbv-specific dual-fluorescence labeled probe |
Identify antigen-specific B cells |
During the panel design process, several key aspects require special attention[1,8]: (1) Antibody clone selection: different clones against the same antigen may exhibit distinct binding characteristics; (2) Fluorochrome pairing: spillover spreading error must be evaluated to avoid assigning markers with low expression to channels with high spreading error; (3) Sequential staining: when using multiple anti‑immunoglobulin antibodies, a stepwise sequential staining approach should be employed to prevent antibody competition[9]; (4) Gating strategy optimization: ensure that sufficient cell numbers are acquired for rare subsets (such as transitional B cells and ASCs), with a recommended minimum of 25–100 events to guarantee statistical reliability.
05 Functional Biomarkers Beyond Surface Markers for B Cell Activation
Traditionally, the assessment of B‑cell activation status has relied primarily on changes in surface marker expression, such as upregulation of CD69, CD86, and MHC class II molecules, as well as markers like CD27 and IgD used to distinguish memory from naïve B cells. However, these static surface molecular indicators are insufficient to fully reflect the dynamic functional changes that occur during B‑cell activation. In recent years, an increasing number of studies have revealed that metabolic reprogramming, signaling pathway activation, and mitochondrial dynamics can serve as novel B‑cell activation markers.
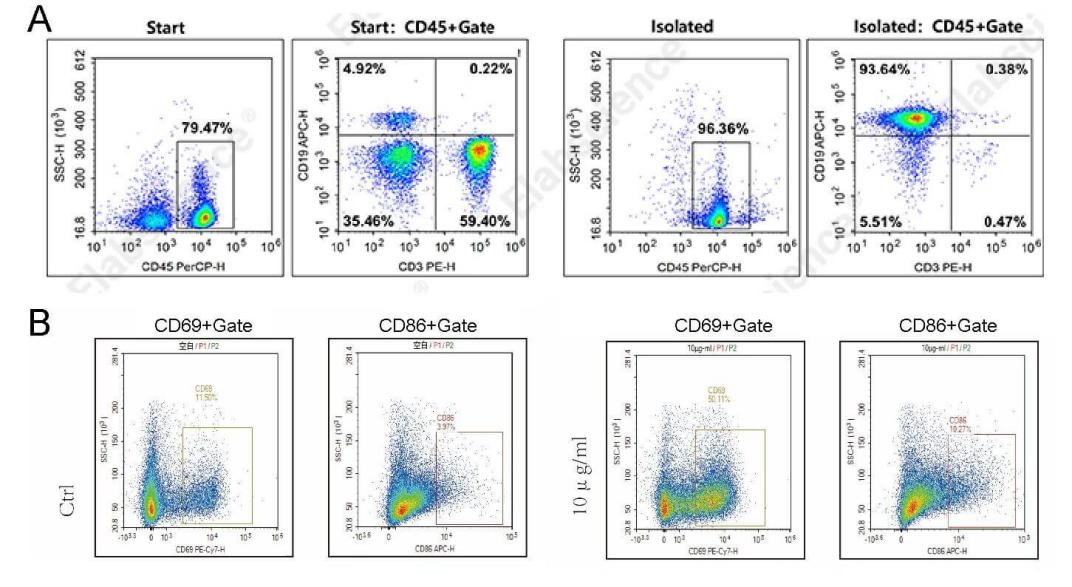
Fig. 4 Sorting and activation results of B cells in human peripheral blood. A. B cells were sorted from peripheral blood using the EasySort™ Human B Cell Isolation Kit (MIH004N), then flow cytometry staining was performed using anti-CD45, anti-CD3 antibodies and anti-CD19 antibody. The proportions of B cells before and after sorting were 4.9% and 93.6%, respectively. B. Sorted B cells were cultured and stimulated with 10 μg/mL LPS for 24 h. The results showed that the proportion of CD69⁺ cells was significantly increased, and the proportion of CD86⁺ cells was also elevated, indicating that LPS stimulation induced early activation in a subset of cells.
5.1 Metabolic reprogramming serves as a functional marker of B-cell activation
The transition of B cells from a resting to an activated state is accompanied by profound metabolic reprogramming. Waters et al.[10] systematically investigated metabolic changes during CD40L/IL‑4‑induced T‑cell‑dependent B‑cell activation using RNA‑seq combined with glucose isotopic tracing. The study revealed that activated B cells significantly upregulated OXPHOS and TCA cycle metabolic programs, along with enhanced nucleotide biosynthesis; however, glycolysis was unexpectedly not markedly enhanced. Isotopic tracing demonstrated that glucose carbon was primarily directed toward de novo ribonucleotide synthesis rather than into the TCA cycle; the increased TCA cycle intermediates were mainly derived from glutamine rather than glucose. This finding challenges the prevailing assumption that activated B cells rely on glycolysis, suggesting that OXPHOS and glutamine metabolism are the key metabolic features of B‑cell activation. Functional validation showed that glucose restriction had minimal effect on B‑cell activation, whereas inhibition of OXPHOS (by oligomycin treatment) or glutamine deprivation severely impaired B‑cell growth, differentiation, and class‑switch recombination. These findings establish OXPHOS activity and glutamine metabolism as important biomarkers of the functional state of B‑cell activation.
In addition, changes in mitochondrial dynamics also serve as important functional indicators reflecting B‑cell activation status. Using super‑resolution Airyscan microscopy, Waters et al.[10] found that resting B cells contained only approximately 2.6 mitochondria per cell with an elongated morphology; upon activation, the mitochondrial number increased to about 5.0 per cell and the morphology became more rounded and shorter, but mitochondrial DNA (mtDNA) copy numbers did not increase. This unique mitochondrial fission strategy (fragmentation without accompanying mtDNA replication), which parallels the increased demand for OXPHOS, provides a new dimension for functional assessment of B‑cell activation.
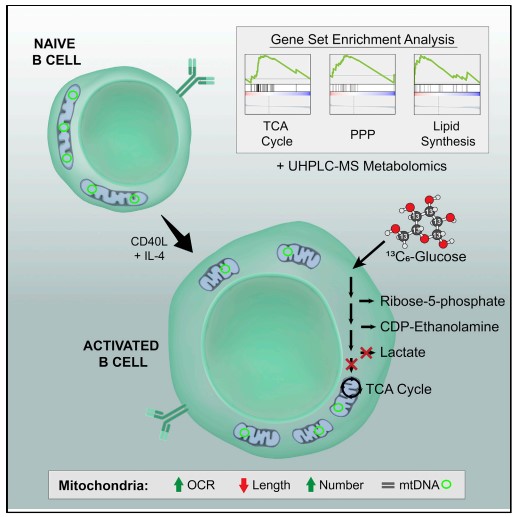
Fig. 5 Metabolic reprogramming and mitochondrial dynamics in activated B cells[10]. Glucose is not essential for B‑cell activation; oxidative phosphorylation is fueled by other nutrients. The few, elongated mitochondria in resting B cells are remodeled into many punctate mitochondria upon activation. The numbers of mtDNA and nucleoids remain similar between naïve B cells and those stimulated for 24 hours.
5.2 Phosphorylation of signal transduction pathways as a functional biomarker
The phosphorylation status of downstream signaling pathways downstream of the BCR directly reflects the activation potential of B cells. Perez et al.[11] established a flow cytometry‑based phosphoprotein detection technology (phospho‑flow) that enables simultaneous measurement of phosphorylation at multiple signaling nodes and resolves signaling networks at the single‑cell level. By measuring the phosphorylation levels of key signaling molecules including SYK, BTK, PLCγ2, ERK, AKT, and STAT, the functional status of B cells can be comprehensively assessed. This technology has been successfully applied to signaling network analysis of patient samples with leukemia, revealing that phosphoprotein signaling signatures are significantly correlated with FLT3 mutation status, cytogenetic abnormalities, and chemotherapy response, demonstrating the clinical value of phosphorylation signals as functional biomarkers.
5.3 Calcium signaling serves as a functional indicator of activation
Upon BCR cross‑linking, activation of PLCγ2 leads to IP3 production and intracellular Ca²⁺ release, which are key early events in B‑cell activation. The amplitude and kinetic features of calcium flux can reflect the strength of BCR signaling and the extent of B‑cell activation. Traditionally, calcium flux has been detected using calcium‑sensitive fluorescent dyes (such as Fluo‑3 and Fura‑2) in conjunction with flow cytometry, and this has become a classic functional assay for assessing B‑cell functional status[11]. Several studies have confirmed that Btk‑dependent phosphorylation of PLCγ2 at Y753, Y759, Y1197, and Y1217 is critical for initiating calcium signaling, and these phosphorylation events can serve as functional biomarkers of BCR signaling pathway integrity.
In summary, B‑cell functional biomarkers now extend beyond surface markers to include metabolic reprogramming (OXPHOS and glutamine dependence), mitochondrial dynamics, signaling phosphorylation, and calcium flux. These dynamic readouts enable deeper functional assessment than static markers and hold promise for precision diagnostics and therapy in autoimmune diseases and hematological malignancies.
06 Validating B Cell Subsets Using Multi-Omics and Protein-Level Assays
Traditional identification of B cell subsets relies primarily on B cell subsets flow cytometry to detect combinatorial expression of surface markers. However, this classification criterion based on a limited set of surface markers has limitations such as non‑standardized definitions, non‑binary expression of markers, and non‑overlap between different definitions[1]. In recent years, the rapid development of single‑cell multi‑omics technologies and protein‑level assays has provided revolutionary tools for precise identification and functional validation of B cell subsets.
Vandereyken et al.[13] reviewed recent advances in single‑cell and spatial multi‑omics. In B‑cell subset research, these technologies profile individual B cells at multiple molecular levels—genome, epigenome, transcriptome, and proteome—offering high‑resolution subset identification. For example, SHARE‑seq and sci‑CAR‑seq correlate transcriptome with chromatin accessibility, revealing functional subsets missed by conventional markers; scNMT‑seq links DNA methylation and transcriptome to dissect differentiation trajectories and epigenetic states. Spatial multi‑omics add tissue context, enabling study of subset localization and function in different microenvironments.
6.1 CITE-seq: Combined Analysis of Transcriptome and Protein Levels
CITE‑seq simultaneously sequences transcriptomes and detects protein markers at single‑cell resolution. It uses antibodies conjugated with oligonucleotide barcodes; antibody‑derived tags are captured, reverse‑transcribed, and sequenced with cellular mRNA. In B‑cell studies, this approach provides both transcriptomic and surface protein data from the same cell, directly linking transcriptional clusters to immunophenotypes. Its protein readouts are quantitatively concordant with flow cytometry and can reveal subtle subset differences undetectable by transcriptomics alone[14].
6.2 Mass Cytometry (CyTOF) and High‑Dimensional Protein Analysis
CyTOF utilizes metal‑isotope‑labeled antibodies as substitutes for fluorochromes, enabling simultaneous detection of more than 40 protein parameters at the single‑cell level. Compared with conventional flow cytometry, CyTOF overcomes the issue of fluorescence spectral overlap and substantially increases the dimensionality of multiparameter analysis. When combined with high‑dimensional data analysis algorithms (such as t‑SNE and UMAP for dimensionality reduction and clustering), CyTOF can identify rare B‑cell subsets that are unresolvable by traditional methods, such as the fine substructure of CD21low B cells and age‑associated B cells[1].
6.3 Application of Phospho‑Protein Detection in Functional Validation of B‑Cell Subsets
Phospho‑specific protein detection based on flow cytometry (phospho‑flow) directly links the phenotypic characteristics of B‑cell subsets with their functional status by measuring the phosphorylation states of intracellular signaling proteins. By combining surface marker immunophenotyping with intracellular phospho‑signaling assessment, the distinct signal transduction signatures of different B‑cell subsets can be identified[11]. For example, simultaneous detection of surface markers for multiple B‑cell subsets together with intracellular pSTAT, pERK, pAKT, and pSYK can reveal intrinsic differences among B‑cell subsets in activation thresholds and signaling network connectivity.
In summary, integrating single-cell multi-omics (e.g., scRNA‑seq, CITE‑seq, CyTOF) with protein‑level methods (phospho‑flow, high‑dimensional cytometry) transforms B‑cell subset identification. By profiling cells across transcriptomic, proteomic, epigenetic, and signaling dimensions, this strategy overcomes the limitations of traditional surface‑marker‑based classification and enables discovery of functionally important rare subsets. These advances collectively underpin deeper understanding of B‑cell roles in autoimmunity, infectious immunity, and tumor immunology.
Quick Overview of Elabscience® Popular Products:
Table 3. Reagents for B cell
|
Cat. No. |
Product Name |
|
MIM004N |
EasySort™ Mouse B Cell Isolation Kit |
|
MIH004N |
EasySort™ Human B Cell Isolation Kit |
|
E-AB-F0986D |
PE Anti-Mouse CD19 Antibody[1D3] |
|
E-AB-F1004D |
PE Anti-Human/Monkey CD19 Antibody[CB19] |
|
E-AB-F1212D |
PE Anti-Human/Monkey CD20 Antibody[2H7] |
|
E-AB-F1189E |
APC Anti-Mouse IgD Antibody[11-26c.2a] |
|
E-AB-F1190C |
FITC Anti-Mouse IgM Antibody[RMM-1] |
|
AN00322E |
APC Anti-Mouse CD27 Antibody[LG.3A10] |
|
E-AB-F1058D |
PE Anti-Human CD38 Antibody[HIT2] |
|
E-AB-F1179E |
APC Anti-Mouse CD24 Antibody[M1/69] |
|
E-AB-F1377D |
PE Anti-Human CD21 Antibody[HB5] |
|
E-AB-F1078C |
FITC Anti-Human CD10 Antibody[CB-CALLA] |
|
E-AB-F1242D |
PE Anti-Human CD73 Antibody[AD2] |
|
E-AB-F1168C |
FITC Anti-Human/Monkey CD95/Fas Antibody[DX2] |
|
E-AB-F0991M1 |
Elab Fluor® 700 Anti-Mouse CD11c Antibody[N418] |
|
E-AB-F1165H |
PE/Cyanine7 Anti-Human/Monkey CD39 Antibody[A1] |
References:
[1] KUM A, AKHA A A S. Flow cytometry for B-cell subset analysis in immunodeficiencies [J]. JOURNAL OF IMMUNOLOGICAL METHODS, 2022, 509.
[2] GLASS D R, TSAI A G, OLIVERIA J P, et al. An integrated multi-omic single-cell atlas of human B cell identity [J]. IMMUNITY, 2020, 53(1): 217-+.
[3] SANZ I, WEI C W, JENKS S A, et al. Challenges and opportunities for consistent classification of human B cell and plasma cell populations [J]. FRONTIERS IN IMMUNOLOGY, 2019, 10.
[4] SURYANI S, FULCHER D A, SANTNER-NANAN B, et al. Differential expression of CD21 identifies developmentally and functionally distinct subsets of human transitional B cells [J]. BLOOD, 2010, 115(3): 519-29.
[5] JANSEN K, CEVHERTAS L, MA S Y, et al. Regulatory B cells, A to Z [J]. ALLERGY, 2021, 76(9): 2699-715.
[6] MENON M, HUSSELL T, SHUWA H A. Regulatory B cells in respiratory health and diseases [J]. IMMUNOLOGICAL REVIEWS, 2021, 299(1): 61-73.
[7] DASGUPTA S, DASGUPTA S, BANDYOPADHYAY M. Regulatory B cells in infection, inflammation, and autoimmunity [J]. CELLULAR IMMUNOLOGY, 2020, 352.
[8] CASCINO K, ROEDERER M, LIECHTI T. OMIP-068: High-dimensional characterization of global and antigen-specific B cells in chronic infection [J]. Cytometry Part A, 2020, 97(10): 1037-43.
[9] NETTEY L, BALLARD R, LIECHTI T, MASON R D. OMIP 074: Phenotypic analysis of IgG and IgA subclasses on human B cells [J]. CYTOMETRY PART A, 2021, 99(9): 880-3.
[10] WATERS L R, AHSAN F M, WOLF D M, et al. Initial B cell activation induces metabolic reprogramming and mitochondrial remodeling [J]. ISCIENCE, 2018, 5: 99-+.
[11] PEREZ O D, NOLAN G P. Phospho-proteomic immune analysis by flow cytometry: from mechanism to translational medicine at the single-cell level [J]. IMMUNOLOGICAL REVIEWS, 2006, 210: 208-28.
[12] BONASIA C G, ABDULAHAD W H, RUTGERS A, et al. B cell activation and escape of tolerance checkpoints: recent insights from studying autoreactive B cells [J]. CELLS, 2021, 10(5).
[13] VANDEREYKEN K, SIFRIM A, THIENPONT B, VOET T. Methods and applications for single-cell and spatial multi-omics [J]. NATURE REVIEWS GENETICS, 2023, 24(8): 494-515.
[14] STOECKIUS M, HAFEMEISTER C, STEPHENSON W, et al. Simultaneous epitope and transcriptome measurement in single cells [J]. NATURE METHODS, 2017, 14(9): 865-+.

