

Helper T cells, specifically the CD4+ T lymphocyte subset, function as the central orchestrators of the adaptive immune system, directing the magnitude, quality, and duration of immune responses through complex regulatory networks. These cells are defined by their expression of the CD4 co-receptor and their restriction to recognizing antigens presented on major histocompatibility complex (MHC) Class II molecules. Upon activation, naive CD4+ T cells undergo a sophisticated differentiation process, transforming into specialized effector subsets including Th1, Th2, Th17, T follicular helper (Tfh), and regulatory T (Treg) cells, each characterized by distinct lineage-defining transcription factors and cytokine secretion profiles.
This review systematically summarizes the functional distinctions of Th1, Th2, Th17, Tfh and Treg cells, their core surface markers for subset identification, secreted cytokines and corresponding immune effector functions, indispensable antigen presentation cues required for their activation, and accessible in vitro experimental strategies to evaluate helper T cell function.
Table of Contents
1. Functional Differences Between Th1, Th2, Th9, Th17, Tfh, and Treg Cells
2. Key Surface Markers Used to Identify Helper T Cells
3. Cytokines Secreted by Helper T Cells and Their Immune Functions
4. Antigen Presentation Required for Helper T Cell Activation
5. Experimental Methods to Assess Helper T Cell Function In Vitro
01 Functional Differences Between Th1, Th2, Th9, Th17, Tfh, and Treg Cells
The functional diversification of CD4⁺ helper T cell subsets serves as a core adaptive immune mechanism that tailors host responses to distinct pathogen types while preserving immune self-tolerance. These lineages, including T helper 1 (Th1), T helper 2 (Th2), T helper 9 (Th9), T helper 17 (Th17), T follicular helper (Tfh), and regulatory T cells (Tregs), exhibit distinct transcriptional profiles, cytokine secretion patterns, and effector activities that jointly shape diverse immune outcomes. Naive CD4+ T cell lineage commitment is primarily instructed by the local cytokine microenvironment and antigen-presenting cell (APC)-derived signals, thereby ensuring both effective pathogen clearance and proper immune restraint. The main subsets of helper T cell differentiation are summarized as follows[1,2].
1.1 Th1 Cells: Host Defense Against Intracellular Pathogens
Th1 cells primarily mediate cellular immunity to eliminate intracellular pathogens, including viruses and Mycobacterium tuberculosis. Their differentiation is initiated by interleukin-12 (IL-12) and interferon-gamma (IFN-γ), which cooperatively induce the expression of the master transcription factor T-box expressed in T cells (T-bet). Mature Th1 cells secrete abundant IFN-γ, which potentiates macrophage microbicidal activity and facilitates the clearance of intracellular pathogens. In addition, Th1-derived IFN-γ enhances the differentiation and function of CD8+ T cells, further reinforcing cellular immune surveillance. Consistently, dysregulated Th1 activation contributes to organ-specific autoimmune pathologies such as type 1 diabetes and multiple sclerosis, underscoring the requirement for strict homeostatic control of Th1 responses[2,3].
1.2 Th2 Cells: Anti-Helminth Immunity and Allergic Inflammation
In contrast to Th1-driven cellular immunity, Th2 cells dominate host defense against extracellular helminth parasites and act as key mediators of allergic inflammation. Interleukin-4 (IL-4) is the primary instructive cytokine for Th2 lineage commitment via upregulation of the master transcription factor GATA binding protein 3 (GATA3). Th2 cells produce signature cytokines interleukin-4 (IL-4), interleukin-5 (IL-5), and interleukin-13 (IL-13). Specifically, IL-4 and IL-13 promote B cell immunoglobulin E (IgE) class switching, which triggers mast cell degranulation and eosinophil recruitment. Meanwhile, IL-5 sustains eosinophil development and activation, enabling the elimination of large phagocytosis-resistant parasites. Although Th2 responses are essential for helminth clearance, excessive Th2 polarization drives allergic disorders, including asthma and atopic dermatitis[4].
1.3 Th9 Cells: Mucosal Immunity, Allergic Responses and Tumor Immunology
Th9 cells represent a unique pro-inflammatory CD4+ T cell subset with distinct transcriptional and functional characteristics, distinguishable from conventional Th1, Th2, and Th17 lineages. Th9 cell differentiation is predominantly driven by the synergistic combination of transforming growth factor-beta (TGF-β) and interleukin-4 (IL-4), which cooperatively upregulate the lineage-specific master transcription factor PU.1. Unlike other Th subsets, Th9 cells are primarily defined by the robust secretion of interleukin-9 (IL-9), along with low levels of interleukin-10 (IL-10) under specific microenvironmental conditions. Functionally, Th9-derived IL-9 acts on multiple target cells, including mast cells, eosinophils, and mucosal epithelial cells, to amplify type 2 inflammatory responses. This process facilitates mucosal host defense against extracellular parasites, particularly intestinal helminths. In addition to parasitic immunity, aberrant Th9 cell activation is closely associated with the pathogenesis of multiple allergic and inflammatory disorders, such as allergic rhinitis, atopic dermatitis, and asthma. Emerging evidence also indicates that Th9 cells exert dual roles in tumor immunity: they can promote anti-tumor immune responses by enhancing the cytotoxic activity of innate immune cells, while excessive Th9-mediated inflammation may also favor tumor microenvironment remodeling in specific malignancies[5].
1.4 Th17 Cells: Mucosal Immunity and Autoimmune Pathogenesis
Th17 cells confer critical protection against extracellular bacteria and fungi, particularly at mucosal barriers such as the intestinal and respiratory epithelia. Their differentiation depends on the synergistic action of transforming growth factor-beta (TGF-β) and pro-inflammatory cytokines including interleukin-6 (IL-6) and interleukin-21 (IL-21), which together induce the lineage-specifying transcription factor retinoid-related orphan nuclear receptor gamma t (RORγt). Functional Th17 cells secrete interleukin-17A (IL-17A), interleukin-17F (IL-17F), interleukin-21 (IL-21), and interleukin-22 (IL-22). Mechanistically, IL-17 stimulates stromal cells to release neutrophil-attracting chemokines to resolve local infection, whereas IL-22 strengthens epithelial barrier integrity and antimicrobial peptide production. Owing to their potent pro-inflammatory properties, aberrant Th17 activity is tightly linked to multiple autoimmune diseases, such as psoriasis, rheumatoid arthritis, and inflammatory bowel disease[6].
1.5 T Follicular Helper (Tfh) Cells: Germinal Center Formation and Humoral Immunity
Tfh cells are uniquely specialized to provide B cell helper signals within germinal centers of secondary lymphoid organs. Tfh differentiation is driven by interleukin-6 (IL-6) and interleukin-21 (IL-21), which induce the expression of the key transcription factor B-cell lymphoma 6 (Bcl-6) and the chemokine receptor C-X-C motif chemokine receptor 5 (CXCR5). CXCR5 subsequently guides Tfh cell migration toward B cell follicles. Tfh cells constitutively express cluster of differentiation 40 ligand (CD40L) and secrete interleukin-21 (IL-21), both of which are indispensable for supporting B cell proliferation, somatic hypermutation, class switch recombination, and high-affinity antibody generation. By selecting high-quality B cell clones, Tfh cells are essential for establishing long-term humoral immune memory and robust vaccine responses. Conversely, aberrant Tfh activation promotes pathological autoantibody production, which drives systemic autoimmune diseases such as systemic lupus erythematosus[7].
1.6 Regulatory T (Treg) Cells: Immune Homeostasis and Self-Tolerance
Tregs are essential for suppressing excessive effector immune responses and maintaining peripheral self-tolerance. This subset is defined by stable expression of the transcription factor forkhead box protein P3 (Foxp3) and the high-affinity interleukin-2 (IL-2) receptor cluster of differentiation 25 (CD25). Tregs exert immunosuppressive functions through multiple complementary mechanisms, including the secretion of inhibitory cytokines interleukin-10 (IL-10) and transforming growth factor-beta (TGF-β), metabolic competition for local IL-2, and direct cell contact-mediated inhibition. Notably, Treg and Th17 differentiation pathways are mutually antagonistic and tightly regulated by cytokine context. While TGF-β alone favors Treg development, combined TGF-β and IL-6 stimulation switches naive T cell fate toward the Th17 lineage, representing a critical immune regulatory checkpoint. Accordingly, impaired Treg function disrupts immune tolerance and causes severe autoimmune pathology, confirming Tregs as central negative modulators of immune activation[8].
In summary, the functional specialization of distinct CD4+ T cell subsets enables the immune system to mount pathogen-specific, appropriately balanced responses. Th1 and Th2 cells constitute the canonical regulatory axis that segregates cellular and humoral immune functions, whereas Th17 and Th9 cells provide specialized mucosal barrier defense and inflammatory regulation. Tfh cells bridge cellular and humoral immunity by optimizing antibody quality and memory formation, while Tregs restrain overactive effector cascades to prevent host tissue damage. This sophisticated differentiation network sustains systemic immune homeostasis, and its dysfunction represents a common pathological feature of infectious, autoimmune, and allergic diseases.
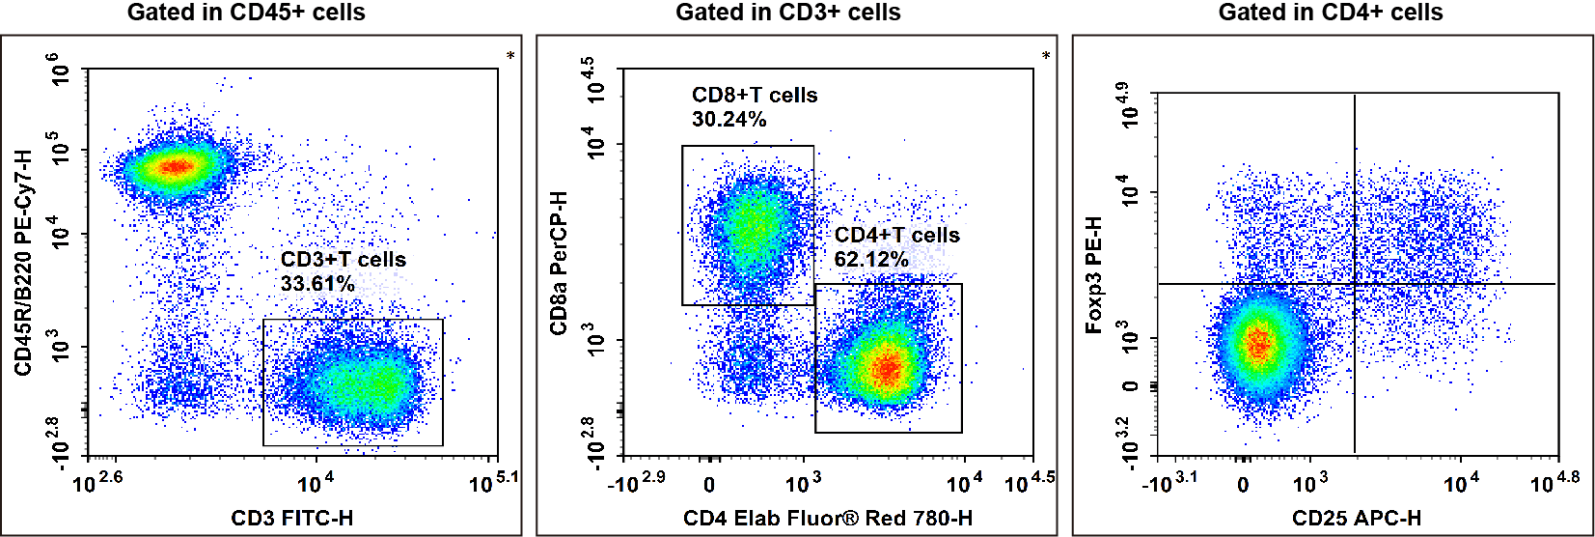
Fig. 1 Detection and analysis of Treg cells in C57BL/6 mouse splenocytes. C57BL/6 mouse splenocytes were surface stained with Elab Fluor® Violet 450 Anti-Mouse CD45, PE/Cyanine7 Anti-Mouse CD45R/B220, FITC Anti-Mouse CD3, Elab Fluor® Red 780 Anti-Mouse CD4, PerCP Anti-Mouse CD8a and APC Anti-Mouse CD25 and then treated with Foxp3/Transcription Factor Staining Kit. Cells were then stained with PE Anti-Mouse Foxp3, followed by analysis via flow cytometry. Regulatory T cells (Treg cells) exhibit the phenotype of CD45+CD45R/B220-CD3+CD4+CD25+Foxp3+. (The data are provided by Elabscience.)
_.png)
Fig. 2 Detection and analysis of Treg cells in Human Peripheral blood mononuclear cells (PBMCs). Human PBMCs were stained with Elab Fluor® Violet 450 Anti-Human CD45, Elab Fluor® Red 780 Anti-Human CD3, FITC Anti-Human CD4, PerCP/Cyanine5.5 Anti-Human CD8, PE Anti-Human CD25 and APC Anti-Human CD127, followed by analysis via flow cytometry. Regulatory T cells (Treg cells) exhibit the phenotype of CD45+CD3+CD4+CD127LOW/-CD25+. (The data are provided by Elabscience.)
Elabscience® Quick Overview of Popular Products:
Table 1. Reagents for Treg cell Research
|
Product Name |
Cat. No. |
|
Elab Fluor® Violet 450 Anti-Mouse CD45 Antibody[30-F11] |
E-AB-F1136Q |
|
PE/Cyanine7 Anti-Mouse CD45R/B220 Antibody[RA3.3A 1/6.1] |
E-AB-F1112H |
|
FITC Anti-Mouse CD3 Antibody[17A2] |
E-AB-F1013C |
|
Elab Fluor® Red 780 Anti-Mouse CD4 Antibody[RM4-5] |
E-AB-F1353S |
|
PerCP Anti-Mouse CD8a Antibody[53-6.7] |
E-AB-F1104F |
|
APC Anti-Mouse CD25 Antibody[PC-61.5.3] |
E-AB-F1102E |
|
PE Anti-Mouse Foxp3 Antibody[3G3] |
E-AB-F1238D |
|
10×ACK Lysis Buffer |
E-CK-A105 |
|
Ready-to-Use Foxp3/Transcription Factor Staining Kit |
E-CK-A108 |
|
Elab Fluor® Violet 450 Anti-Human CD45 Antibody[HI30] |
E-AB-F1137Q |
|
Elab Fluor® Red 780 Anti-Human CD3 Antibody[OKT-3] |
E-AB-F1001S |
|
FITC Anti-Human/Monkey CD4 Antibody[SK3] |
E-AB-F1352C |
|
PerCP/Cyanine5.5 Anti-Human CD8 Antibody[UCHT-4] |
AN00427J |
|
PE Anti-Human CD25 Antibody[BC96] |
E-AB-F1194D |
|
APC Anti-Human CD127/IL-7RA Antibody[A019D5] |
E-AB-F1152E |
|
Human PBMC Separation Solution(P 1.077) |
E-CK-A103 |
|
10×ACK Lysis Buffer |
E-CK-A105 |
|
10× RBC Lysis/Fixation Solution |
E-CK-A106 |
02 Key Surface Markers Used to Identify Helper T Cells
The identification and functional characterization of CD4+ T helper cells rely on a distinct constellation of surface markers that define their lineage, activation status, and migratory potential. These surface proteins are not merely passive identifiers but active participants in signal transduction, cell-cell interaction, and immune regulation.
The definitive identification of helper T cells in any assay relies on the canonical CD3+CD4+CD8- phenotype (helper T cell markers). CD3 serves as the universal marker for all T lymphocytes via the TCR complex, while CD4 acts as the specific co-receptor binding MHC-II, confirming the helper lineage. Simultaneously, the exclusion of CD8 is critical to distinguish these cells from cytotoxic T cells, forming the essential gating strategy in flow cytometry and immunohistochemistry.
Beyond basic lineage discrimination, additional accessory surface markers enable precise evaluation of T cell maturity and activation status. Representative markers (helper T cell markers) applied for refined phenotypic analysis are summarized in the table below[9,10].
Table 2. Companion biomarkers for Th cell subtype typing and purity detection
|
Marker |
What it tells you |
Typical helper‑T pattern |
|
TCRαβ (or TCRγδ) |
Confirms αβ T‑cell (most helpers are αβ). |
TCRαβ+ (≈95 % of CD4+) |
|
CD28 |
Co‑stimulatory receptor, present on most naïve/memory helpers. |
CD28+ (bright) |
|
CD45RA/CD45RO |
Naïve vs memory subsets. |
RA+RO⁻ = naïve; RA⁻RO⁺ = memory |
|
CD62L (L‑selectin), CCR7 |
Lymph‑node homing (central memory) vs effector memory. |
CD62L⁺CCR7⁺ = Tcm; CD62L⁻CCR7⁻ = Tem |
|
CD25 (IL‑2Rα) |
Up‑regulated on activation; also marks Tregs (CD4⁺CD25⁺FoxP3⁺). |
Low on resting helpers, high after activation |
|
HLA‑DR, CD38 |
Activation markers (especially for recently stimulated Th). |
Inducible |
|
PD‑1, CTLA‑4 |
Exhaustion/regulatory checkpoints (seen in chronic infection/Tumor). |
Variable, frequently upregulated in exhausted Th |
Since helper T cells are functionally heterogeneous, specific chemokine receptors and surface molecules are used to delineate distinct subsets. These are not required to simply “identify a helper T cell”, but they’re the usual next step when you need to know which helper flavor you’re looking at. The subset-specific chemokine and cytokine receptor markers are shown in the following table[11,12].
Table 3. Subset-specific chemokine and cytokine receptor markers (to split Th1 Th2 Th17 Treg etc.)
|
Subset |
Key surface combo (besides CD4) |
|
Th1 |
CXCR3+, CCR5+, (sometimes IL‑12Rβ2) |
|
Th2 |
CCR4+, CRTH2+ (CD294), (IL‑33R/ST2) |
|
Th9 |
CCR3+ (Certain subsets co-express CCR6) |
|
Th17 |
CCR6+, IL‑23R+, CD161+ (in humans) |
|
Th22 |
CCR6+, CCR10+, CD26+ |
|
Tfh (follicular helper) |
CXCR5+, PD‑1+, ICOS+, BCL6 (intracellular) |
|
Regulatory T (Treg) |
CD4+CD25+FoxP3+, CD127low, HELIOS+, CTLA‑4+ |
In summary, the identification of helper T cells requires a multi-parameter approach that goes beyond simple CD4 expression. The integration of markers such as CD45RA/RO, CD25, CD127, CXCR5, PD-1, and CTLA-4 allows for the precise delineation of naive, memory, regulatory, and effector subsets. This detailed phenotypic characterization is essential for diagnosing immunological disorders, monitoring vaccine responses, and developing targeted immunotherapies that modulate specific T cell populations.
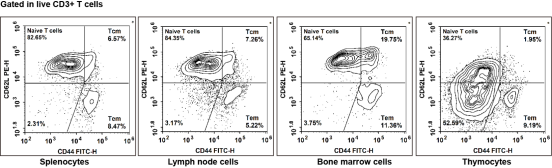
Fig. 3 Detection of T cells in mouse tissues. Splenocytes, lymph node cells, bone marrow cells and thymocytes isolated from C57BL/6 mice were stained with PerCP/Cyanine5.5 anti-mouse CD45, APC anti-mouse CD3, Elab Fluor® Violet 610 anti-mouse CD4, Elab Fluor® Violet 450 anti-mouse CD8, PE anti-mouse CD62L and FITC anti-mouse CD44, and subsequently analyzed via flow cytometry. Total T cells were gated as CD3+ cells, helper T (Th) cells as CD3+CD4+ cells, and cytotoxic T (Tc) cells as CD3+CD8+ cells. In terms of phenotypic classification, naive T cells were characterized by the CD62L+CD44- phenotype, effector memory T cells (TEM) by the CD62L-CD44+ phenotype, and central memory T cells (TCM) by the CD62L+CD44+ phenotype.
Elabscience® Quick Overview of Popular Products:
Table 4. Multicolor Panel for Flow Cytometric Analysis of Human and Mouse Naive T cells vs. Memory T cells
|
Marker |
Clone |
Fluorochrome |
Cat. No. |
Species Reactivity |
|
CD3 |
OKT-3 |
Elab Fluor®700 |
E-AB-F1001M1 |
Human |
|
CD4 |
SK3 |
PerCP/Cyanine5.5 |
E-AB-F1109J |
Human |
|
CD45RA |
HI100 |
FITC |
E-AB-F1052C |
Human |
|
CD197/CCR7 |
G043H7 |
PE |
E-AB-F1159D |
Human |
|
CD45 |
30-F11 |
PerCP/Cyanine5.5 |
E-AB-F1136J |
Mouse |
|
CD3 |
17A2 |
APC |
E-AB-F1013E |
Mouse |
|
CD4 |
GK1.5 |
Elab Fluor® Violet 610 |
E-AB-F1097T |
Mouse |
|
CD8 |
53-6.7 |
Elab Fluor® Violet 450 |
E-AB-F1104Q |
Mouse |
|
CD62L |
MEL-14 |
PE |
E-AB-F1011D |
Mouse |
|
CD44 |
IM7 |
FITC |
E-AB-F1100C |
Mouse |
03 Cytokines Secreted by Helper T Cells and Their Immune Functions
Cytokines secreted by CD4+ helper T cells function as central intercellular messengers within adaptive immunity, which govern the type, magnitude and persistence of antigen-specific immune responses. As soluble signaling mediators, these proteins target a broad spectrum of recipient cells ranging from lymphocytes and macrophages to eosinophils and tissue structural cells. Such paracrine signaling orchestrates tailored immune defense against distinct pathogen categories while simultaneously sustaining immune self-tolerance.
Distinct CD4+ T cell subsets, including Th1, Th2, Th17, Tfh and Tregs, acquire specialized effector functions through subset-restricted cytokine secretion programs. The divergent cytokine signatures of each lineage are hardwired by lineage-defining master transcription factors. Dissecting these cytokine regulatory networks is critical to uncover the molecular mechanisms underlying protective host immunity, allergic inflammatory disorders, autoimmune pathologies, and immune-mediated suppression[13].
Table 5 summarizes representative cytokines derived from distinct helper T cell lineages alongside their corresponding biological functions[13,14,15].
Table 5. Cytokines secreted by helper T Cell subsets and their functions
|
Subset |
Defining Cytokines |
Key Immune Functions |
Primary Cellular Targets |
|
Th1 |
IFN-γ, TNF-α, IL-2 |
Activates macrophages (classical); Upregulates MHC I/II; Promotes cell-mediated immunity & CTL response. |
Macrophages, CD8⁺ T cells, NK cells, DCs |
|
Th2 |
IL-4, IL-5, IL-13 |
B-cell class-switching to IgE; Eosinophil activation/differentiation; Mucus production & tissue repair; Alternative macrophage activation. |
B cells, Eosinophils, Mast cells, Epithelium |
|
Th9 |
IL-9, IL-10 |
Enhances mast cell growth/survival; Promotes mucosal healing; Contributes to tissue remodeling. |
Mast cells, Epithelial cells |
|
Th17 |
IL-17A/F, IL-22, GM-CSF |
Recruits neutrophils (via CXCL8/IL-8); Induces antimicrobial peptides (defensins); Maintains barrier integrity; Promotes tissue inflammation. |
Neutrophils, Epithelial cells, Stromal cells |
|
Th22 |
IL-22, TNF-α |
Promotes epidermal proliferation and wound healing; Induces antimicrobial peptides; Tissue repair at epithelial barriers. |
Keratinocytes, Epithelial cells |
|
Tfh |
IL-21 (+IL-4 in humans) |
Drives germinal center formation; Promotes B-cell proliferation & differentiation; Facilitates class-switch recombination & SHM. |
Germinal Center B cells |
|
Treg |
IL-10, TGF-β, IL-35 |
Suppresses APC maturation/function; Inhibits effector T cell proliferation; Maintains tolerance & homeostasis. |
DCs, CD4⁺/CD8⁺ T cells, B cells |
Note: Helper T cells are not rigid. Under inflammatory conditions, Th17 cells can acquire IFN-γ production (ex-Th17), and Th2 cells can produce IL-10. This table represents the canonical, polarized states.
In summary, the intricate network of cytokines secreted by helper T cells ensures that the immune response is tailored to the specific threat while preventing collateral damage to host tissues. Th1 and Th2 cytokines represent a classical dichotomy between cellular and humoral immunity, while Th17 cytokines provide specialized mucosal defense. Tfh cytokines optimize antibody quality, and Treg cytokines ensure that these powerful effector mechanisms do not cause autoimmunity. This functional diversity allows the immune system to maintain homeostasis and respond effectively to a wide array of challenges.
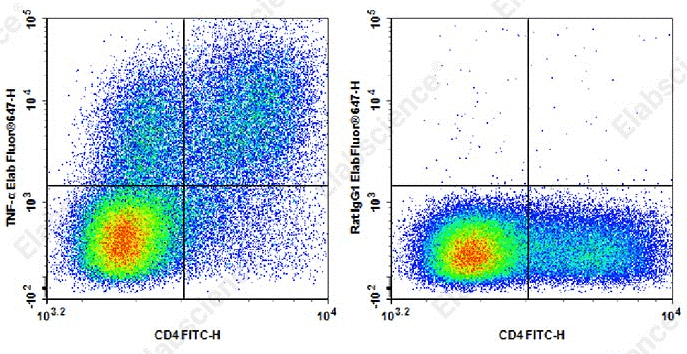
Fig. 4 Detection and analysis of TNF-α in C57BL/6 mouse splenocytes. C57BL/6 mouse splenocytes were stimulated with Cell Stimulation MIX and Protein Transport Inhibitor MIX for 5 h. Cells were stained with FITC anti-mouse CD4 antibody, alongside Elab Fluor® 647 Rat IgG1,κ isotype control (right) or Elab Fluor® 647 anti-mouse TNF-α (XT3.11) (left). Analysis was restricted to lymphocyte-gated cells. (The data are provided by Elabscience.)
Elabscience® Quick Overview of Popular Products:
Table 6. Reagents for research on cytokines secretion of T cell
|
Product Name |
Cat. No. |
|
Elab Fluor® 647 Anti-Mouse TNFα Antibody[XT3.11] |
AN00567M |
|
FITC Anti-Mouse CD4 Antibody[RM4-5] |
E-AB-F1353C |
|
Cell Stimulation and Protein Transport Inhibitor Kit |
E-CK-A091 |
|
Purified Anti-Human TNF-alpha Antibody[Infliximab297.rMAb] |
AN007890P |
|
Purified Anti-Human TNF-α Antibody[MAb11] |
AN008590P |
|
CellaQuant™ Human TNF-α (Tumor Necrosis Factor Alpha) ELISA Kit |
CQH014 |
|
Uncoated Human TNF-α(Tumor Necrosis Factor Alpha) ELISA Kit |
E-UNEL-H0175 |
04 Antigen Presentation Required for Helper T Cell Activation
CD4+ helper T cell activation is a tightly regulated biological process that relies fundamentally on the recognition of specific peptide antigens presented by major histocompatibility complex class II (MHC-II) molecules on professional antigen-presenting cells (APCs). This antigen presentation cascade acts as the core checkpoint for adaptive immune activation, ensuring T cells selectively respond to foreign antigens or altered self-antigens under physiological immunological conditions. Strict reliance on antigen presentation prevents spontaneous T cell activation and subsequent autoimmune pathogenesis, while enabling the immune system to mount precise, pathogen-targeted immune defenses. Beyond the physical binding of T cell receptors (TCRs) to peptide-MHC-II complexes, this sophisticated regulatory process integrates co-stimulation signals and microenvironmental cytokine cues, which collectively dictate the differentiation fate and functional status of naive CD4+ T cells.
4.1 The Role of MHC Class II in Antigen Presentation
The CD4 co-receptor on CD4+ T cells binds a conserved structural domain of MHC-II molecules. This intermolecular interaction stabilizes TCR-peptide-MHC-II binding and further promotes the recruitment and activation of lymphocyte-specific protein tyrosine kinase Lck. Activated Lck ultimately triggers downstream intracellular signaling cascades to initiate T cell activation[16].
4.2 Professional Antigen-Presenting Cells and Their Specialized Roles
Although multiple cell types can express MHC-II molecules under specific conditions, DCs are universally recognized as the most potent APCs for activating naive CD4+ T cells. DCs possess unique functional capacities for antigen capture and intracellular processing, as well as migration to secondary lymphoid organs to present antigens to naive T cell populations. Upon exposure to pathogenic stimuli or endogenous danger signals, immature DCs undergo phenotypic and functional maturation, accompanied by upregulated surface expression of MHC-II molecules and co-stimulatory molecules (CD80 and CD86), both of which are essential for robust CD4+ T cell activation[17].
Macrophages and B cells also function as professional APCs but display distinct functional specificity relative to DCs. These two cell types primarily interact with pre-activated or memory CD4+ T cells to execute context-dependent immune regulation. For instance, B cells internalize antigens via B cell receptors (BCRs) and present processed antigenic peptides to T follicular helper (Tfh) cells. This specific cellular crosstalk is indispensable for germinal center formation, B cell affinity maturation, and high-affinity antibody production[18].
4.3 The Three-Signal Model of T Cell Activation
Antigen presentation alone is insufficient to trigger full CD4+ T cell activation and serves solely as Signal 1 in the canonical three-signal T cell activation model. Signal 1 represents the antigen-specific stimulus induced by TCR engagement with peptide-MHC-II complexes. Notably, isolated Signal 1 without auxiliary co-stimulation fails to induce productive T cell activation; instead, it drives T cell anergy, a state of long-term functional unresponsiveness, or apoptotic cell death[19].
Signal 2 refers to the co-stimulatory signal, primarily mediated by the interaction between T cell surface CD28 and APC-expressed B7 family molecules (CD80/CD86). This co-stimulation supports T cell survival, clonal proliferation, and effector cytokine secretion. In particular, interleukin-2 (IL-2) released by activated T cells acts as a critical autocrine growth factor to sustain T cell expansion and functional activation[19].
Signal 3 comprises lineage-polarizing cytokines present in the local immune microenvironment during T cell activation, which dictate the differentiation trajectory of activated naive CD4+ T cells into distinct effector subsets. Specifically, IL-12 drives Th1 differentiation, IL-4 promotes Th2 development, and the combination of transforming growth factor-β (TGF-β) and IL-6 initiates Th17 lineage commitment[19].
4.4 Implications for Immune Regulation and Disease Pathogenesis
The multi-signal dependence of antigen presentation ensures precise targeting and tight regulation of CD4+ T cell-mediated immune responses. Defects in cellular antigen processing or presentation machinery cause severe primary immunodeficiencies, such as bare lymphocyte syndrome type II. This disorder is characterized by abrogated MHC-II expression, which impairs CD4+ T cell development and induces profound systemic immune dysfunction[20].
In contrast, aberrant self-antigen presentation arising from defective immune regulatory mechanisms disrupts immune self-tolerance and initiates autoimmune pathogenesis. Regulatory T cells (Tregs) are central to maintaining self-tolerance by suppressing autoreactive T cells that escape thymic negative selection. Mechanistically, Tregs exert immunosuppressive effects by modulating APC functional phenotypes and competitively consuming local IL-2 to constrain conventional T cell activation and proliferation[21].
Furthermore, the specificity and controllability of MHC-II-dependent antigen presentation have been widely harnessed in modern vaccine design. Rational vaccine formulation strategies enhance DC-mediated antigen uptake, processing, and presentation, thereby eliciting robust, long-lived CD4+ helper T cell responses. These T cell responses further sustain adaptive immunity by supporting persistent antibody production and cellular immune defense against pathogens[22].
In summary, MHC-II-mediated antigen presentation serves as an indispensable foundation for CD4+ helper T cell activation. It endows adaptive immunity with high antigen specificity, while the synergistic integration of co-stimulatory signals and polarizing cytokine cues calibrates the magnitude and lineage differentiation of immune responses to match distinct pathogenic threats. A thorough understanding of these regulatory mechanisms provides critical theoretical insights for developing novel therapies against autoimmune disorders, malignant tumors, and infectious diseases, in which targeted modulation of T cell activation can restore immune homeostasis or strengthen protective immune responses.
%20maturation_.png)
Fig. 5 Flow cytometric analysis of dendritic cell (DC) maturation. Bone marrow-derived DCs from C57BL/6 mice were exposed to maturation stimuli, which significantly increased the expression of MHC II, CD80, CD40 and CD86. (The data are provided by Elabscience.)
_.png)
Fig. 6 Interaction between T cells and bone marrow-derived dendritic cells (BMDCs). CD8+ T cells were isolated from the splenocytes of C57BL/6 mice using EasySort™ Mouse CD8+T Cell Isolation Kit (cat. no. MIM003N). The purity of the isolated CD8+ T cells was verified by flow cytometry. Following CFSE labeling, CD8+ T cells were co‑cultured with mature BMDCs for 72 h in vitro, and the proliferation of CD8+ T cells was subsequently assessed. (The data are provided by Elabscience.)
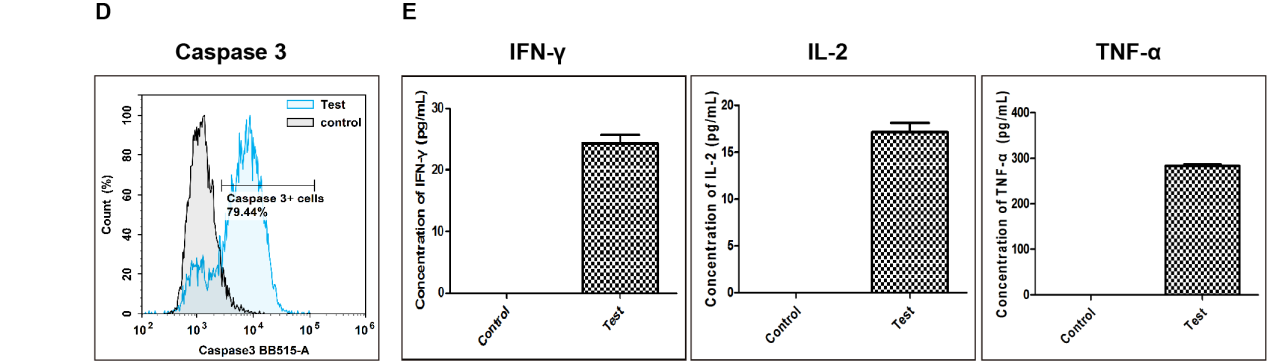
Fig. 7 Detection of apoptosis in target cells killed by CD8+ T cells. (D) After co‑culture of activated T cells with RAW264.7 target cells at a ratio of 1:10 for 24 h, caspase‑3 activity in target cells was measured by flow cytometry. Compared with the Control group (target cells cultured without activated T cells), the proportion of RAW264.7 cells with activated caspase‑3 increased to 79.44% in the co‑culture group (Test). (E) Cytokine levels in cell culture supernatants were measured by ELISA. Compared with the Control group, the levels of IFN‑γ, IL‑2, and TNF‑α were markedly increased in the co‑culture group (Test). (The data are provided by Elabscience.)
Elabscience® Quick Overview of Popular Products:
Table 7. Reagents for activation of T cells in vitro
|
Product Name |
Cat. No. |
|
EasySort™ Mouse CD8+T Cell Isolation Kit |
MIM003N |
|
EasySort™ Mouse CD3+T Cell Isolation Kit |
MIM001N |
|
EasySort™ Mouse CD4+T Cell Isolation Kit |
MIM002N |
|
EasySort™ Human CD3+T Cell Isolation Kit |
MIH001N |
|
EasySort™ Human CD4+ T Cell Isolation Kit |
MIH002N |
|
EasySort™ Human CD8+ T Cell Isolation Kit |
MIH003N |
|
EasySort™ Human Naïve Pan T Cell Isolation Kit |
MIH006N |
|
EasySort™ Human Naïve CD4+T Cell Isolation Kit |
MIH007N |
|
EasySort™ Human Naïve CD8+T Cell Isolation Kit |
MIH008N |
|
EasySort™ Mouse Pan-Naïve T Cell Isolation Kit |
MIM006N |
|
EasySort™ Mouse Naïve CD4+T Cell Isolation Kit |
MIM007N |
|
EasySort™ Mouse Naïve CD8+T Cell Isolation Kit |
MIM008N |
|
EasySort™-5 Magnet |
EC001 |
|
Mouse Bone Marrow-derived Dendritic Cells (BMDC) Induction and Identification Kit |
XJM003 |
|
FITC Anti-Mouse CD3 Antibody[17A2] |
E-AB-F1013C |
|
Elab Fluor® Violet 450 Anti-Mouse CD8a Antibody[53-6.7] |
E-AB-F1104Q |
|
Caspase 3/7 Activity Detection Substrate for Flow Cytometry |
E-CK-A483 |
|
Caspase 3/7 and Annexin V Double Staining Apoptosis Kit |
E-CK-A831 |
|
Caspase 1 Activity Detection Substrate for Flow Cytometry |
E-CK-A481 |
|
Reactive Oxygen Species (ROS) Fluorometric Assay Kit (Red) |
E-BC-F005 |
|
Lactate Dehydrogenase (LDH) Cytotoxicity Colorimetric Assay Kit |
E-BC-K771-M |
|
CellaQuant™ Mouse TNF-α (Tumor Necrosis Factor Alpha) ELISA Kit |
CQM002 |
|
CellaQuant™ Mouse IL-2 (Interleukin 2) ELISA Kit |
CQM006 |
|
CellaQuant™ Mouse IFN-γ (Interferon Gamma) ELISA Kit |
CQM005 |
05 Experimental Methods to Assess Helper T Cell Function In Vitro
CD4+ helper T cells possess multifaceted functional properties, whose biological outputs can be systematically quantified via six major readouts: proliferative capacity, cytokine secretion, auxiliary immune support including B cell assistance and macrophage activation, lineage polarization potential, and the immunosuppressive activity exerted by regulatory T cells (Tregs). Here’s the practical experimental methods to assess the function of CD4+ helper T cells[23,24].
5.1 Ex vivo immunophenotyping
Prior to implementing any functional assays, target lymphocytes are enriched with a commercial CD4+ T cell isolation kit, and subsequent ex vivo immunophenotyping is conducted to define the baseline subset composition of the total CD4+ T cell pool. Multiparametric flow cytometry is utilized to detect surface biomarkers including CD45RA, CC chemokine receptor 7 (CCR7), and C-X-C motif chemokine receptor 5 (CXCR5), which enables the segregation of naive, memory, and effector CD4+ T cell populations alongside markers indicative of cellular activation including CD25 and human leukocyte antigen DR (HLA-DR). Moreover, intracellular staining targeting lineage-specifying transcription factors including T-box expressed in T cells (T-bet), GATA binding protein 3 (GATA3), retinoid-related orphan nuclear receptor gamma t (RORγt), and forkhead box protein P3 (FoxP3) permits precise discrimination of Th1, Th2, Th17, Tfh, and Treg lineages within heterogeneous bulk samples. Customized Th1/Th2 flow cytometry staining kit and Th17 flow cytometry staining kit simplify standardized intracellular transcription factor labeling for parallel detection of Th1, Th2 and Th17 signature proteins in one panel. By establishing clear cellular identities upfront, this analytical step ensures that all subsequent functional measurements can be interpreted within an accurate cellular context[23,24].
5.2 T cell activation and proliferation assays
To quantify the antigen responsiveness of CD4+ helper T cells purified via CD4+ T cell isolation kit, two categories of stimuli are commonly applied for distinct analytical purposes. Polyclonal stimulants such as anti-CD3/anti-CD28 antibody cocktails are used to assess global reactivity across the entire T cell population, whereas antigen-specific stimulants such as tetanus toxoid serve to detect memory recall responses. Proliferative activity is quantified using two well-established approaches. The first relies on dye dilution systems including CFSE combined with flow cytometry to resolve discrete cell division cycles. The second adopts traditional radioactive thymidine incorporation. Collectively, these assays measure T cell replicative potential and viability, both of which are indispensable for mounting robust secondary immune responses upon re-exposure to cognate pathogens[25].
5.3 Cytokine secretion profiling
Cytokine quantification serves as a central analytical pillar for delineating the effector functions of CD4+ helper T cells enriched with CD4+ T cell isolation kit. Bulk detection platforms including enzyme-linked immunosorbent assay (ELISA) and multiplex arrays measure cumulative cytokine protein concentrations within culture supernatants. In contrast, single-cell-resolution methodologies including intracellular cytokine staining (ICS) and ELISpot further resolve the frequency of cytokine-producing lymphocytes and their polyfunctional profiles, such as concurrent production of interferon-gamma (IFN-γ), tumor necrosis factor-alpha (TNF-α), and interleukin-2 (IL-2). A key advantage of ICS lies in its capacity to couple immunophenotyping with cytokine detection. When combined with Th1/Th2 flow cytometry staining kit and Th17 flow cytometry staining kit, this technical feature bridges the analytical gap between effector cytokine secretion and the intrinsic identity of cytokine-expressing T cell subsets[26,27].
5.4 In vitro polarization of CD4⁺ T cell subsets
To dissect the differentiation plasticity and developmental trajectories of CD4+ T cells, naive CD45RA+ T cells are first separated using a CD4+ T cell isolation kit and cultured under tightly controlled polarizing culture conditions. Exogenous supplementation with tailored cytokine cocktails, paired with lineage-blocking neutralizing antibodies, directs naive T cells toward predefined effector or regulatory fates. Interleukin-12 (IL-12) drives Th1 differentiation, interleukin-4 (IL-4) primes Th2 cells, and combined transforming growth factor-beta (TGF-β) plus interleukin-6 (IL-6) induces Th17 lineage commitment. Following multi-day culture incubation, polarization efficiency is validated by detecting elevated expression of lineage-signature transcription factors and cytokines. Parallel staining with Th1/Th2 flow cytometry staining kit and Th17 flow cytometry staining kit enables rapid comparison of polarization efficiency across three major effector lineages. As such, this in vitro culture system provides a controllable experimental platform to dissect the molecular circuits governing CD4+ T cell fate determination[28,29].
5.5 Functional assays measuring T helper auxiliary activity
Aside from intrinsic autocrine signaling events, the core physiological role of helper T cells resides in their ability to modulate the function of other immune compartments. CD4+ lymphocytes purified using CD4+ T cell isolation kit are applied to build co-culture experimental systems for quantitative evaluation of this auxiliary helper activity. For Tfh-mediated B cell support, autologous Tfh–B cell co-cultures are assembled, and downstream endpoints including antibody class switching and plasma cell differentiation are measured via immunoglobulin ELISA or flow cytometry. In parallel, Th1-dependent macrophage activation is quantified by monitoring nitric oxide release or intracellular microbial clearance. Additionally, dynamic shifts in surface CD40 ligand (CD40L, CD154) expression constitute a critical readout for antigen-presenting cell (APC) licensing. Separately, Treg suppression assays independently quantify the inhibitory potency of regulatory subsets against the proliferative response of conventional responder T cells[30].
5.6 Early TCR proximal signaling and activation readouts
To capture immediate molecular cascades triggered by T cell receptor (TCR) crosslinking, dedicated assays focus on early proximal signaling events using CD4+ T cells pre-isolated with CD4+ T cell isolation kit. Phospho-flow cytometry enables single-cell simultaneous quantification of phosphorylated signaling intermediates including phosphorylated signal transducer and activator of transcription proteins (p-STATs), phosphorylated extracellular signal-regulated kinase (p-ERK), and phosphorylated zeta-chain-associated protein kinase 70 (p-ZAP70), thereby revealing lineage-biased signaling signatures. Representative examples include dominant STAT4 phosphorylation in Th1 cells and preferential STAT6 activation in Th2 cells. To complement phospho-signaling measurements, calcium flux detection and tracking of early surface activation markers including CD69 and CD25 deliver rapid readouts reflecting intact TCR signaling machinery and the magnitude of upstream antigenic stimulation[31].
5.7 High-dimensional omics and metabolic phenotyping
Cutting-edge single-cell transcriptomic and proteomic technologies, namely single-cell RNA sequencing (scRNA-seq) and cellular indexing of transcriptomes and epitopes by sequencing (CITE-seq), generate unbiased, high-resolution molecular profiles of CD4+ T cells harvested with CD4⁺T cell isolation kit and facilitate the discovery of uncharacterized subpopulations and core gene regulatory networks. When integrated with TCR sequencing datasets, these multi-omic tools further link subset-specific transcriptional signatures to unique T cell clonotypes. Beyond transcriptomic profiling, extracellular flux analysis enables comprehensive metabolic phenotyping to map subset-specific bioenergetic programs. Notably, Th17 cells predominantly engage glycolysis to sustain effector function, whereas Tregs rely on oxidative phosphorylation. These collective observations underscore an intimate, causative linkage between cellular metabolic reprogramming and the diverse immune functions of helper T cell subsets[32,33].
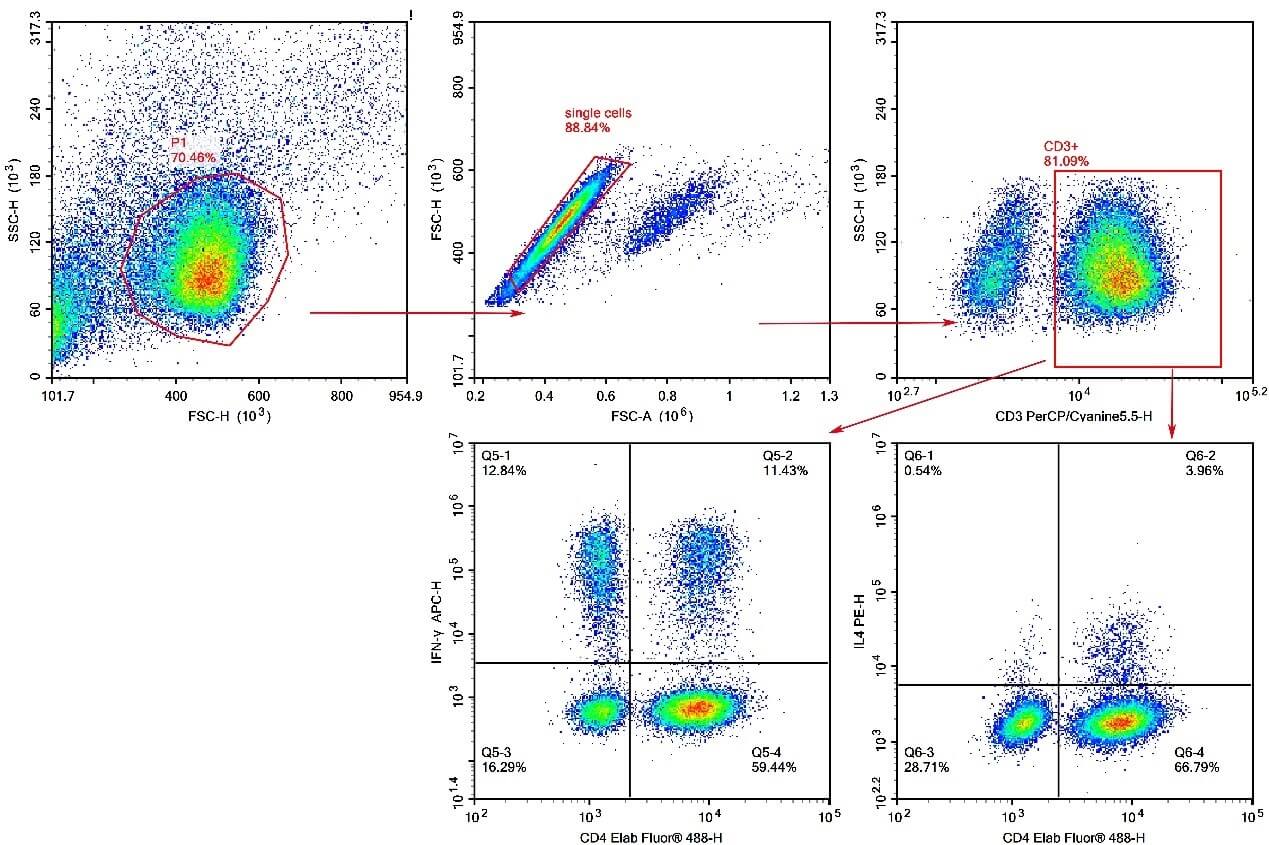
Fig. 8 Detection of Th1 and Th2 cell subsets in human peripheral blood mononuclear cells (PBMCs). PBMCs were stimulated with Cell Stimulation Mix and Protein Transport Inhibitor Mix for 5 hours, then harvested, fixed, and permeabilized. Subsequently, cells were stained with PerCP/Cyanine5.5 Anti-Human CD3, Elab Fluor® 488 Anti-Human CD4, PE Anti-Human IL-4 and APC Anti-Human IFN-γ to assess the proportions of Th1 and Th2 cells, as well as their capacity to produce the effector cytokines IFN-γ and IL-4, respectively. Th1 cells were identified as CD3+CD4+IFN-γ+, and Th2 cells as CD3+CD4+IL-4+. (The data are provided by Elabscience.)
Elabscience® Quick Overview of Popular Products:
Table 8. Multicolor Panel for Flow Cytometric Analysis of Human and Mouse Helper T cells (CD4+ T cells)
|
Marker |
Clone |
Fluorochrome |
Cat. No. |
Species Reactivity |
|
CD3 |
OKT-3 |
PerCP/Cyanine5.5 |
E-AB-F1001J |
Human |
|
CD4 |
SK3 |
Elab Fluor® 488 |
E-AB-F1352L |
Human |
|
IL-17A |
BL168 |
PE |
E-AB-F1173D |
Human |
|
IFN-γ |
B27 |
APC |
E-AB-F1196E |
Human |
|
IL-4 |
MP4-25D2 |
PE |
E-AB-F1203D |
Human |
|
CD3 |
17A2 |
PE/Cyanine5 |
E-AB-F1013G |
Mouse |
|
CD4 |
GK1.5 |
FITC |
E-AB-F1097C |
Mouse |
|
IFN-γ |
XMG1.2 |
APC |
E-AB-F1101E |
Mouse |
|
IL-4 |
11B11 |
PE |
E-AB-F1204D |
Mouse |
|
IL-17A |
17F3 |
PE |
E-AB-F1272D |
Mouse |
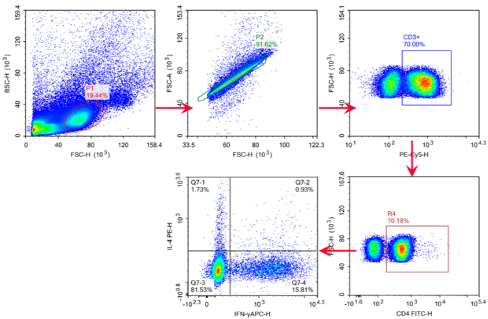
Fig. 9 Analysis of IFN-γ and IL-4 production in C57BL/6 mouse splenocytes. Splenocytes were treated with Cell Stimulation MIX and Protein Transport Inhibitor MIX for 5 hours, then were harvested, fixed, and permeabilized, followed by staining with PE/Cyanine5 Anti-Mouse CD3, FITC Anti-Mouse CD4, PE Anti-Mouse IL-4 and APC Anti-Mouse IFN-γ for analysis of the proportion of Th1/Th2 cells and their functional capacity to secrete the effector cytokine IFN-γor IL-4. Th1 cells were defined by the phenotype CD3+CD4+IFN-γ+, Th2 cells were defined by the phenotype CD3+CD4+IL-4+. (The data are provided by Elabscience.)
Elabscience® Quick Overview of Popular Products:
Table 9. Reagents for Th Cell cytokine secretion assays
|
Product Name |
Cat. No. |
|
Mouse Th17 Flow Cytometry Staining Kit |
XJM002 |
|
Mouse Th1/Th2 Flow Cytometry Staining Kit |
XJM001 |
|
Human Th1/Th2 Flow Cytometry Staining Kit |
XJH001 |
|
Human Th17 Flow Cytometry Staining Kit |
XJH002 |
|
Cell Staining Buffer |
E-CK-A107 |
|
Cell Stimulation and Protein Transport Inhibitor Kit |
E-CK-A091 |
|
Intracellular Fixation/Permeabilization Buffer Kit |
E-CK-A109 |
References:
[1] ZHU X, ZHU J. CD4 T Helper Cell Subsets and Related Human Immunological Disorders[J]. International Journal of Molecular Sciences, 2020, 21(21): 8011.
[2] CRATER J M, DUNN D C, NIXON D F, et al. A History and Atlas of the Human CD4+ T Helper Cell[J]. Biomedicines, 2023, 11(10): 2608.
[3] SPINNER C A, LAZAREVIC V. Transcriptional regulation of adaptive and innate lymphoid lineage specification[J]. Immunological Reviews, 2020, 300(1): 65-81.
[4] Nakayama T, Hirahara K, Onodera A, et al. Th2 cells in health and disease[J]. Annual review of immunology, 2017, 35: 53-84.
[5] Kaplan M H. Th9 cells: differentiation and disease[J]. Immunological reviews, 2013, 252(1): 104-115.
[6] Tesmer L A, Lundy S K, Sarkar S, et al. Th17 cells in human disease[J]. Immunological reviews, 2008, 223(1): 87-113.
[7] Crotty S. Follicular helper CD4 T cells (Tfh)[J]. Annual review of immunology, 2011, 29(1): 621-663.
[8] Raffin C, Vo L T, Bluestone J A. Treg cell-based therapies: challenges and perspectives[J]. Nature Reviews Immunology, 2020, 20(3): 158-172.
[9] Wingender G, Kronenberg M. OMIP-030: Characterization of human T cell subsets via surface markers[J]. Cytometry a, 2015, 87(12): 1067-9.
[10] Ross G D. Identification of human lymphocyte subpopulations by surface marker analysis[J]. Blood, 1979, 53(5): 799-811.
[11] Griffith J W, Sokol C L, Luster A D. Chemokines and chemokine receptors: positioning cells for host defense and immunity[J]. Annual review of immunology, 2014, 32(1): 659-702.
[12] McGuire H M, Vogelzang A, Ma C S, et al. A subset of interleukin-21+ chemokine receptor CCR9+ T helper cells target accessory organs of the digestive system in autoimmunity[J]. Immunity, 2011, 34(4): 602-615.
[13] DONG C. Cytokine Regulation and Function in T Cells[J]. Annual Review of Immunology, 2021, 39(1): 51-76.
[14] Street N E, Mosmann T R. Functional diversity of T lymphocytes due to secretion of different cytokine patterns[J]. The FASEB journal, 1991, 5(2): 171-177.
[15] Dong C. Cytokine regulation and function in T cells[J]. Annual review of immunology, 2021, 39(1): 51-76.
[16] Roche P A, Furuta K. The ins and outs of MHC class II-mediated antigen processing and presentation[J]. Nature Reviews Immunology, 2015, 15(4): 203-216.
[17] Eiz-Vesper B, Schmetzer H M. Antigen-presenting cells: potential of proven und new players in immune therapies[J]. Transfusion Medicine and Hemotherapy, 2020, 47(6): 429-431.
[18] Hua Z, Hou B. The role of B cell antigen presentation in the initiation of CD4+ T cell response[J]. Immunological reviews, 2020, 296(1): 24-35.
[19] Wilcox R A. A three‐signal model of T‐cell lymphoma pathogenesis[J]. American journal of hematology, 2016, 91(1): 113-122.
[20] Villadangos J A, Cardoso M, Steptoe R J, et al. MHC class II expression is regulated in dendritic cells independently of invariant chain degradation[J]. Immunity, 2001, 14(6): 739-749.
[21] André S, Tough D F, Lacroix-Desmazes S, et al. Surveillance of antigen-presenting cells by CD4+ CD25+ regulatory T cells in autoimmunity: immunopathogenesis and therapeutic implications[J]. The American journal of pathology, 2009, 174(5): 1575-1587.
[22] Leddy O, Ogongo P, Huffaker J, et al. Immunopeptidomics can inform the design of mRNA vaccines for the delivery of Mycobacterium tuberculosis MHC class II antigens[J]. Science translational medicine, 2025, 17(823): eadw9184.
[23] ZHU X, ZHU J. CD4 T Helper Cell Subsets and Related Human Immunological Disorders[J]. International Journal of Molecular Sciences, 2020, 21(21): 8011.
[24] Furuzawa-Carballeda J, Bostock I C, Lima G, et al. Immunophenotyping of peripheral immunoregulatory as well as Th17A and Th22 cell subpopulations in kidney transplant recipients under belatacept or cyclosporine treatment[J]. Transplant immunology, 2014, 30(2-3): 107-113.
[25] Mohammad I, Starskaia I, Nagy T, et al. Estrogen receptor α contributes to T cell–mediated autoimmune inflammation by promoting T cell activation and proliferation[J]. Science signaling, 2018, 11(526): eaap9415.
[26] Del Prete G F, De Carli M, Mastromauro C, et al. Purified protein derivative of Mycobacterium tuberculosis and excretory-secretory antigen (s) of Toxocara canis expand in vitro human T cells with stable and opposite (type 1 T helper or type 2 T helper) profile of cytokine production[J]. The Journal of clinical investigation, 1991, 88(1): 346-350.
[27] Anthony D D, Milkovich K A, Zhang W, et al. Dissecting the T cell response: proliferation assays vs. cytokine signatures by ELISPOT[J]. Cells, 2012, 1(2): 127-140.
[28] Van Panhuys N, Klauschen F, Germain R N. T-cell-receptor-dependent signal intensity dominantly controls CD4+ T cell polarization in vivo[J]. Immunity, 2014, 41(1): 63-74.
[29] Pianta S, Bonassi Signoroni P, Muradore I, et al. Amniotic membrane mesenchymal cells-derived factors skew T cell polarization toward Treg and downregulate Th1 and Th17 cells subsets[J]. Stem Cell Reviews and Reports, 2015, 11(3): 394-407.
[30] Kolenbrander A, Grewe B, Nemazee D, et al. Generation of T follicular helper cells in vitro: requirement for B‐cell receptor cross‐linking and cognate B‐and T‐cell interaction[J]. Immunology, 2018, 153(2): 214-224.
[31] Wurster A L, Tanaka T, Grusby M J. The biology of Stat4 and Stat6[J]. Oncogene, 2000, 19(21): 2577-2584.
[32] Mogilenko D A, Sergushichev A, Artyomov M N. Systems immunology approaches to metabolism[J]. Annual review of immunology, 2023, 41(1): 317-342.
[33] Matsui H, Cervantes M, Khalid M M, et al. Multi‐Omics Analysis of Human Blood Cells Reveals Unique Features of Age‐Associated Type 2 CD8 Memory T Cells[J]. Aging Cell, 2026, 25(2): e70393.

