

Spectral flow cytometry has transitioned from an emerging technique to a workhorse technology for high‑dimensional single‑cell analysis, with recent advances spanning hardware, reagents, computational algorithms, and clinical translation. The defining characteristic of this technology lies in its departure from the classical “one detector, one fluorophore” architecture: a prism or grating disperses the complete emission spectrum of each fluorochrome onto an array of highly sensitive detectors. Linear unmixing algorithms subsequently deconvolve the unique spectral signature of each fluorochrome, permitting simultaneous measurement of many more fluorochromes than is feasible with conventional filter‑based instruments.
This report synthesizes state‑of‑the‑art findings around six interrelated questions: how full‑spectrum detection extends the capabilities of multiparameter flow cytometry, how autofluorescence extraction improves spectral cytometry performance, how fluorophores should be selected for ultra‑high‑parameter panels, how single‑stained controls enhance spectral unmixing accuracy, how spectral cytometry enables deep immune phenotyping, and what the next generation of this technology will bring.
Table of Contents
1. How does full-spectrum detection expand multiparameter flow cytometry?
2. How can autofluorescence extraction improve spectral flow cytometry?
3. How should fluorophores be selected for ultra-high-parameter panels?
4. How can single-stained controls improve spectral unmixing accuracy?
5. How can spectral flow cytometry support deep immune phenotyping?
6. What will the next generation of spectral flow cytometry look like?
01 How does full-spectrum detection expand multiparameter flow cytometry?
The fundamental limitation of conventional flow cytometry lies in how it handles fluorescent signals. Understanding the shift to full-spectrum detection requires tracing the causal chain from photon collection through signal processing to the practical consequences for panel design.
1.1 The Core Problem: Spectral Overlap in Conventional Systems
In conventional fluorescence cytometry, each fluorophore is measured in a dedicated target detector through wide band-pass optical filters. Each filter captures only a narrow, peak-emission slice of a fluorophore’s total output. When two fluorophores have overlapping emission spectra, a portion of fluorophore A’s light inevitably “spills over” into fluorophore B’s detector. This spillover is corrected by a mathematical process called compensation, which subtracts the estimated bleed-through from each channel[1].
The critical consequence is this: compensation works by subtracting signal, which increases data variance (spread) and reduces resolution. As the number of fluorophores grows, pairwise spillover interactions multiply combinatorially, and the cumulative effect of compensation errors degrades data quality. This created a practical ceiling, with conventional fluorescence-based cytometry facing a technological barrier at around 30 parameters.
1.2 The Mechanistic Shift: From Peak Detection to Full-Spectrum Capture
Full-spectrum (spectral) flow cytometry resolves this bottleneck through a fundamentally different detection strategy operating at two levels: hardware and mathematics.
(1) Hardware: Dense Detector Arrays Replace Discrete Filters
Rather than assigning one detector per fluorophore, spectral cytometers use a large number of detectors with narrow band-pass filters to measure a fluorophore's signal across the entire emission spectrum, creating a detailed fluorescent signature, a “spectral fingerprint”, for each fluorophore. For example, the CytoFLEX system uses a 63-channel spectral detection module distributed across four lasers (V20, B16, Y12, R10). This dense sampling means the instrument collects not just the emission peak, but the complete shape of each fluorophore’s emission curve across all wavelengths[2].
(2) Mathematics: Spectral Unmixing Replaces Compensation
This is where the real analytical power emerges. Because the system now records the entire spectral shape for every fluorophore, it can employ spectral unmixing, a mathematical technique fundamentally more powerful than simple compensation. Each fluorophore’s complete spectral profile serves as a reference. The measured composite spectrum from a stained cell is modeled as a linear combination of these references. The unmixing algorithm then solves for the contribution (abundance) of each fluorophore, producing an unmixing matrix. Critically, the accuracy of this process depends on how well the algorithm reflects the underlying physics of signal formation[3].
This is superior to compensation. Compensation uses only peak-channel information, it sees fluorophores as single numbers and tries to subtract cross-talk. Spectral unmixing uses the entire shape of each spectrum. Two fluorophores with identical emission peaks but slightly different spectral profiles across other wavelengths become distinguishable, something impossible in conventional systems. This means fluorochromes with similar emission maxima but distinct off-peak signatures can coexist in the same panel.
1.3 How This Mechanism Expands Multiparameter Capacity
The spectral unmixing approach produces three cascading advantages that together dramatically increase the number of simultaneous parameters.
(1) Advantage 1: Fluorophore Discrimination Beyond Peak Overlap
Since full-spectrum detection distinguishes fluorophores by their complete spectral shape rather than emission peak alone, researchers can include multiple fluorophores that would be mutually exclusive in a conventional setup. This directly translates into more markers per panel[4]. Modern spectral systems can conservatively detect 35 or more antigens simultaneously in a single-tube assay, with 5-laser instruments enabling 40 parameters or more. Recent work has achieved 24-color, 29-color, 30-color, and even 31-color panels on standard 3-laser instruments. The field anticipates the potential for 100 simultaneous parameter analyses within a few years[5-7].
(2) Advantage 2: Autofluorescence as a Measurable Component
Autofluorescence, the intrinsic fluorescence emitted by cellular contents such as structural proteins, organelles, and metabolites, has traditionally been a confounding noise source that limits sensitivity, especially in tissue-derived samples. In conventional cytometry, autofluorescence reduces antigen and population resolution and creates false positive events[8].
Full-spectrum cytometry transforms this problem into an advantage. Because it captures the complete emission spectrum, the autofluorescence signal of unstained cells can be characterized as its own unique spectral component, then mathematically separated from fluorophore signals during unmixing. Full spectral cytometers can identify and unmix autofluorescence much better than conventional cytometers. This effectively reclaims detection channels that would otherwise be contaminated, enabling analysis of highly autofluorescent tissues such as regenerating skeletal muscle[8].
(3) Advantage 3: Greater Panel Design Flexibility
The net effect of better fluorophore discrimination and autofluorescence handling is substantially more flexible panel design. Researchers are no longer constrained by strict rules about which fluorophore goes on which detector, and fluorophore families can be expanded even on instruments with fewer lasers (Principles of flow cytometry fluorophore selection). This flexibility is particularly important given the limited availability of human specimens, where there is increasing demand to analyze as many markers as possible simultaneously in one panel[5].
Table 1. Comparison of traditional flow cytometry and full-spectrum flow cytometry
|
Feature |
Conventional Flow Cytometry |
Full-Spectrum Flow Cytometry |
|
Detection |
One filter/detector per fluorophore |
Dense array captures full spectrum |
|
Signal separation |
Compensation (peak subtraction) |
Spectral unmixing (shape decomposition) |
|
Overlapping fluorophores |
Must be avoided or minimized |
Tolerated if spectral shapes differ |
|
Autofluorescence |
Confounding noise |
Modeled as independent component |
|
Practical parameter limit |
~30 |
35-40+ routinely |
02 How can autofluorescence extraction improve spectral flow cytometry?
Autofluorescence (AF), the intrinsic fluorescence emitted by endogenous cellular molecules such as structural proteins (collagen, elastin), organelles, and metabolites (NADH, FAD, aromatic amino acids), has long been one of the most persistent obstacles in flow cytometry. Understanding why AF extraction works requires tracing the problem from its physical origin through to the mathematical solution that full-spectrum systems enable[9].
When a laser excites a cell, it simultaneously excites both the exogenous fluorophores (flow cytometry antibodies) and the cell's endogenous fluorescent molecules. These endogenous molecules emit broadband fluorescence, typically spanning the 400–600 nm range, that overlaps with the emission of many commonly used fluorophores[10].
In conventional flow cytometry, each detector captures a single band-pass window of light. The instrument has no way to distinguish whether photons landing on a given detector came from a fluorophore or from the cell's own AF. The result is a direct, measurable consequence: AF raises background signal, reduces the separation between positive and negative populations, and generates false-positive events. Conventional cytometry simply cannot correct for cellular AF.
This problem is not uniform. Different cell types contain different concentrations and compositions of endogenous fluorophores, producing heterogeneous AF spectra. Macrophages, for example, are among the most autofluorescent immune cells, emitting fluorescence across the entire light spectrum. Tissues like lung and liver are particularly challenging because they contain multiple cell populations with distinct AF properties[10].
How full-spectrum detection enables AF, the key insight is that AF, like any fluorescent signal, has a characteristic spectral shape. In a conventional system with one detector per fluorophore, this shape is invisible, you see only a single intensity value per channel. Full-spectrum cytometry changes this fundamentally.
Step 1: Capture the complete AF signature
A spectral cytometer uses dense arrays of narrow-bandpass detectors to record fluorescence intensity across the full emission wavelength range. When you run an unstained control sample through the instrument, the detectors collectively capture the AF emission profile of your cells, not just a single intensity, but the entire spectral shape of the endogenous fluorescence[11].
Step 2: Treat AF as an independent spectral component
This is the critical conceptual leap. Rather than viewing AF as noise to be ignored or subtracted crudely, the system treats it as just another “fluorochrome”, one with its own unique reference spectrum. The AF spectrum is added to the reference library alongside the spectra of all the exogenous fluorophores in your panel[12].
Step 3: Mathematically unmix AF from fluorophore signals
During spectral unmixing, the algorithm decomposes each cell's measured composite spectrum into contributions from every reference component, including AF. Because AF has a spectrally distinct shape from the dyes, the unmixing process can estimate how much of the total signal at every wavelength came from AF versus from each fluorophore, then subtract the AF contribution specifically[13].
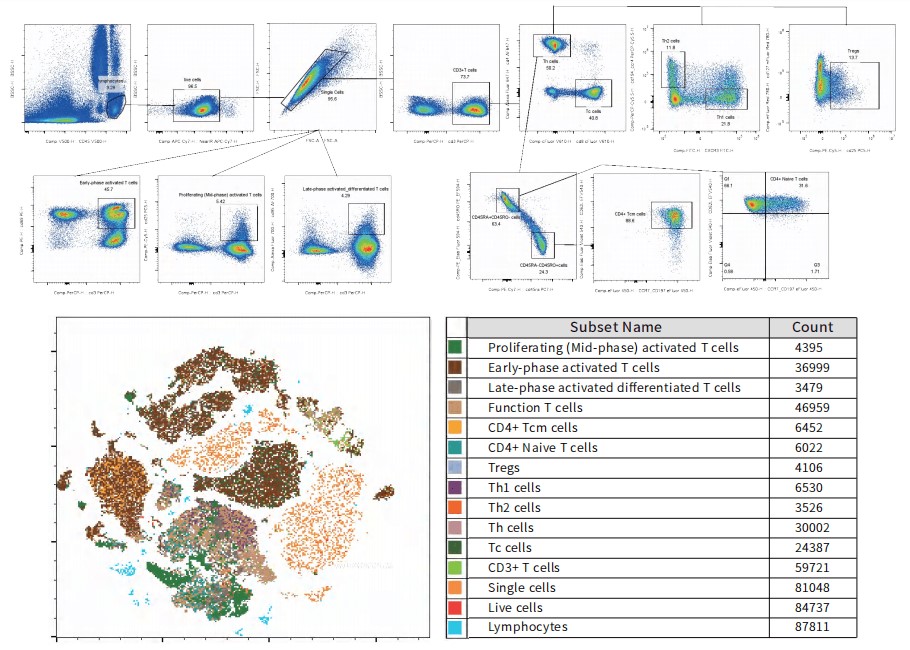
Fig. 1 16-color full-spectrum analysis of T cells in human peripheral blood. A spectral flow cytometer (Agilent Novocyte Opteon VBRY) was used to detect T cell subsets in human peripheral blood, and the results were analyzed using FLOWJO software. (The data are provided by Elabscience®)
Elabscience® Quick Overview of Popular Products:
Table 2. Flow cytometry antibody panel summary for 16-Color full-spectrum profiling of human peripheral blood T cells
|
Marker |
Clone |
Fluorochrome |
Cat. No. |
|
CD3 |
OKT-3 |
Percp |
E-AB-F1001F |
|
CD4 |
SK3 |
Elab Fluor® 647 |
E-AB-F1352M |
|
CD8 |
OKT-8 |
Elab Fluor® Violet 610 |
E-AB-F1110T |
|
CD25 |
BC96 |
PE/Cyanine5 |
E-AB-F1194G |
|
CD28 |
CD28.2 |
APC |
E-AB-F1195E |
|
CD45 |
HI30 |
Elab Fluor® Violet 500 |
E-AB-F1137R |
|
CD45RA |
HI100 |
PE/Cyanine7 |
E-AB-F1052H |
|
CD45RO |
UCHL1 |
PE/Elab Fluor® 594 |
E-AB-F1139P |
|
CD62L |
DREG56 |
Elab Fluor® Violet 540 |
E-AB-F1051T3 |
|
CD69 |
FN50 |
PE |
E-AB-F1138D |
|
CD95 |
DX2 |
Elab Fluor® 700 |
E-AB-F1168M1 |
|
CD127 |
A019D5 |
Elab Fluor® Red 780 |
E-AB-F1152S |
|
CD183/CXCR3 |
G025H7 |
FITC |
E-AB-F1156C |
|
CD194/CCR4 |
L291H4 |
PerCP/Cyanine5.5 |
E-AB-F1366J |
|
CD197/CCR7 |
G043H7 |
Elab Fluor® Violet 450 |
E-AB-F1159Q |
|
Live/Dead |
/ |
STYXTM Near-IR |
E-CK-A168 |
03 How should fluorophores be selected for ultra-high-parameter panels?
Selecting fluorophores for ultra-high-parameter panels (35–50+ colors) is fundamentally a constraint-satisfaction problem: you must fill every available detector channel while keeping the cumulative signal degradation from spectral overlap below the threshold where biological populations become unresolvable. The hierarchy of fluorochrome selection rules are below.
(1) Maximize spectral distinctiveness across the full emission profile
The most important selection criterion is that each fluorochrome in the panel must have a maximally unique spectral fingerprint across all detectors, not merely a unique emission peak. Spectral flow cytometry distinguishes fluorophores by their complete emission profile across all lasers, so fluorophores with similar emission maxima but distinct off-peak signatures can coexist in the same panel. Conversely, two dyes that appear to have different peak channels but whose overall spectral shapes are nearly collinear will produce severe UDS regardless of peak separation.
This is quantified in practice using a similarity index, a metric that captures the degree of spectral collinearity between any pair of fluorochromes. One conservative design strategy is to keep pairwise similarity indices below 0.85, though higher overlaps can still yield high-quality data when other best practices are rigorously applied[14].
(2) Match fluorochrome brightness to antigen abundance
This is the oldest rule in flow cytometry panel design, but its mechanistic justification becomes even more critical at ultra-high parameters. The brightest fluorochromes must be paired with the lowest-abundance antigens, because dim signals are the first casualties of spreading error. In conventional cytometry, SSE from a bright dye's variance is proportional to the square of the spillover coefficient, meaning bright dyes have a disproportionately destructive effect on neighboring channels. In spectral cytometry the mechanism shifts to UDS, but the practical consequence is the same: a weakly expressed marker paired with a dim fluorochrome and placed spectrally near a bright, abundant marker will be obliterated by spreading.
(3) Distribute fluorochromes across laser excitation lines
Each laser excites a subset of the total fluorochrome repertoire. By distributing fluorochromes so that each laser excites a manageable number, you reduce the local collinearity within each laser's spectral subspace. A 5-laser instrument therefore has inherently more spectral “room” than a 3-laser system. However, cross-laser excitation, where a fluorochrome intended for one laser is also excited by another, introduces additional spectral complexity that must be accounted for in the unmixing matrix[15].
(4) Exploit novel fluorochrome families purpose-built for spectral separation
Panel sizes exceeding 35 colors have become feasible not only through improved instrumentation and algorithms, but also via the development of novel fluorochrome families purpose-built to fill spectral gaps. Likewise, the repertoire of functional fluorescent dyes has expanded exponentially. Selection of these newer dyes, which are engineered for high brightness, photostability, and distinct spectral signatures, directly mitigates collinearity[16].
(5) Account for co-expression biology in fluorochrome assignment
The selection problem is not purely spectral, it is also biological. Two fluorochromes with moderate spectral overlap may cause no practical problem if the antigens they label are never co-expressed on the same cell. Conversely, even moderate overlap between fluorochromes labeling co-expressed markers can make it impossible to resolve the double-positive population. Effective panels require the researcher to map antigen co-expression patterns and then assign spectrally similar fluorochromes to mutually exclusive markers. One practical implementation is to use pairs of mutually exclusive markers assigned to a single fluorescent parameter, as demonstrated in a 40-parameter panel where this strategy simplified setup and ensured robust data[16].
(6) Validate reference controls rigorously
The entire unmixing process depends on how accurately the reference spectra represent the fluorochromes as they behave in the actual experimental sample. Full-spectrum cytometry takes into account even minor differences in spectral signatures, requiring the full spectrum of each fluorochrome to be identical in the reference control and the fully stained sample. When reference and sample spectra diverge, due to using compensation beads that shift spectral profiles relative to cells, or due to tandem dye degradation, unmixing errors propagate across every channel in the panel. Combinatorial titration approaches can streamline this optimization for large panels without compromising data quality[17].
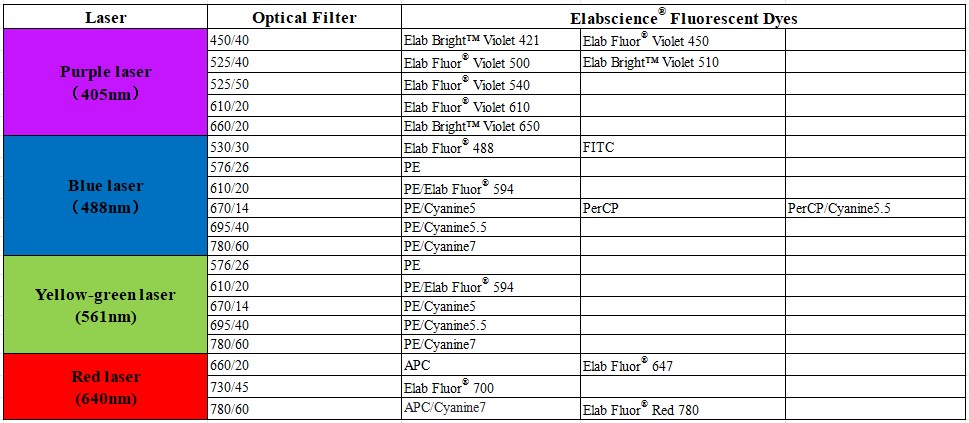
Fig. 2 Comparison of filter distributions of Elabscience® fluorescent dyes. Elabscience® offers its proprietary Elab Fluor® series of fluorescent dyes, with a spectral range covering the ultraviolet to infrared spectrum. The series comprises a total of 21 dyes, including multiple fluorescent groups such as Elab Fluor® Violet 450, and is compatible with flow cytometers using lasers at 405 nm, 488 nm, 633 nm, and other wavelengths. The company’s proprietary third-generation non-destructive labeling process, which has undergone iterative upgrades, maximizes the preservation of the antibody’s natural structure and biological function. This ensures that labeled antibodies can still efficiently and specifically recognize target antigens, providing robust support for high-parameter spectral flow cytometry assays with 10–21 colors.
04 How can single-stained controls improve spectral unmixing accuracy?
The accuracy of spectral unmixing, the mathematical decomposition of a cell's composite emission into individual fluorochrome contributions, is entirely dependent on how well the reference spectra represent the actual fluorochrome behavior in the experimental sample. Single-stained controls are the source of these reference spectra, and understanding why their quality is so consequential requires tracing the unmixing process from its mathematical foundation.
Spectral flow cytometry captures the full emission spectrum of every fluorochrome on each cell using multiple detectors. The unmixing algorithm then models the measured composite spectrum as a linear combination of reference spectra, one per fluorochrome, and solves for the abundance (contribution) of each. This is formally a system of linear equations: if the reference matrix R contains the spectral profiles, and y is the measured spectrum of a cell, the algorithm solves for the abundance vector x such that y≈Rx[18].
The critical consequence is this: the solution x is only as good as R. If any reference spectrum in R deviates from the true spectral behavior of its fluorochrome in the fully stained sample, the algorithm will misattribute photons, assigning signal from one fluorochrome to another, or distributing noise unevenly across channels. Achieving accurate results necessitates a good reference control and an understanding of the unmixing algorithm used by the software[18].
In full-spectrum flow cytometry, the accuracy of the algorithm depends on the quality of the single-stain reference spectra, and this reference quality is propagated layer by layer through the deconvolution matrix to the final results for each cell. The core mechanism is reflected in four aspects:
4.1 Full-spectrum fidelity, the full shape must match, not just the peak
The algorithm relies on the complete spectral shape of the fluorophore across the entire detector array and all laser lines (rather than a single peak), using subtle differences in the off-peak regions in particular as the key to distinguishing between spectrally similar fluorophores. Therefore, the reference spectrum must be completely consistent with the fully stained sample in terms of peak and off-peak morphology; any deviation will weaken the algorithm’s resolution capability[19].
(1) The carrier effect, beads versus cells
Carrier effects, compensating for differences in the local chemical and optical environments of the microspheres and cells (surface material, polymer matrix, absence of autofluorescence) can cause shifts in the reference spectrum. Therefore, the ideal approach is to generate the reference using the target cells; however, when marker expression is insufficient, microspheres can provide a stable, consistent, and strong signal. The trade-off principle lies in the fact that deconvolution error is proportional to the spectral mismatch between the reference and the sample: fluorophores that are insensitive to the carrier (such as small-molecule dyes) can use microspheres, while those sensitive to the carrier (such as taggable dyes or polymeric dyes) must use cells[19].
4.2 Signal intensity, the reference must be bright enough
Signal intensity, if the reference is too faint, spectral noise from the detector will be introduced; this noise is then spread across all cell results via the deblending matrix, so the reference must provide a strong and well-resolved positive signal[19].
4.3 Lot and reagent identity, even minor chemical variation matters
Reagent uniformity, the high specificity required for full-spectrum detection demands that single-stain controls and samples use the same antibody clone (flow cytometry antibodies), the same conjugate, and even the same batch, because manufacturing variations (dye-to-protein ratio, tandem conjugation efficiency, polymer composition) are averaged out by broadband filters in conventional flow cytometry but are resolved and amplified by the high-density detectors in full-spectrum systems, thereby causing systematic deconvolution errors across the entire panel[20].
In conclusion, why control quality matters more in large panels, the chain of causation is:
(1) Spectral unmixing requires a reference matrix whose columns are the spectral profiles of each fluorochrome.
(2) Any mismatch between reference and true sample spectra, due to carrier effects, lot variation, insufficient signal, or sample preparation differences, introduces systematic error into the unmixed abundances.
(3) Full-spectrum detection amplifies sensitivity to mismatch because it measures the complete spectral shape, not just the peak, making it simultaneously more powerful and more demanding than conventional compensation.
(4) In large panels, reference errors compound through increased spectral collinearity, amplifying UDS and degrading resolution for dim markers most.
(5) Single-stained controls improve accuracy to the exact degree that they faithfully reproduce the spectral behavior of each fluorochrome as it exists in the fully stained experimental sample.
05 How can spectral flow cytometry support deep immune phenotyping?
Spectral flow cytometry leverages full-spectrum fluorescence signal recognition technology to address the parameter and compensation limitations inherent to conventional flow cytometry. This technology allows simultaneous detection of dozens of markers in a single tube and markedly reduces spectral spillover. Even with limited sample input, it can precisely resolve fine subpopulations of T cells, B cells, and NK cells, while concurrently assessing functional states including cellular differentiation, activation, and exhaustion. With high sensitivity for rare immune subsets, spectral flow cytometry delivers a high-dimensional, high-resolution, and efficient detection platform for deep immune phenotyping.
A representative flagship application is the optimized 50-color panel reported by Konecny et al. Designed to maximize information retrieval from human blood and tissue samples on existing instruments, this panel incorporates lineage markers covering all major immune populations alongside an extensive set of phenotypic markers that characterize activation and differentiation states of T cells and dendritic cells. Notably, the panel is engineered to be compatible with cell sorting to support downstream functional assays[21].
A summary of deep immune phenotyping and its applications in T cell, B cell, and NK cell research is presented below.
5.1 T cell phenotyping at unprecedented depth
“Deep T cell phenotyping” refers to the comprehensive, multi-layered characterization of T cells, extending from conventional lineage-level classification (e.g., CD4/CD8 subsets) to the integration of high-dimensional protein expression, transcriptional status, TCR clonality and antigen specificity, epigenetic features, and spatial organization. T cell phenotyping is arguably the most intensively served application within the spectral ecosystem.
When designing panels for deep T cell phenotyping, the assignment of fluorochromes (or metal isotopes) should follow well-established empirical guidelines based on antigen expression levels. Specifically, low-abundance antigens (e.g., CXCR5, PD-1, FoxP3, and TCR chains) should be paired with the brightest fluorochromes/metal isotopes to maximize signal resolution; highly expressed antigens (e.g., CD3, CD8, and CD45) can be assigned fluorochromes of moderate brightness; and co-expressed markers should be paired with fluorochromes exhibiting minimal spectral overlap (spillover) with one another[22-24].
The summary of the key dimensions for deep T-cell phenotyping is as shown in the following table[22-24].
Table 3. Summary of key dimensions for deep T-cell phenotyping
|
Dimension |
Markers / Parameters |
Biological Significance / Applications |
|
Lineage and segregation |
CD3, CD4, CD8, TCRαβ/γδ, TRDV/TRGV (Vδ1/Vδ2), CD45 |
Define T cell lineage (αβ/γδ, CD4⁺/CD8⁺) and basic segregation |
|
Differentiation and memory |
CD45RA/RO, CCR7, CD27, CD28, CD127 (IL7R), CD62L; CD57, KLRG1, TIGIT |
Deduce Naive/Tcm/Tem/Temra subsets; CD57/KLRG1/TIGIT indicate terminal senescence / differentiation status |
|
Activation/Function |
CD69, CD25, HLA-DR, CD38, ICOS, OX40, 4-1BB; intracellular IFN-γ, IL-2, TNF, IL-17, Granzyme B, Perforin |
Assess activation status, costimulatory molecule expression, and effector functions (cytokine secretion, cytotoxicity) |
|
Regulatory and follicular |
FoxP3⁺CD25ʰⁱCD127ˡᵒ (Treg); CXCR5⁺PD-1⁺ICOS⁺Bcl6⁺ (Tfh); Bcl6/Blimp1 transcriptional layer |
Identify regulatory T cells (Tregs) and follicular helper T cells (Tfh); transcription factors aid confirmation |
|
Exhaustion/Inhibition (core in cancer/chronic infection) |
PD-1, TIM-3, LAG-3, TIGIT, CTLA-4, CD39, CD101, ENTPD1; transcriptional exhaustion score (TOX, NR4A, LAYN, HAVCR2) |
Evaluate T cell exhaustion state and inhibitory receptor expression; combine with transcriptional features for improved accuracy |
|
Tissue residency/migration |
CD69⁺CD103⁺ (TRM), CXCR3, CCR4, CCR5, CCR6, CX3CR1, S1PR1; for tissue samples add stromal/epithelial neighborhood markers |
Identify tissue-resident memory T cells (TRM) and chemokine receptor repertoire; analyze tissue homing and localization |
|
Clonality and antigen |
TCRα/β CDR3, paired chains; MHC multimers / dCODE (known epitopes); peptide pool stimulation + multi-omics (unknown) |
Track clonal expansion, antigen specificity, and TCR pairing; link clonality to functional states |
|
Epigenetics/Signaling |
scATAC at TCF1/TOX/BATF loci; CyTOF phosphoproteins (p-STAT, p-ERK, p-AKT, p-S6) |
Dissect chromatin accessibility (regulatory programs) and intracellular signaling pathway activation potential |
Full-spectrum flow cytometry capitalizes on the technical strengths of full-coverage fluorescence spectral analysis to simultaneously detect 30–50 fluorescently labeled markers in a single tube. This capability obviates the need for repetitive multi-tube testing and enables one-stop comprehensive profiling of T cell landscapes, including lineage identification markers, memory, effector, and regulatory T cell subpopulations, immune checkpoint molecules, chemokine receptors, and functional cellular proteins. By effectively mitigating cellular autofluorescence interference, this technology markedly improves the detection accuracy of rare T cell subpopulations and populations with low-marker expression. Requiring only a minimal sample volume, it supports in-depth phenotypic analysis that covers the full spectrum of T cell differentiation stages and functional states. Overall, full-spectrum flow cytometry provides a powerful high-dimensional immunophenotyping solution for research on infectious immunity, tumor immunity, and autoimmune diseases, substantially outperforming conventional flow cytometry platforms.
5.2 B cell phenotyping across differentiation stages
B cell differentiation is a tightly regulated, continuous process that originates from bone marrow hematopoietic stem cells and culminates in terminally differentiated plasma cells in peripheral tissues, with each developmental stage characterized by a unique surface marker signature. In the bone marrow, early B cell precursors sequentially transit through pro-B, pre-B-I, and pre-B-II stages. This developmental progression is driven by core transcription factors including EBF1 and Pax5, and is governed by critical quality-control checkpoints, most notably the pre-BCR checkpoint, accompanied by dynamic alterations in the expression of CD34, CD10, CD19, and cytoplasmic/surface immunoglobulins. Following maturation in the bone marrow, immature B cells egress into the periphery as transitional B cells (CD24hiCD38hi), which serve as a transitional population linking bone marrow and peripheral B cell maturation. This subset comprises functionally distinct subpopulations, including IL-10-producing regulatory B cells.
In peripheral circulation and tissues, mature B cells are conventionally classified into four major subsets based on canonical marker profiles: naïve B cells (IgD+CD27-), non-switched memory B cells (IgD+CD27+), switched memory B cells (IgD-CD27+), and double-negative B cells (IgD-CD27-). Emerging high-parameter immunophenotyping studies have further refined this classification framework by incorporating additional markers such as CD21, CD11c, and CD45RB to resolve subtle B cell subpopulations. A minimal six-marker antibody (flow cytometry antibodies) backbone panel targeting CD38, CD27, CD10, CD19, CD5, and CD45 enables comprehensive identification of nearly all B cell subsets across the entire differentiation spectrum in a single-tube assay. Upon antigen stimulation, peripheral mature B cells are activated, migrate into germinal centers, and ultimately differentiate into antibody-secreting plasmablasts (CD27hiCD38hiCD20-) and long-lived plasma cells. This terminal differentiation process relies on extensive epigenetic remodeling and transcriptional reprogramming[25-28].
The phenotypic characteristics of B cells at distinct differentiation stages are summarized in the table below[25-28].
Table 4. Summary of B cell phenotyping across differentiation stages
|
Stage |
Location |
Key Surface Markers |
Key Features |
|
Pro-B |
Bone marrow |
CD34+ CD19+ CD10+ sIgM− |
IGH D-J rearrangement begins |
|
Pre-B-I |
Bone marrow |
CD34+/dim CD19+ CD10+ cyIgM− |
IGH V-DJ rearrangement; pre-BCR checkpoint |
|
Pre-B-II |
Bone marrow |
CD34− CD19+ CD10+ cyIgμ+ |
Light chain rearrangement; clonal expansion |
|
Immature B |
Bone marrow |
CD19+ CD10+ sIgM+ IgD− |
Central tolerance selection |
|
Transitional |
BM → periphery |
CD24hi CD38hi CD10+/− |
Bridge to peripheral maturation; contains regulatory subsets |
|
Naïve mature |
Periphery |
IgD+ CD27− CD38int |
Antigen-inexperienced; awaits activation |
|
Non-switched memory |
Periphery |
IgD+ CD27+ |
Marginal zone-like; T-independent responses |
|
Switched memory |
Periphery |
IgD− CD27+ |
Class-switched; affinity-matured |
|
Double-negative |
Periphery |
IgD− CD27− |
Heterogeneous; expands with age |
|
Plasmablast / Plasma cell |
Periphery / BM |
CD27hi CD38hi CD20− CD138+/− |
Active antibody secretion |
Spectral flow cytometry utilizes its core technical advantages of full-spectrum fluorescence acquisition and intelligent spectral deconvolution to achieve comprehensive and precise phenotypic profiling of B cells across all differentiation stages. This approach circumvents the inherent parameter and compensation limitations of conventional flow cytometry, enabling the simultaneous detection of dozens of surface and intracellular markers within a single tube. Eliminating the need for multi-tube repeated testing, it allows the full tracing of the entire B cell differentiation cascade in one single assay run, covering bone marrow-resident early B progenitors and pre-B and immature B cells, peripheral circulating naive and transitional B cells, as well as terminal germinal center B cells, memory B cells, and plasma cells.
This platform clearly delineates the dynamic expression gradients of key markers including CD19, CD20, CD38, and CD27 across distinct developmental stages, while accurately resolving functionally specialized B cell subpopulations such as follicular B cells, marginal zone B cells, and B1 cells. By substantially minimizing fluorescence crosstalk and autofluorescence interference, spectral flow cytometry supports seamless, in-depth phenotypic analysis of the entire B cell developmental trajectory with minimal sample input. Collectively, it provides a high-dimensional, high-resolution technical foundation for investigating B cell developmental mechanisms, monitoring minimal residual disease in hematological malignancies, and evaluating immune status in autoimmune disorders.
5.3 NK cell phenotype: from blood to tissue
Human NK cells in the blood are conventionally divided into two major subsets, CD56dimCD16+ (cytotoxic, ~90% of blood NK) and CD56brightCD16− (cytokine-producing, ~10%), but this binary framework vastly underestimates their true diversity, as CD56bright cells are actually the dominant population in most non-lymphoid tissues. Upon entering tissue niches, circulating NK cells acquire residency traits through microenvironment-driven mechanisms: upregulation of CD69 (which antagonizes S1PR1-mediated egress), expression of tissue-anchoring integrins such as CD49a and CD103, and engagement of chemokine axes like CXCR6-CXCL16 and CCR5-CCL3/5 . These tissue-resident NK (trNK) cells display organ-specific phenotypic and functional signatures. For example, liver trNK cells are characterized by CD69+CXCR6+ expression with upregulated CD160, adipose tissue trNK cells by a distinctive CD26+CCR5+CD63+ cluster , and adaptive-like NK expansions with tissue-resident traits have been identified in ~20% of individuals in the lung. Importantly, recent evidence indicates that CD56bright NK cells establish transient tissue residency and can recirculate via lymphatic egress, suggesting a dynamic cycling model rather than permanent commitment. This tissue-driven remodeling extends to pathological contexts: in pancreatic cancer, peripheral NK cells adopt a CD16hiCD57hi phenotype with marked NKG2D downregulation, reduced cytotoxicity, and a shift toward IL-10 production[29-31].
The phenotypic characteristics of NK cells at different tissues are summarized in the table below[29-31].
Table 5. Summary of NK cell phenotypic profiles across blood and tissues (flow cytometry antibodies)
|
Compartment |
Dominant Subset |
Key Residency / Phenotypic Markers |
Functional Profile |
|
Peripheral blood |
CD56dimCD16+ |
S1PR1+, KLF2+, CD62L+(circulating) |
Cytotoxicity, ADCC |
|
Liver |
CD56brightCD16− |
CD69+, CXCR6+, CD160+ |
Immune surveillance, tolerance |
|
Lung |
CD56bright / adaptive-like |
CD49a+, CD103+, CD69+ |
Antiviral defense |
|
Adipose tissue |
CD56bright |
CD26+, CCR5+, CD63+ |
Inflammation regulation |
|
Bone marrow |
CD56bright |
CD69+, CXCR6+ |
Immune surveillance |
|
Tumor (e.g., PDAC) |
CD56dimCD16hi |
CD57+, NKG2D (downregulation) |
Impaired cytotoxicity, IL-10 production |
Spectral flow cytometry allows a single tube to simultaneously detect NK cell lineage markers, differentiation stage molecules, cytotoxic function markers, tissue-residence-related markers, and exhaustion-related indicators. Without the need for repeated testing across multiple tubes, it can comprehensively analyze circulating NK cells in peripheral blood, as well as the phenotypic differences of NK cells residing in various tissues such as the liver, spleen/lung/intestine, and clearly distinguish the distribution characteristics of the CD56dimCD16hi cytotoxic subpopulation and the CD56brightCD16lo immunoregulatory subpopulation, accurately identifies the unique phenotypic characteristics of tissue-resident NK cells, and significantly reduces interference from fluorescence crosstalk and autofluorescence. Even with limited cell samples obtained after tissue isolation, it reliably performs comprehensive, in-depth phenotypic analysis of NK cells from blood to multiple tissues, providing high-dimensional, high-resolution technical support for research into NK cell development and migration patterns, monitoring the efficacy of cell therapy, and evaluating NK cell function in tumor and infection immunity.
06 What will the next generation of spectral flow cytometry look like?
The trajectory of spectral flow cytometry is now legible across several converging lines of evidence from the past few years, and what emerges is not a single “next generation” instrument but a transformation in what the technology is, from a fluorescence measurement device into a multimodal, computationally intelligent single-cell analysis platform.
The field has entered what J. Paul Robinson terms the “diamond age” of cytometry, an era of exceptional sensitivity, resolution, and analytical depth driven by spectral flow cytometry innovations[32]. This framing is significant because it signals that the community sees the transition from conventional to spectral cytometry not as an incremental upgrade but as the most significant change in nearly half a century of flow cytometry[33]. Four key trajectories underpin this technological revolution, as outlined below.
6.1 Breaking the Parameter Ceiling: From 40 Colors Toward 50+ and Beyond
The most immediate frontier is raw parameter capacity. Current instrumentation already supports panels of 40 or more markers per sample[34], and recent demonstrations include optimized 27-color panels on just 3-laser instruments that simultaneously resolve 16 distinct cell subsets across lymphoid and myeloid lineages, applied across eight different tissue types[35]. The advance here is not merely adding colors; it is making high-parameter panels routine and portable across tissues, which was previously impractical.
However, scaling beyond ~50 colors confronts a fundamental mathematical barrier: unmixing-dependent spreading (UDS) arising from spectral collinearity progressively degrades signal-to-noise ratios as fluorochrome combinations multiply. Current spread-prediction tools and design strategies are increasingly inadequate for this ultra-high-color frontier, meaning the next generation will require fundamentally new computational approaches to panel optimization, not just better dyes or more detectors[36].
One creative workaround already demonstrated is multi-pass flow cytometry: rather than cramming all markers into a single measurement, cells are barcoded with near-infrared-emitting microparticles, allowing the same cells to be tracked and re-measured across multiple cycles, achieving a 32-marker panel using only 10–13 markers per cycle, which dramatically reduces per-cycle spectral overlap. This cellular barcoding strategy extends the utility of flow cytometry for high-dimensional multi-pass single-cell analyses and represents a genuinely novel architecture rather than a linear extension of existing spectral approaches[37].
6.2 Algorithmic Intelligence: The Unmixing Problem Becomes a Machine Learning Problem
The accuracy of spectral cytometry has always been bounded by the fidelity of spectral unmixing, which requires high-quality single-stained reference controls for every fluorochrome. As panels scale, this requirement becomes a severe bottleneck, both practically (40+ controls per experiment) and scientifically (reference spectra may not match sample behavior).
The next generation is addressing this from multiple angles simultaneously:
(1) Blind spectral unmixing (NMF-RI) extracts fluorochrome spectra directly from mixed data without any control samples, using non-negative matrix factorization with theoretical spectrum initialization. This eliminates the reagent and time cost of single-stained controls entirely[38].
(2) Per-event adaptive unmixing (TRU-OLS) exploits the biological fact that individual cells only express a subset of markers: rather than unmixing every event against all 40+ dyes, it unmixes each event with only the dyes actually present, directly reducing variance in the unmixed data[39].
(3) Universal clinical controls based on peripheral blood leukocytes enable clinical-grade unmixing using ubiquitously available material rather than specialized reference reagents, a critical step for routine diagnostic use[40].
(4) Theoretical spectrum libraries are being tested as substitutes for experimental single-stained controls, which would decouple panel design from the availability of specific reagent lots[41].
Fig. 3 Four trajectories shaping the next generation of spectral flow cytometry.
These are not minor refinements, they collectively signal a shift from empirical, control-dependent unmixing to model-driven, adaptive unmixing, which is arguably the most consequential change for making spectral cytometry scalable.
6.3 Modality Fusion: Spectral + Imaging + Biophysical
The next generation is unlikely to remain purely spectral. Several lines of convergence point toward multimodal platforms that integrate spectral fluorescence with orthogonal measurement modalities:
Table 6. Summary of next generation spectral flow cytometry with orthogonal measurement modalities
|
Modality |
What it adds |
Current status |
|
Imaging flow cytometry |
Morphological features + spatial localization of markers within cells |
Commercially available; deep learning enhancing diagnostic potential[42]. |
|
Hyperspectral microflow cytometry |
~3 nm spectral resolution across 450–650 nm in compact form factor |
Demonstrated for T lymphocyte subpopulation analysis[43]. |
|
Raman flow cytometry |
Label-free molecular fingerprinting via vibrational spectroscopy |
Emerging technique combining Raman spectroscopy with flow analysis[44]. |
|
Deep biophysical cytometry |
Mechanical, electrical, and optical properties beyond fluorescence |
Proposed framework exploiting rich cellular biophysical data via microfluidics and computer vision[45]. |
|
Multi-pass barcoding |
Time-resolved re-measurement of same cells |
32-marker panels demonstrated with 3 measurement cycles[37]. |
The computational hyperspectral microflow cytometer is particularly noteworthy, it achieves ~3 nm spectral resolution using a dispersive optical element and optimization algorithm in a miniaturized format, demonstrating that next-generation spectral resolution can be achieved outside large benchtop instruments. This has implications for point-of-care and portable applications where miniaturized flow cytometry has been limited by the inability to resolve spectrally overlapping labels[43].
The integration of spectral flow with single-cell sequencing represents another convergence point, simultaneous phenotypic and genomic profiling of individual cells bridges the gap between protein-level and transcript-level measurements[46].
6.4 Clinical Translation: From Research Tool to Diagnostic Platform
The most consequential shift may be the move from research-only instruments to clinically validated diagnostic platforms. Several developments indicate this is actively underway:
(1) Spectral MRD detection in acute myeloid leukemia now uses single-tube panels integrating all required markers, a format impossible with conventional cytometry, with unmixing routines designed to depend solely on ubiquitously available peripheral blood leukocytes. This addresses the key barrier to clinical adoption: reproducibility across sites without specialized reference materials[40].
(2) Platelet diagnostics have been transformed by spectral cytometry, enabling high-resolution single-cell analysis of surface markers, activation states, and intracellular signaling for conditions including HIT, VITT, and FNAIT[47,48].
(3) High-dimensional spectral flow cytometry is being applied to reveal immune mechanisms in disease contexts, for example, characterizing how tumor-associated molecules reshape T cell populations at single-cell resolution[48].
The emerging clinical pattern is clear: spectral cytometry enables the consolidation of multi-tube conventional panels into single-tube assays, which reduces sample volume requirements, turnaround time, and inter-tube variability, all critical for diagnostic reliability.
The overall trend signal is strong: the next generation of spectral flow cytometry will be defined less by incremental hardware improvements and more by the convergence of adaptive computational unmixing, multimodal data integration, and clinical standardization, transforming what has been a laboratory research instrument into a platform for single-cell systems biology at diagnostic scale.
References:
[1] NIEWOLD P, ASHHURST T M, SMITH A L, et al. Evaluating spectral cytometry for immune profiling in viral disease[J]. Cytometry Part A, 2020, 97(11): 1165-1179.
[2] ANDREWS K, ZHANG G, POPOVIC M, et al. A novel approach for the detection of spectral data using a CytoFLEX mosaic 63-channel detection accessory for a CytoFLEX S flow cytometer 4175[J]. The Journal of Immunology, 2025, 214(Supplement_1).
[3] MESSAGGIO F. Advancing Unmixing Algorithms in Spectral Flow Cytometry 9419[J]. The Journal of Immunology, 2025, 214(Supplement_1).
[4] BRESTOFF J R. Full spectrum flow cytometry in the clinical laboratory[J]. International Journal of Laboratory Hematology, 2023, 45(S2): 44-49.
[5] HAMMERICH L, SHEVCHENKO Y, KNORR J, et al. Resolving 31 colors on a standard 3‐laser full spectrum flow cytometer for immune monitoring of human blood samples[J]. Cytometry Part B: Clinical Cytometry, 2023, 104(5): 367-373.
[6] MariaJaimes, ZhenyuZhang, JianZhou,et al.METHODS AND APPARATUS FOR FULL SPECTRUM FLOW CYTOMETER:US17304844[P].US20220082489(A1)[2026-09-15].
[7] Powell B A, Kinney W H .Limits on primordial power spectrum resolution: An inflationary flow analysis[J].Journal of Cosmology & Astroparticle Physics, 2007(6).
[8] KHARRAZ Y, LUKESOVA V, SERRANO A L, et al. Full spectrum cytometry improves the resolution of highly autofluorescent biological samples: Identification of myeloid cells in regenerating skeletal muscles[J]. Cytometry Part A, 2022, 101(10): 862-876.
[9] MESSAGGIO F. Autofluorescence extraction on the CytoFLEX mosaic Spectral Detection Module 9420[J]. The Journal of Immunology, 2025, 214(Supplement_1).
[10] DAEMEN S, ADELAAR T I, BARLAMPAS P, et al. Managing Autofluorescence in Spectral Flow Cytometry for Macrophage Identification in the Liver[J]. European Journal of Immunology, 2026, 56(6).
[11] NIEWOLD P, ASHHURST T M, SMITH A L, et al. Evaluating spectral cytometry for immune profiling in viral disease[J]. Cytometry Part A, 2020, 97(11): 1165-1179.
[12] SCHMUTZ S, VALENTE M, CUMANO A, et al. Spectral Cytometry Has Unique Properties Allowing Multicolor Analysis of Cell Suspensions Isolated from Solid Tissues[J]. PLOS ONE, 2016, 11(8): e0159961.
[13] MESSAGGIO F. Advancing Unmixing Algorithms in Spectral Flow Cytometry 9419[J]. The Journal of Immunology, 2025, 214(Supplement_1).
[14] FERRER‐FONT L, PELLEFIGUES C, MAYER J U, et al. Panel Design and Optimization for High‐Dimensional Immunophenotyping Assays Using Spectral Flow Cytometry[J]. Current Protocols in Cytometry, 2020, 92(1).
[15] STALBAUM K, MCKITRICK T R, NGUYEN C M, et al. Investigation of problematic dye combinations to inform optimal panel design in spectral cytometry[J]. The Journal of Immunology, 2023, 210(Supplement_1): 250.02-250.02.
[16] VENGLAR O, RADOVA E, BROSKEVICOVA L, et al. OMIP‐117: 40‐Parameter/37‐Color Spectral Cytometry Panel for Robust Immunoprofiling of Human Lymphoid Subsets in Cancer Patients[J]. Cytometry Part A, 2025, 107(10): 641-648.
[17] SHEVCHENKO Y, LURJE I, TACKE F, et al. Fluorochrome‐dependent specific changes in spectral profiles using different compensation beads or primary cells in full spectrum cytometry[J]. Cytometry Part A, 2024, 105(6): 458-463.
[18] MESSAGGIO F. Advancing Unmixing Algorithms in Spectral Flow Cytometry 9419[J]. The Journal of Immunology, 2025, 214(Supplement_1). http://dx.doi.org/10.1093/jimmun/vkaf283.2820.
[19] SHEVCHENKO Y, LURJE I, TACKE F, et al. Fluorochrome‐dependent specific changes in spectral profiles using different compensation beads or primary cells in full spectrum cytometry[J]. Cytometry Part A, 2024, 105(6): 458-463.
[20] Mair F , Tyznik A J .High-Dimensional Immunophenotyping with Fluorescence-Based Cytometry: A Practical Guidebook[J]. 2019.
[21] Konecny A J , Mage P L , Tyznik A J ,et al.OMIP-102: 50-color phenotyping of the human immune system with in-depth assessment of T cells and dendritic cellsKey terms[J].Cytometry, Part A: the journal of the International Society for Analytical Cytology, 2024(6):105A.
[22] Zacharias Z R , Houtman J C D .OMIP‐099: 31‐color spectral flow cytometry panel to investigate the steady‐state phenotype of human T cells[J].Cytometry Part A, 2024, 105(1):10-15.
[23] Harris R J , Arkle B , Evans E ,et al.OMIP‐119: A 36‐Color Full‐Spectrum Flow Cytometry Panel for Deep Immunophenotyping of Peripheral Blood and ExVivo Expanded Human T Cells[J].Cytometry. Part A, 2025, 107(12).
[24] Waaijer L A , Cranenbroek B V , Koenen H J P M .OMIP-112: 42-Parameter (40-Color) Spectral Flow Cytometry Panel for Comprehensive Immunophenotyping of Human Peripheral Blood Leukocytes[J].Cytometry Part A, 2025, 107(4):226-232.
[25] SIMON Q, PERS J O, CORNEC D, et al. In-depth characterization of CD24highCD38high transitional human B cells reveals different regulatory profiles[J]. Journal of Allergy and Clinical Immunology, 2016, 137(5): 1577-1584.e10.
[26] PRIEST D, WING J. Heterogeneity of memory B cells in human blood[J]. International Immunology, 2026, 38(6): 348-356.
[27] CLAVARINO G, DELOUCHE N, VETTIER C, et al. Novel Strategy for Phenotypic Characterization of Human B Lymphocytes from Precursors to Effector Cells by Flow Cytometry[J]. PLOS ONE, 2016, 11(9): e0162209.
[28] WIGGINS K J, SCHARER C D. Roadmap to a plasma cell: Epigenetic and transcriptional cues that guide B cell differentiation[J]. Immunological Reviews, 2020, 300(1): 54-64.
[29] Paul A G A , Reichel K H H , Garcia-Vallejo J J ,et al.A 41-marker 37-color full spectrum flow cytometry panel for the deep immunophenotyping of human peripheral and liver natural killer cells[J].Frontiers in Immunology, 2025.
[30] Orta-Resendiz A , Petitdemange C , Schmutz S ,et al.Deep phenotyping characterization of human unconventional CD8+NKG2A/C+ T cells among T and NK cells by spectral flow cytometry[J].STAR Protocols, 2023, 4(4):102734.
[31] Tarazona R , Campos C , Pera A ,et al.Flow Cytometry Analysis of NK Cell Phenotype and Function in Aging[J].Methods in Molecular Biology, 2015, 1343:9-18.
[32] ROBINSON J P. The Diamond Age of Cytometry: From Fulwyler to Spectral Multiplexing[J]. Cytometry Part A, 2025, 107(11): 713-715.
[33] ROBINSON J P. Flow Cytometry: Past and Future[J]. BioTechniques, 2022, 72(4): 159-169.
[34] SHEVCHENKO Y, LURJE I, TACKE F, et al. Fluorochrome‐dependent specific changes in spectral profiles using different compensation beads or primary cells in full spectrum cytometry[J]. Cytometry Part A, 2024, 105(6): 458-463.
[35] SONG H, LIM Y, LIM J. An optimized three-laser 27-color spectral flow cytometry panel for multi-organ profiling in mice[J]. PLOS One, 2026, 21(7): e0347810.
[36] MAGE P L, KONECNY A J, MAIR F. Measurement and Prediction of Unmixing‐Dependent Spreading due to Collinearity in Spectral Flow Cytometry[J]. Cytometry Part A, 2026, 109(6): 436-455.
[37] KWOK S J J, FORWARD S, FAHLBERG M D, et al. High-dimensional multi-pass flow cytometry via spectrally encoded cellular barcoding[J]. Nature Biomedical Engineering, 2023, 8(3): 310-324.
[38] JIMÉNEZ-SÁNCHEZ D, ARIZ M, MORGADO J M, et al. NMF-RI: blind spectral unmixing of highly mixed multispectral flow and image cytometry data[J]. Bioinformatics, 2019, 36(5): 1590-1598.
[39] KMET R, NOVO D. Reducing Spreading: Removing the Impact of Irrelevant Dyes Improves Unmixed Flow Cytometry Data[J]. Cytometry Part A, 2025, 107(9): 573-586.
[40] WACLAWSKI J P, ARNHARDT I, FOKKEN H, et al. A Clinically Applicable Unmixing Approach for Spectral MRD Detection in AML[J]. Cancers, 2026, 18(14): 2323.
[41] Benestad H B ,I Strøm-Gundersen.Flow cytometry of mouse bone marrow cells cultured in vivo or in vitro.[J].Experimental Hematology, 1982, 10(4):343-51.
[42] DOAN M, VOROBJEV I, REES P, et al. Diagnostic Potential of Imaging Flow Cytometry[J]. Trends in Biotechnology, 2018, 36(7): 649-652.
[43] YUN H G, CADIERNO Y A, KIM T W, et al. Computational Hyperspectral Microflow Cytometry[J]. Small, 2024, 20(30).
[44] Xu J , Chen H , Wang C ,et al.Raman Flow Cytometry and Its Biomedical Applications[J].Biosensors (2079-6374), 2024, 14(4).
[45] LEE K C M, GUCK J, GODA K, et al. Toward Deep Biophysical Cytometry: Prospects and Challenges[J]. Trends in Biotechnology, 2021, 39(12): 1249-1262.
[46] ANDREYEV D S, ZYBAILOV B L. Integration of Flow Cytometry and Single Cell Sequencing[J]. Trends in Biotechnology, 2020, 38(2): 133-136.
[47] SPURGEON B E J. Platelet flow cytometry: An evolving platform for clinical hematology[J/OL]. Cytometry Part B: Clinical Cytometry, 2026.
[48] Ren Y, Yu X, Jiang J, Luo J, Zhao C, Mao X, Xi Y, He J, Yu C, Hu Y. Streptococcus anginosus-associated kynurenic acid drives PD-1 blockade resistance through an ITGA2-mTOR-CTSV axis in gastric cancer[J]. J Immunother Cancer, 2026, 14(8):e015172.

