

Obesity, a global epidemic, is intricately linked to chronic low-grade inflammation, particularly within adipose tissue, which plays a pivotal role in the pathogenesis of insulin resistance (IR) and type 2 diabetes mellitus (T2DM). This metabolic inflammation is characterized by significant alterations in the immune cell landscape within adipose tissue, with natural killer (NK) cells and regulatory T (Treg) cells emerging as key regulators with opposing roles.
This review systematically summarizes relevant research advances regarding NK and Treg alterations in obesity-associated type 2 diabetes (obesity and type 2 diabetes), including the infiltration characteristics of NK and Treg populations in adipose tissue, the application of high-fat diet and db/db mouse models for exploring NK-Treg crosstalk, the construction of an in vitro co-culture system of human NK and Treg cells (NK and Treg cell co-culture model) under high-glucose conditions, the frequency and phenotypic stability of FOXP3⁺ Treg in peripheral blood mononuclear cells (PBMCs) from diabetic individuals, multicolor flow cytometry panel optimization for simultaneous detection of NK and Treg in human specimens, magnetic bead-based isolation strategies for purifying NK and Treg cells in functional experiments, as well as functional assays evaluating Treg-mediated suppressive effects on the cytotoxic activity of NK cells.
Table of Contents
1. Adipose tissue immune cell infiltration analysis of NK and Treg populations in obesity-driven diabetes
2. High-fat diet and db/db mouse models for NK-Treg interaction in type 2 diabetes
3. In vitro co-culture system of human NK cells and treg cells under high glucose conditions
4. FOXP3+ Treg frequency and stability in diabetic peripheral blood mononuclear cells (PBMCs)
5. Flow cytometry panel design for simultaneous NK and Treg profiling in human samples
6. Magnetic bead-based isolation kits for NK and treg cell purification in functional studies
7. Suppression assay for Treg-mediated inhibition of NK cell cytotoxicity
01 Adipose tissue immune cell infiltration analysis of NK and Treg populations in obesity-driven diabetes
Obesity-driven type 2 diabetes (T2D,or obesity and type 2 diabetes) is characterized by chronic low-grade inflammation in adipose tissue (AT), especially visceral adipose tissue (VAT). This metaflammation arises from complex crosstalk between innate and adaptive immune cells, which drives the shift of AT from an anti-inflammatory to a pro-inflammatory microenvironment. In lean individuals, CD4+Foxp3+ regulatory T cells (Tregs), M2 macrophages, eosinophils and group 2 innate lymphoid cells (ILC2s) jointly sustain AT homeostasis and insulin sensitivity. In contrast, obesity induces infiltration of pro-inflammatory populations including CD8+ T cells, Th1 cells, M1 macrophages and NK cells, which collectively exacerbate insulin resistance and metabolic dysfunction[1].
1.1 NK Cells in Obese Adipose Tissue
NK cells are innate lymphoid cells responsible for immunosurveillance against viral infection and tumorigenesis. In the setting of obesity and T2D, however, NK cells undergo phenotypic and functional dysregulation in AT, thereby promoting metabolic impairment. Obese individuals exhibit elevated NK cell infiltration and altered NK cell phenotypes in dysfunctional AT, which are closely correlated with systemic metabolic disorders[2].
In particular, NK cell accumulation in human VAT under obese conditions facilitates local low-grade inflammation and insulin resistance. In obese females, adipose tissue-resident IFNγ-producing NK cells are tightly linked to hyperglycemia and insulin resistance[3]. The purinergic receptor P2Y6R expressed on NK cells is a key mediator of obesity-related insulin sensitivity impairment. Specific knockout of P2Y6R in NK cells of obese mice improves insulin sensitivity and reduces chemokine expression by AT-infiltrating NK cells, demonstrating a direct mechanistic connection between NK cell signaling and metabolic homeostasis[3,4].
Obesity also impairs NK cell function, manifested as reduced cytokine production and attenuated cytotoxicity, largely due to disrupted cellular metabolism. Such functional impairment of NK cells may increase multimorbidity risk in obese populations, particularly cancer susceptibility. Animal studies have confirmed that high-fat diet alters NK cell abundance, phenotype and cytotoxicity. Although NK cells exert context-dependent dual effects in metabolic diseases, GLP-1 analogues can restore NK cell metabolic fitness and effector function under obese conditions, providing a promising strategy to target NK cell activity for metabolic improvement. Ongoing studies further focus on phenotypic heterogeneity of human AT-resident NK cells to clarify their distinct roles in metabolic disorders[5].
1.2 Regulatory T Cells in Adipose Tissue
Foxp3⁺ Treg cells are pivotal for maintaining immune tolerance and tissue homeostasis, including metabolic regulation in adipose tissue (AT). In lean healthy individuals, AT Tregs preserve metabolic health by restraining pro-inflammatory responses and sustaining insulin sensitivity. Adipose tissue-resident Tregs display substantial phenotypic heterogeneity and modulate immune and metabolic processes via multiple physiological signals, with distinct subsets exerting divergent functions in aging and obesity[6].
Obesity disrupts the homeostasis and function of AT Tregs, leading to insulin resistance. Obese individuals typically show reduced frequency and impaired immunosuppressive capacity of Tregs, especially in VAT. Despite the adaptive plasticity of Foxp3+ Tregs, such plasticity also confers lineage instability. Downregulation of Foxp3 enables Treg transdifferentiation into pro-inflammatory effector cells, which contributes to the pathogenesis of obesity and T2D[7].
Dietary components profoundly modulate Treg function. For example, palmitic acid impairs the immunosuppressive ability of ICOShigh AT Tregs and disturbs systemic metabolism in obesity, indicating that saturated fatty acids directly compromise Treg anti-inflammatory function. In addition, insulin signaling shapes the developmental trajectory of AT Tregs, forming a feedback loop between metabolic status and Treg development and function. Beyond conventional Tregs, CD8+ Tregs also participate in obesity-associated insulin resistance. O-GlcNAc signaling mediated by STAT5 O-GlcNAcylation is essential for maintaining Treg identity and suppressive capacity under obesogenic stress[6,7].
1.3 The NK-Treg Axis and Therapeutic Implications
Adipose tissue immune microenvironment is dynamically remodeled under obese conditions, shifting from an anti-inflammatory insulin-sensitive state to a pro-inflammatory insulin-resistant state. This transition is primarily driven by the immune imbalance between pro-inflammatory cells (e.g., NK cells, Th1, Th17 and CD8+ T cells) and anti-inflammatory Tregs. Increased NK cell abundance and cytotoxicity, coupled with declined Treg frequency and function, jointly trigger AT dysfunction and systemic insulin resistance. NKT cells also regulate AT inflammation by modulating the Th1/Th2 immune balance[8].
Although the interaction mechanisms between NK cells and Tregs remain incompletely defined, NK cell-derived exosomes carrying miR-1249-3p can alleviate insulin resistance and inflammation in T2D mouse models. Elucidating the homeostasis, crosstalk and phenotypic heterogeneity of NK cells and Tregs is critical for developing targeted therapies against obesity-driven T2D. Further investigations on Treg tissue adaptation, metabolic regulation and bioinformatic screening of immune-related genes will help uncover the molecular mechanisms underlying obesity-induced insulin resistance. The following table summarizes the phenotypic and functional differences between NK cells and Tregs in obese VAT[8,9].
Table 1. Summary for NK Cells and Treg Cells in Obese Visceral Adipose Tissue (VAT)[7,8,9]
|
Feature |
NK Cells in Obese VAT |
Treg Cells in Obese VAT |
|
Frequency |
Increased (2-3 fold) |
Decreased |
|
Phenotype |
Activated: NKG2D+, CD56bright, CD94+, TNFα+, IFNγ+ |
Reduced PPARγ, ST2, Foxp3, IL-10 expression |
|
Key function |
Promote ATM recruitment & M1 polarization via TNFα/CCL2 |
Suppress ATM & effector T cells via IL-10/TGF-β |
|
Impact on insulin resistance |
Promotes IR |
Protects against IR |
|
Regulatory signal |
IL-15 from ATMs; NCR1 ligands from stressed adipocytes |
IL-33 from endothelial cells/adipocytes; PPARγ |
|
Therapeutic target |
NK cell depletion improves metabolism |
Treg expansion (IL-33, pioglitazone, anti-CD3) improves metabolism |
In conclusion, the balance between NK cells and Tregs in visceral adipose tissue is a critical determinant of obesity-induced inflammation and insulin resistance. NK cells act as pro-inflammatory sentinels that drive macrophage accumulation and activation, whereas Tregs serve as tissue-protective regulators to sustain metabolic homeostasis. Targeting the restoration of this balance via Treg expansion, pathogenic NK cell depletion, or both provides a promising approach to treat obesity-associated type 2 diabetes.
02 High-fat diet and db/db mouse models for NK-Treg interaction in type 2 diabetes
The interaction between Natural Killer (NK) cells and regulatory T cells (Tregs) in the context of high-fat diet (HFD)-induced type 2 diabetes (T2D) represents a critical area of research, which is frequently explored using the db/db mouse model. Characterized by a loss-of-function mutation in the leptin receptor (Lepr), this model exhibits profound metabolic dysfunction, including hyperglycemia, insulin resistance, and systemic inflammation, particularly when exposed to an HFD. Alongside other genetic and diet-induced models, the db/db mouse is indispensable for deciphering the molecular changes and immune dysregulation that occur during the early stages of T2D development[10].
As a well-established environmental factor, a high-fat diet contributes to the development of T2D and its associated complications, including chronic low-grade inflammation. Obesity, which is frequently induced by HFD consumption, constitutes a major public health challenge and is linked to an increased risk of various chronic diseases, such as cancer and diabetes. The impact of HFD on immune cells, especially NK cells and Tregs, lies at the core of understanding T2D progression[11].
NK cells, as circulating lymphoid cells, play a crucial role in eliminating virus-infected and tumor cells. However, their phenotype and functionality can be impaired under conditions of obesity and T2D (obesity and type 2 diabetes). Studies have demonstrated that an HFD can reduce the number, alter the phenotype, and impair the cytotoxicity of NK cells in C57BL/6 mice. Conversely, NK cells have been implicated in the development of obesity-associated insulin resistance: one study showed that NK cell-specific inactivation of the P2Y6 receptor gene improved insulin sensitivity in obese mice and reduced chemokine expression in adipose tissue-infiltrating NK cells[11]. Additionally, exosomes derived from NK cells of lean mice have been shown to attenuate obesity-induced insulin resistance and inflammation in T2D mouse models, suggesting a regulatory role of NK cells in modulating insulin sensitivity. The interplay between NK cells and obesity remains a dynamic research field, with studies highlighting both their dysfunction in metabolic disorders and their potential for therapeutic manipulation[12].
Regulatory T cells (Tregs) are well recognized for their role in suppressing inflammation and maintaining immune homeostasis. The plasticity of Foxp3+ Tregs, their ability to adapt to diverse immune responses, is vital; however, this plasticity also carries the risk of lineage instability, which can lead to the adoption of pro-inflammatory effector programs[13]. In T2D, the balance between T helper-17 (Th17) cells and Tregs is perturbed. The differentiation of naive T cells into Th17 cells, driven by cytokines such as transforming growth factor-β (TGF-β) and interleukin-6 (IL-6), is critical for host defense but can drive autoimmune diseases when dysregulated. Notably, the Th17/Treg balance is closely influenced by the metabolic state. Accumulating evidence indicates that obesity and diabetes are associated with chronic low-grade inflammation, often termed “metaflammation”, which involves various immune cells, including monocytes and macrophages. Adipose tissue, once considered a passive energy depot, is now recognized as an active endocrine organ that communicates with the immune system via adipokines. In obesity, adipokines can orchestrate immune responses that lead to metabolic inflammation, a hallmark of metabolic disorders. This chronic inflammatory milieu, characterized by cytokines such as tumor necrosis factor-α (TNF-α), directly impairs insulin signaling[14].
The db/db mouse model serves as a valuable tool for studying these immune interactions in T2D, owing to its intrinsic leptin receptor deficiency. This deficiency leads to severe obesity and T2D even when fed a standard diet, with metabolic dysfunction further exacerbated by an HFD. The genetic background of these mice, typically C57BL/6, renders them prone to obesity and leptin resistance. This model enables researchers to investigate early transcriptomic changes in tissues involved in metabolic regulation, including adipose tissue, muscle tissue, and the liver. For example, HFD-induced changes in mesenteric adipose tissue have been shown to accelerate early-stage pancreatic carcinogenesis in mice. The liver is particularly susceptible to the effects of an HFD, including the development of hepatic steatosis and insulin resistance[15,16].
Immune dysregulation in T2D involves both innate and adaptive immune components. In obese mice with diabetes, increased macrophage infiltration and activation in peripheral insulin target tissues are strongly associated with insulin resistance. Chronic low-grade inflammation, characterized by immune cell activation and the release of inflammatory cytokines, is a key driver of insulin resistance and beta-cell dysfunction in T2D. This “metaflammation” represents a critical link between obesity and insulin resistance[17].
The balance between pro-inflammatory NK cells and anti-inflammatory Tregs is critical for maintaining metabolic homeostasis within adipose tissue. In obesity, disruption of this balance can lead to heightened inflammation and impaired metabolic function. While direct evidence of physical interaction between NK cells and Tregs in db/db mice is limited in the available literature, their functional antagonism can be inferred from immunophenotyping and cytokine profiling studies. Metabolic stress can influence the plasticity of Tregs, potentially leading to a shift toward pro-inflammatory phenotypes. Understanding this delicate balance, as well as the specific mechanisms by which HFD and leptin receptor deficiency modulate it, is crucial for the development of targeted therapeutic strategies for T2D[18].
Animal models, including the db/db mouse, are indispensable for dissecting the complex interplay between diet, genetics, and immune responses in T2D. These models facilitate the understanding of pathophysiological features, the evaluation of drug efficacies, and the exploration of potential therapeutic targets for this global health crisis. Further research is required to fully elucidate the intricate molecular and cellular pathways that mediate NK-Treg interactions in the context of HFD-induced T2D, as well as how these interactions contribute to insulin resistance and chronic inflammation[19].
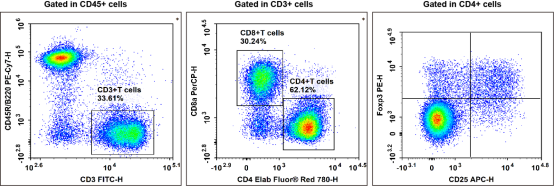
Fig. 1 Detection and analysis of Treg cells in C57BL/6 mouse splenocytes. C57BL/6 mouse splenocytes were surface stained with Elab Fluor® Violet 450 Anti-Mouse CD45, PE/Cyanine7 Anti-Mouse CD45R/B220, FITC Anti-Mouse CD3, Elab Fluor® Red 780 Anti-Mouse CD4, PerCP Anti-Mouse CD8a and APC Anti-Mouse CD25 and then treated with Foxp3/Transcription Factor Staining Kit. Cells were then stained with PE Anti-Mouse Foxp3, followed by analysis via multicolor flow cytometry. Regulatory T cells (Treg cells) exhibit the phenotype of CD45+CD45R/B220-CD3+CD4+CD25+Foxp3+. (The data are provided by Elabscience.)
Elabscience® Quick Overview of Popular Products:
Table 2. Reagents for Mouse Treg cell Research
|
Product Name |
Cat. No. |
|
Elab Fluor® Violet 450 Anti-Mouse CD45 Antibody[30-F11] |
E-AB-F1136Q |
|
PE/Cyanine7 Anti-Mouse CD45R/B220 Antibody[RA3.3A 1/6.1] |
E-AB-F1112H |
|
FITC Anti-Mouse CD3 Antibody[17A2] |
E-AB-F1013C |
|
Elab Fluor® Red 780 Anti-Mouse CD4 Antibody[RM4-5] |
E-AB-F1353S |
|
PerCP Anti-Mouse CD8a Antibody[53-6.7] |
E-AB-F1104F |
|
APC Anti-Mouse CD25 Antibody[PC-61.5.3] |
E-AB-F1102E |
|
PE Anti-Mouse Foxp3 Antibody[3G3] |
E-AB-F1238D |
|
10×ACK Lysis Buffer |
E-CK-A105 |
|
Ready-to-Use Foxp3/Transcription Factor Staining Kit |
E-CK-A108 |
03 In vitro co-culture system of human NK cells and treg cells under high glucose conditions
An in vitro co-culture system of human Natural Killer (NK) cells and regulatory T (Treg) cells under high glucose conditions serves as a crucial model for investigating immunometabolic interactions within hyperglycemic or diabetic microenvironments[20]. This system is particularly relevant given the significant impact of metabolic states on immune cell function[21].
High glucose (typically defined as 25 mM D-glucose, in contrast to the physiological normal glucose level of 5.6 mM) can profoundly affect the functional attributes of both NK and Treg cells[22]. For NK cells, high glucose conditions often lead to impaired cytotoxic activity, reduced interferon-gamma (IFN-γ) production, and decreased metabolic fitness, which may manifest as diminished glycolysis and mitochondrial respiration[23]. For example, studies have demonstrated that the inhibition of glucose uptake can block NK cell proliferation but not necessarily their cytotoxic activity, suggesting complex metabolic regulation of NK cell functions. Further research indicates that restricting glucose uptake might even increase the serial-killing capacity of NK cells. The metabolic state directly influences NK cell activation and effector functions, including their ability to lyse target cells and produce cytokines[24].
Conversely, high glucose conditions can enhance the suppressive function and stability of Treg cells. This enhancement often involves increased FoxP3 expression and elevated secretion of immunosuppressive cytokines such as interleukin-10 (IL-10) and transforming growth factor-β (TGF-β)[25]. As critical mediators of immune tolerance, Treg cells are vulnerable to dysregulation, potentially exacerbated by metabolic stress, which can have significant implications for immune responses in various contexts, including pregnancy and autoimmune diseases. For instance, cytotoxic T-lymphocyte-associated protein 4 (CTLA-4) blockade has been shown to drive a loss of Treg stability in glycolysis-low tumors, highlighting the metabolic sensitivity of Treg function in tumor microenvironments. Notably, high glucose has also been shown to impair cognitive function by inducing mitochondrial calcium overload in Treg cells, further underscoring the impact of metabolic conditions on Treg biology[26].
Co-culture (NK and Treg cell co-culture model) studies involving NK and Treg cells under high glucose conditions consistently demonstrate that hyperglycemia amplifies Treg-mediated suppression of NK cell proliferation and effector functions, and this amplification can occur through several key mechanisms. One significant pathway involves altered adenosine signaling, characterized by the upregulation of CD39 and CD73 on Treg cells; these enzymes catabolize adenosine triphosphate (ATP) to adenosine, a potent immunosuppressive molecule that further inhibits NK cell activity. Additionally, changes in mammalian target of rapamycin (mTOR) activity and increased reactive oxygen species (ROS) accumulation contribute to the metabolic dysregulation observed in both cell types under high glucose stress, which in turn exacerbates the suppressive effects of Tregs on NK cells. Notably, the CD25bright NK cell subpopulation displays superior function and metabolic activity even under Treg-mediated suppression, suggesting phenotypic adaptations that enable resistance to suppressive environments[26,27].
Methodological considerations for establishing such an in vitro co-culture system (NK and Treg cell co-culture model) are critical for obtaining reliable and reproducible results. These include:
Cell Isolation and Purity: Ensuring the isolation of highly pure CD56+CD3− NK cells and CD4+CD25highCD127lowFoxP3+ Treg cells (or CD4+ T cells can be isolated using a CD4+ T cell isolation kit, and then Treg cells can be further enriched and isolated) from either healthy donors or individuals with metabolic disorders such as diabetes. The purity of these cell populations is paramount to accurately interpreting experimental outcomes.
Glucose-Controlled Media: Utilizing media with precisely controlled glucose concentrations (e.g., 25 mM D-glucose for high glucose, 5.6 mM for normal glucose) and incorporating appropriate osmotic controls, such as mannitol, to differentiate between glucose-specific effects and general osmotic stress.
Functional Readouts: Comprehensive assessment of various functional parameters, including NK cell cytotoxicity against target cells, cytokine profiling (e.g., IFN-γ, IL-10, TGF-β), metabolic flux analysis (e.g., glycolysis, oxidative phosphorylation), and surface marker expression (e.g., activating and inhibitory receptors on NK cells, FoxP3 on Tregs).
Mechanistic Dissection: Incorporating metabolic inhibitors (e.g., 2-deoxyglucose for glycolysis inhibition, metformin for mitochondrial complex I inhibition) or checkpoint modulators (e.g., anti-CTLA-4 antibodies) can help elucidate the underlying molecular mechanisms of immunometabolic regulation.
Such co-culture systems provide valuable insights into the intricate interplay between metabolism and immune function, which is particularly relevant to understanding disease pathogenesis in diabetes and developing novel immunotherapeutic strategies[28]. For example, in tumors, an immunosuppressive microenvironment can be established where immune cells such as NK cells are inhibited by factors including regulatory T (Treg) cells or abnormal metabolic conditions, paralleling the immunometabolic dysregulation observed in diabetes. Thus, understanding how high glucose influences NK-Treg interactions can facilitate the development of targeted interventions that restore immune surveillance and effector functions in metabolically compromised patients[29].
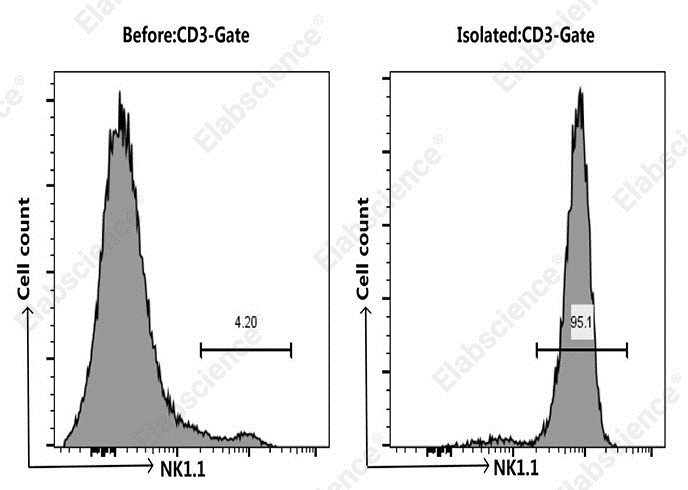
Fig. 2 Purity comparison of NK cells from C57BL/6 mouse splenocytes before and after sorting. Splenocytes were isolated from C57BL/6 mice using the EasySort™ Mouse NK Cell Isolation Kit (MIM005N). Cells were co‑stained with APC Anti‑Mouse CD3 Antibody [17A2] (E‑AB‑F1013E) and PE Anti‑Mouse NK1.1 Antibody [PK136] (E‑AB‑F0987D) pre‑ and post‑sorting. The results showed that the percentages of CD3⁻NK1.1⁺ cells in mouse splenocytes were 4.2% before sorting and 95.1% after sorting, respectively. (The data are provided by Elabscience.)
Elabscience® Quick Overview of Popular Products:
Table 3. Reagents for NK Cell Research
|
Product Name |
Cat. No. |
|
EasySort™ Mouse NK Cell Isolation Kit |
MIM005N |
|
Anti-Human CD45-FITC/CD3-PE/Cyanine5/CD56/NCAM-PE/CD19-PE/Elab Fluor® 594 Cocktail |
E-AB-FC0028 |
|
Anti-Human CD19-FITC/CD56-PE/CD3-PE/Cyanine7/CD45-PerCP Cocktail |
E-AB-FC0011 |
|
EasyStain™ Human Fc Receptor Blocking Solution |
E-CK-A171 |
|
FITC Anti-Human/Monkey CD16 Antibody[3G8] |
E-AB-F1236C |
|
PE Anti-Human HLA-DR Antibody[L243] |
E-AB-F1111D |
|
PerCP/Cyanine5.5 Anti-Human CD3 Antibody[OKT-3] |
E-AB-F1001J |
|
APC Anti-Human/Monkey CD56/NCAM Antibody[B-A19] |
E-AB-F1305E |
|
Caspase 1 Activity Assay Kit(Colorimetric Method) |
E-CK-A381 |
|
Caspase 1 Activity Detection Substrate for Flow Cytometry |
E-CK-A481 |
|
Caspase 3/7 Activity Assay Kit(Colorimetric Method) |
E-CK-A383 |
|
Caspase 2 Activity Assay Kit(Colorimetric Method) |
E-CK-A382 |
|
Caspase 4 Activity Assay Kit(Colorimetric Method) |
E-CK-A384 |
|
Caspase 6 Activity Assay Kit(Colorimetric Method) |
E-CK-A386 |
|
Caspase 8 Activity Assay Kit(Colorimetric Method) |
E-CK-A388 |
|
Caspase 9 Activity Assay Kit(Colorimetric Method) |
E-CK-A389 |
|
Caspase 4 Activity Detection Substrate for Flow Cytometry |
E-CK-A484 |
|
Caspase 6 Activity Detection Substrate for Flow Cytometry |
E-CK-A486 |
|
Caspase 8 Activity Detection Substrate for Flow Cytometry |
E-CK-A488 |
|
Caspase 9 Activity Detection Substrate for Flow Cytometry |
E-CK-A489 |
|
Caspase 3/7 Activity Detection Substrate for Flow Cytometry |
E-CK-A483 |
|
Annexin V-FITC/PI Apoptosis Kit |
E-CK-A211 |
|
One-step TUNEL In Situ Apoptosis Kit (Green, FITC) |
E-CK-A320 |
|
One-step TUNEL Flow Cytometry Apoptosis Kit (Green, FITC) |
E-CK-A420 |
|
Caspase 3/7 and Annexin V Double Staining Apoptosis Kit |
E-CK-A831 |
04 FOXP3+ Treg frequency and stability in diabetic peripheral blood mononuclear cells (PBMCs)
Studies have illustrated pathogenic FOXP3 variants induce immune dysregulation, which is attributed to unstable Tregs and expanded autoreactive effector T cells, thus highlighting the central role of FOXP3 in maintaining immune tolerance[30].
In type 2 diabetes mellitus (T2DM), which is typically accompanied by low-grade inflammation, alterations in Treg populations are also evident. A systematic review and meta-analysis has reported changes in regulatory T cells (Tregs) in patients with T2DM. Specifically, several studies have investigated the levels of CD4+CD25+FOXP3+ Tregs in the peripheral blood of T2DM patients, especially those with peripheral neuropathy. While the involvement of type 1 regulatory T (Tr1) cells in T2DM remains poorly explored, quantitative analyses have begun to shed light on the role of these cell populations. Genetic factors also play a role, as FOXP3 gene polymorphisms have been studied for their potential involvement in the development of T2DM. For gestational diabetes mellitus (GDM), a systematic review and meta-analysis has concluded that there is a significant association between GDM and the levels of Tregs in maternal peripheral blood[31].
The stability of FOXP3+ Tregs is critical, as unstable Tregs can lose FOXP3 expression and acquire an effector-like phenotype, thereby contributing to the progression of inflammatory responses. The maintenance of FOXP3 expression involves various transcription factors and epigenetic mechanisms. For example, the BATF protein is required for Treg homeostasis and stability by regulating the demethylation status and accessibility of the CNS2 region within the Foxp3 locus. Additionally, PD-L2 contributes to the maintenance of metabolic activity and FOXP3 stability in peripherally induced Tregs (pTregs). The IL-2/STAT5 signaling pathway is critical for FOXP3 expression, as well as Treg development and function, with megakaryoblastic leukemia 1 (MKL-1) acting as a coactivator for STAT5b[32].
The transient expression of FOXP3 in activated non-Tregs necessitates the use of careful gating strategies in multicolor flow cytometry to accurately identify and assess true Treg populations. Markers such as CD4+CD25+CD127lo/- are commonly used for Treg identification; however, the inclusion of Helios and analysis of Treg-specific demethylated region (TSDR) demethylation can provide a more reliable method for identifying lineage-stable Tregs, particularly in adoptive cell therapies where Treg stability is paramount. Epigenetic modifications, including DNA methylation and histone modifications, play a significant role in stabilizing immune cell identity. DNA methyltransferase inhibitors, such as azacytidine, are currently being investigated for their immunomodulatory effects in inflammatory disorders, including diabetes mellitus, through their potential ability to regulate Treg populations[33].
Environmental factors, including the gut microbiota and diet, also modulate Treg induction and stability. For example, maternal gut microbiota and nutrition can shape the neonatal immune system, thereby contributing to the establishment of neonatal immune regulation and Treg homeostasis. Specific gut commensal bacteria and their metabolites, such as short-chain fatty acids (e.g., butyrate), can epigenetically regulate FOXP3 expression and enhance Treg differentiation and stability in the intestinal tract[34].
Overall, accumulating evidence indicates a complex interplay between genetic, epigenetic, and environmental factors that regulate the frequency and stability of FOXP3+ Tregs in diabetes mellitus. A deeper understanding of these mechanisms is essential for the development of targeted immunotherapies designed to restore immune tolerance and mitigate the progression of diabetes-related complications.
_.png)
Fig. 3 Detection and analysis of Treg cells in Human Peripheral blood mononuclear cells (PBMCs). Human PBMCs were stained with Elab Fluor® Violet 450 Anti-Human CD45, Elab Fluor® Red 780 Anti-Human CD3, FITC Anti-Human CD4, PerCP/Cyanine5.5 Anti-Human CD8, PE Anti-Human CD25 and APC Anti-Human CD127, followed by analysis via flow cytometry. Regulatory T cells (Treg cells) exhibit the phenotype of CD45+CD3+CD4+CD127LOW/-CD25+. (The data are provided by Elabscience.)
Elabscience® Quick Overview of Popular Products:
Table 4. Reagents for Human Treg Cell Research
|
Product Name |
Cat. No. |
|
Elab Fluor® Violet 450 Anti-Human CD45 Antibody[HI30] |
E-AB-F1137Q |
|
Elab Fluor® Red 780 Anti-Human CD3 Antibody[OKT-3] |
E-AB-F1001S |
|
FITC Anti-Human/Monkey CD4 Antibody[SK3] |
E-AB-F1352C |
|
PerCP/Cyanine5.5 Anti-Human CD8 Antibody[UCHT-4] |
AN00427J |
|
PE Anti-Human CD25 Antibody[BC96] |
E-AB-F1194D |
|
APC Anti-Human CD127/IL-7RA Antibody[A019D5] |
E-AB-F1152E |
|
10×ACK Lysis Buffer |
E-CK-A105 |
|
10× RBC Lysis/Fixation Solution |
E-CK-A106 |
05 Flow cytometry panel design for simultaneous NK and Treg profiling in human samples
Designing a comprehensive flow cytometry panel for the simultaneous profiling of Natural Killer (NK) cells and regulatory T cells (Tregs) in human samples requires careful consideration of numerous factors, including marker selection, fluorochrome assignment, and compensation strategies, to ensure high-quality, interpretable data. Such panels are crucial for deep immunophenotyping, which is a central component of human immune system multi-omic studies and increasingly important for immune monitoring in various diseases. The objective is to resolve broad immune compartment populations, as well as activation and memory states of specific T, B, NK, and myeloid lineages. The initial step in panel design involves selecting appropriate cell surface and intracellular markers that unambiguously identify NK cells and Tregs while minimizing cross-reactivity and spectral overlap. Below are the markers for NK cells and Tregs used in the flow cytometry panel.
Table 5. Expected Staining Patterns (Human PBMC)
|
Population |
CD45 |
CD3 |
CD4 |
CD8 |
CD56 |
CD16 |
CD25 |
CD127 |
FoxP3 |
CD45RA |
|
NK cells |
+ |
- |
- |
- |
+ |
+/- |
- |
- |
- |
- |
|
classical Treg |
+ |
+ |
+ |
- |
- |
- |
high |
low |
+ |
+/- |
|
Conventional CD4 T |
+ |
+ |
+ |
- |
- |
- |
low |
high |
- |
+/- |
|
CD8+ Treg (rare) |
+ |
+ |
- |
+ |
- |
- |
+ |
low |
+ |
- |
NOTE: “+” means positive; “-” means negative; “high” means high expression; “low” means low expression.
Secondly, Fluorochrome Selection and Assignment. Fluorophores vary in brightness, and it is crucial to match the brightest fluorochromes to markers expressed at low levels (low-density epitopes) to ensure detectability above background noise. Below is a 16-color panel (including viability) optimized for peripheral blood mononuclear cells (PBMCs) and full-spectrum analysis.
Table 6. Marker Panel and Fluorochrome Assignment
|
Marker |
Clonal |
Fluorochrome |
Cat. No. |
|
CD8 |
OKT-8 |
Elab Fluor® Violet 610 |
E-AB-F1110T |
|
CCR7/CD197 |
G043H7 |
Elab Fluor® Violet 450 |
E-AB-F1159Q |
|
CD3 |
OKT-3 |
Percp |
E-AB-F1001F |
|
CD4 |
SK3 |
Elab Fluor® 647 |
E-AB-F1352M |
|
CD45RA |
HI100 |
PE/Cyanine7 |
E-AB-F1052H |
|
CD45 |
HI30 |
Elab Fluor® Violet 500 |
E-AB-F1137R |
|
CD28 |
CD28.2 |
APC |
E-AB-F1195E |
|
CD69 |
FN50 |
PE |
E-AB-F1138D |
|
CD45RO |
UCHL1 |
PE/Elab Fluor® 594 |
E-AB-F1139P |
|
CD95 |
DX2 |
Elab Fluor® 700 |
E-AB-F1168M1 |
|
CD25 |
BC96 |
PE/Cyanine5 |
E-AB-F1194G |
|
CD127 |
A019D5 |
Elab Fluor® Red 780 |
E-AB-F1152S |
|
CD62L |
DREG56 |
Elab Fluor® Violet 540 |
E-AB-F1051T3 |
|
CD183/CXCR3 |
G025H7 |
FITC |
E-AB-F1156C |
|
CD194/CCR4 |
L291H4 |
PerCP/Cyanine5.5 |
E-AB-F1366J |
|
Live/Dead |
/ |
STYX™ Near-IR |
E-CK-A168 |
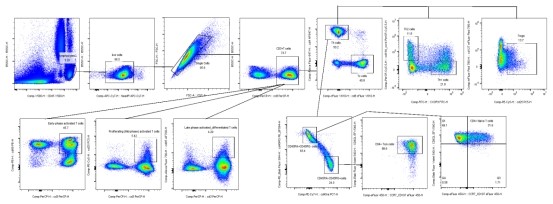
Fig. 4 16-color full-spectrum analysis of human peripheral blood T cells. T cell subsets in human peripheral blood were detected using a spectral flow cytometer (Agilent NovoCyte Opteon VBRY), and the data were analyzed with FlowJo software.
Thirdly, key considerations for designing multi-color panels include controls and compensation. Accurate multicolor analysis requires compensation, i.e., mathematical correction for spectral spillover. Fluorescence Minus One (FMO) controls are essential for accurate gating, especially for dim populations or markers with continuous expression patterns, as they define the true background signal of each channel in a multicolor experiment. Recommended controls and compensation types prior to a flow cytometry experiment are listed below.
Table 7. Recommended Controls
|
Control Type |
Purpose |
Example |
|
Fluorescence Minus One (FMO) |
Define positive gates for dim markers (CD25, FoxP3, CD56) |
FMO for CD25, FMO for FoxP3, FMO for CD56 |
|
Isotype control |
Assess non-specific binding |
Isotype for FoxP3 (since intracellular) |
|
Biological positive/negative |
Verify antibody performance |
Treg: PBMC activated with CD3/CD28; NK: healthy donor PBMC |
|
Single‑stain beads / cells |
Compensation (especially for tandem dyes) |
Arcturus/UltraComp beads |
Overall, the design of flow cytometry panels for simultaneous NK and Treg profiling in human samples necessitates a detailed understanding of both the biology of these cell types and the technical intricacies of modern flow cytometry. The continuous development of new reagents, instrumentation, and analytical methods supports increasingly complex and informative immunophenotyping studies.
06 Magnetic bead-based isolation kits for NK and treg cell purification in functional studies
Magnetic bead-based isolation kits are a widely employed method for purifying specific cell populations, such as Natural Killer (NK) cells and regulatory T cells (Tregs), from heterogeneous samples like peripheral blood mononuclear cells (PBMCs) for downstream functional studies. This technique leverages antibody-conjugated superparamagnetic nanoparticles that specifically target cell surface markers, allowing for positive selection (isolating desired cells) or negative selection (depleting undesired cells). The choice between these methods is crucial, as it can significantly impact the purity, viability, and functional integrity of the isolated cells.
Selecting the appropriate sorting method depends on multiple factors. The table below compares the working principles, applications, and pros and cons of three cell sorting strategies for quick reference.
Table 8. Comparison of Magnetic Bead Sorting Strategies by Application
|
Types |
Positive Selection |
Negative Selection |
Sequential Sorting |
|
Principle |
Directly “grab” the target cells |
Remove all “spectators” and leave the target cell |
Combine multiple strategies and achieve high purity in a step-by-step manner |
|
Common scenarios |
1) Enrich rare cells (e.g., specific T cell subsets accounting for <5% of total cells) 2) Sort cells expressing weak surface markers 3)Accommodate time pressure during the experiment |
1) In downstream experiments (e.g., cell culture and functional assays), labeling cells with magnetic beads is strictly prohibited. 2) The target cells lack specific markers. 3) Certain specific cells (e.g., dead cells) need to be removed. |
1) The proportion of target cells is extremely low, so pre-enrichment is necessary. 2) The target cells lack specific markers, so an alternative approach is needed. 3) The target cells are rare subgroups (such as regulatory T cells). |
|
Advantages |
High purity, fast speed, simple operation |
Cells are not labeled, thus maintaining their native state |
High final purity can be achieved |
|
Disadvantages |
Magnetic beads or antibodies bound to the cell surface may induce non‑specific cell activation or compromise downstream assays. |
The number of magnetic beads used is large, and the purity may be slightly lower than that of positive sorting. Moreover, understanding the characteristics of all non‑target cells is necessary. |
This process is more time‑consuming and may result in greater cell loss.
|
The characteristics of the isolated cell populations directly influence the reliability and translatability of downstream functional assays and therapeutic applications.
Purity and Viability: High purity and viability are paramount to ensure that observed effects are attributable to the target cell population and not contaminants. Contaminating cells, particularly other immune cells, can significantly confound functional assay results.
Activation Status: The isolation method should ideally not pre-activate or exhaust the cells, as this can alter their natural response patterns in functional studies. Negative selection generally helps preserve a more native activation state.
Reproducibility: Consistency in isolation methods is essential for obtaining reproducible results across experiments and different batches of cells.
In summary, magnetic bead-based isolation provides a versatile and effective approach for purifying NK cells and Tregs. Careful selection of isolation strategy (positive vs. negative selection), specific markers, and validation of purity and functional integrity are crucial for ensuring the reliability of subsequent functional studies and advancing our understanding of these critical immune cell populations.
07 Suppression assay for Treg-mediated inhibition of NK cell cytotoxicity
While the provided source materials extensively discuss the isolation and characterization of regulatory T cells (Tregs) and natural killer (NK) cells, including their respective functional assays (suppression assays for Tregs and cytotoxicity assays for NK cells), the specific details for designing a suppression assay focused on Treg-mediated inhibition of NK cell cytotoxicity are not directly available. The available literature primarily addresses these cell types and their functions independently. Therefore, a detailed protocol for such a combined assay cannot be formulated based solely on the provided information[35].
However, based on the principles outlined in the provided documents regarding Treg suppressive function and NK cell cytotoxic activity, a conceptual framework for such an assay can be inferred. Tregs are known to exert suppressive effects on various immune cells, including conventional T cells. NK cells, on the other hand, are critical for cytotoxicity against tumor cells and virally infected cells. A suppression assay (NK cell cytotoxicity assay) designed to evaluate Treg-mediated inhibition of NK cell cytotoxicity would conceptually involve co-culturing NK cells (as effector cells), target cells (e.g., tumor cells), and Tregs (as suppressor cells).
Key considerations for such an assay, drawing from the general principles of functional assays for these cell types, would include:
Cell Isolation and Purity: High-purity isolation of both NK cells and Tregs from PBMCs is paramount to ensure that observed effects are attributable to the target cell populations and not contaminants. Negative selection methods are generally preferred for both NK cells and Tregs to preserve their native phenotype and functionality, minimizing antibody-mediated activation or inhibition that could interfere with functional assays. For Tregs, purification strategies often involve negative selection followed by positive selection for CD25+ cells to achieve high purity, as demonstrated in a GMP setting for adoptive cell therapy.
Target Cell Selection: Appropriate target cells sensitive to NK cell-mediated lysis would be required. These could be tumor cell lines known to be susceptible to NK cell cytotoxicity.
Assay Readouts: The primary readout would be a reduction in NK cell cytotoxicity against target cells in the presence of Tregs. NK cell cytotoxicity (NK cell cytotoxicity) is commonly assessed by measuring the lysis of target cells, often labeled with fluorescent dyes or radioisotopes, or by quantifying the release of cytotoxic molecules like perforin and granzyme B and CD107a (can be tested using a CD107a degranulation assay). Inhibition could also be assessed by evaluating the impact of Tregs on NK cell activation markers or cytokine production (e.g., IFN-γ).
Co-culture Ratios: Optimizing the effector-to-target (E:T) cell ratio for NK cell cytotoxicity (NK cell cytotoxicity) and the Treg-to-effector (Treg:NK cell) ratio would be critical to establish a detectable suppressive effect.
Controls: Essential controls would include:
NK cells + target cells (to establish baseline cytotoxicity)
Tregs + target cells (to ensure Tregs do not directly lyse target cells)
Target cells alone (for spontaneous lysis)
NK cells + target cells + irrelevant cell type (to control for non-specific cellular interactions).
Fixation/Permeabilization: If intracellular markers (e.g., FOXP3) are to be analyzed in parallel to assess Treg phenotype during the assay, the chosen fluorochromes must be compatible with fixation and permeabilization buffers.
Viability Assessment: Cell viability should be monitored throughout the assay to ensure that observed effects are not due to cell death, particularly for NK cells after co-culture (NK and Treg cell co-culture model).
While a direct protocol is not provided, the general requirements for such an assay align with the detailed discussion on cell isolation, phenotypic characterization, and functional assessment of NK cells and Tregs found within the provided research. For example, the detailed high dimensional flow cytometry panels for NK cells and general immune system phenotyping highlight the complexity and precision required for comprehensive immune cell analysis, which would be essential for validating the phenotype of isolated cells before and after the co-culture. The understanding of FOXP3 stability and function in Tregs would also be crucial for interpreting the suppressive capacity of the Treg population in such an assay.
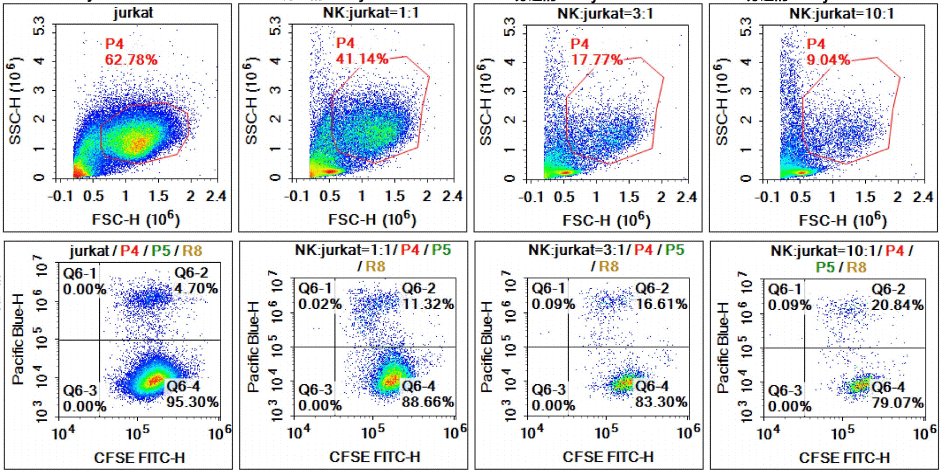
Fig. 5 NK cell-mediated killing of Jurkat cells in co-culture system. Splenocytes were isolated from C57BL/6 mice via the EasySort™ Mouse NK Cell Isolation Kit (Cat. No. MIM005N). Subsequently, purified NK cells were co-cultured with Jurkat cells at different effector-to-target (E:T) ratios of 1:1, 3:1 and 10:1 to evaluate the cytotoxic effect of NK cells against Jurkat cells. Combined with the results of CFSE/DAPI double staining and viable cell distribution presented in FSC-SSC dot plots, we confirmed that elevated NK cell ratios led to enhanced cytotoxic activity, accompanied by a decreased number of surviving Jurkat cells.
Elabscience® Quick Overview of Popular Products:
Table 9. Reagents for NK Cell Research
|
Product Name |
Cat. No. |
|
PE Anti-Mouse CD161/NK1.1 Antibody[PK136] |
E-AB-F0987D |
|
APC Anti-Mouse CD49b/pan-NK cells Antibody[DX5] |
E-AB-F1116E |
|
EasySort™ Mouse NK Cell Isolation Kit |
MIM005N |
|
CFSE Cell Division Tracker Kit |
E-CK-A345 |
|
DAPI Reagent (25μg/mL) |
E-CK-A163 |
|
10×ACK Lysis Buffer |
E-CK-A105 |
|
10× RBC Lysis/Fixation Solution |
E-CK-A106 |
References:
[1] SantaCruz-Calvo S, Bharath L, Pugh G, et al. Adaptive immune cells shape obesity-associated type 2 diabetes mellitus and less prominent comorbidities[J]. Nature Reviews Endocrinology, 2022, 18(1): 23-42.
[2] Bähr I, Spielmann J, Quandt D, et al. Obesity-associated alterations of natural killer cells and immunosurveillance of cancer[J]. Frontiers in immunology, 2020, 11: 245.
[3] Wouters K, Kusters Y H A M, Bijnen M, et al. NK cells in human visceral adipose tissue contribute to obesity‐associated insulin resistance through low‐grade inflammation[J]. Clinical and Translational Medicine, 2020, 10(6): e192.
[4] Sieben A, Hausen A C, Klemm P, et al. P2Y6 receptor signaling in natural killer cells impairs insulin sensitivity in obesity[J]. bioRxiv, 2021: 2021.06. 23.449596.
[5] De Barra C, Khalil M, Mat A, et al. Glucagon‐like peptide‐1 therapy in people with obesity restores natural killer cell metabolism and effector function[J]. Obesity, 2023, 31(7): 1787-1797.
[6] Yilmazer A, Zevla D M, Kretschmer K. Regulatory T cell transdifferentiation as a driver of obesity and diabetes[J]. Frontiers in Immunology, 2025, 16: 1698285.
[7] Li Y, Lu Y, Lin S H, et al. Insulin signaling establishes a developmental trajectory of adipose regulatory T cells[J]. Nature immunology, 2021, 22(9): 1175-1185.
[8] Wang Y, Li M, Chen L, et al. Natural killer cell-derived exosomal miR-1249-3p attenuates insulin resistance and inflammation in mouse models of type 2 diabetes[J]. Signal Transduction and Targeted Therapy, 2021, 6(1): 409.
[9] Satoh M, Iwabuchi K. Contribution of NKT cells and CD1d-expressing cells in obesity-associated adipose tissue inflammation[J]. Frontiers in immunology, 2024, 15: 1365843.
[10] Thomas A. L .Mammalian models of diabetes mellitus, with a focus on type 2 diabetes mellitus[J].Nature reviews. Endocrinology, 2023.DOI:10.1038/s41574-023-00818-3.
[11] Spielmann J , Naujoks W , Emde M ,et al.High-Fat Diet and Feeding Regime Impairs Number, Phenotype, and Cytotoxicity of Natural Killer Cells in C57BL/6 Mice[J].Frontiers in Nutrition, 2020.DOI:10.3389/fnut.2020.585693.
[12] DE BARRA C, O’SHEA D, HOGAN A E. NK cells vs. obesity: A tale of dysfunction & redemption[J]. Clinical Immunology, 2023, 255: 109744.
[13] ELKINS C, LI C. Deciphering visceral adipose tissue regulatory T cells: Key contributors to metabolic health[J]. Immunological Reviews, 2024, 324(1): 52-67.
[14] MORITA Y, SENOKUCHI T, YAMADA S, et al. Impact of tissue macrophage proliferation on peripheral and systemic insulin resistance in obese mice with diabetes[J]. BMJ Open Diabetes Research & Care, 2020, 8(1): e001578.
[15] EAD A S, WIRKUS J, MATSUKUMA K, et al. A high-fat diet induces changes in mesenteric adipose tissue accelerating early-stage pancreatic carcinogenesis in mice[J]. The Journal of Nutritional Biochemistry, 2024, 131: 109690.
[16] PEPPI P F, LIRA G A, CAMPOS L R S, et al. Liver under attack: impacts of high-fat diet on murine model[J]. Brazilian Journal of Biology, 2024, 84. http://dx.doi.org/10.1590/1519-6984.284045. DOI:10.1590/1519-6984.284045.
[17] KIM H Y, YOON J J, LEE H K, et al. Blackcurrant Improves Diabetic Cardiovascular Dysfunction by Reducing Inflammatory Cytokines in Type 2 Diabetes Mellitus Mice[J]. Nutrients, 2021, 13(11): 4177.
[18] DEIULIIS J, SHAH Z, SHAH N, et al. Visceral Adipose Inflammation in Obesity Is Associated with Critical Alterations in Tregulatory Cell Numbers[J]. PLoS ONE, 2011, 6(1): e16376.
[19] Kim W J , Kil B J , Lee C ,et al.B. longum CKD1 enhances the efficacy of anti-diabetic medicines through upregulation of IL- 22 response in type 2 diabetic mice[J].Gut Microbes, 2024, 16(1).DOI:10.1080/19490976.2024.2319889.
[20] HUI Y, KUANG L, ZHONG Y, et al. High glucose impairs cognitive function through inducing mitochondrial calcium overload in Treg cells[J]. iScience, 2024, 27(1): 108689.
[21] OSUNA-ESPINOZA K Y, ROSAS-TARACO A G. Metabolism of NK cells during viral infections[J]. Frontiers in Immunology, 2023, 14. http://dx.doi.org/10.3389/fimmu.2023.1064101. DOI:10.3389/fimmu.2023.1064101.
[22] ZHU J, YANG W, ZHOU X, et al. High Glucose Enhances Cytotoxic T Lymphocyte-Mediated Cytotoxicity[J]. Frontiers in Immunology, 2021, 12. http://dx.doi.org/10.3389/fimmu.2021.689337. DOI:10.3389/fimmu.2021.689337.
[23] PICARD L K, NIEMANN J A, LITTWITZ-SALOMON E, et al. Restriction of Glycolysis Increases Serial Killing Capacity of Natural Killer Cells[J]. International Journal of Molecular Sciences, 2024, 25(5): 2917.
[24] WOLF N K, KISSIOV D U, RAULET D H. Roles of natural killer cells in immunity to cancer, and applications to immunotherapy[J]. Nature Reviews Immunology, 2022, 23(2): 90-105.
[25] WANG Q, GUO W, NIU L, et al. 3D‐hUMSCs Exosomes Ameliorate Vitiligo by Simultaneously Potentiating Treg Cells‐Mediated Immunosuppression and Suppressing Oxidative Stress‐Induced Melanocyte Damage[J]. Advanced Science, 2024, 11(31). http://dx.doi.org/10.1002/advs.202404064. DOI:10.1002/advs.202404064.
[26] ZAPPASODI R, SERGANOVA I, COHEN I J, et al. CTLA-4 blockade drives loss of Treg stability in glycolysis-low tumours[J]. Nature, 2021, 591(7851): 652-658.
[27] CHEN Z, TONG L, NEO S Y, et al. CD25brightNK cells display superior function and metabolic activity under regulatory T cell-mediated suppression[J]. OncoImmunology, 2023, 12(1). http://dx.doi.org/10.1080/2162402X.2023.2175517. DOI:10.1080/2162402x.2023.2175517.
[28] LI X, DING B, ZHENG P, et al. Advanced nanomaterials for enhanced immunotherapy via metabolic regulation[J]. Coordination Chemistry Reviews, 2024, 500: 215540.
[29] ZHANG Y, WANG Z, LU Y, et al. Region‐Specific CD16+ Neutrophils Promote Colorectal Cancer Progression by Inhibiting Natural Killer Cells[J]. Advanced Science, 2024, 11(29). http://dx.doi.org/10.1002/advs.202403414. DOI:10.1002/advs.202403414.
[30] HAASE D, PUAN K J, STARKE M, et al. Large-scale Isolation of Highly Pure “Untouched” Regulatory T Cells in a GMP Environment for Adoptive Cell Therapy[J]. Journal of Immunotherapy, 2015, 38(6): 250-258.
[31] SAKSIDA T, PAUNOVIĆ V, KOPRIVICA I, et al. Development of Type 1 Diabetes in Mice Is Associated with a Decrease in IL-2-Producing ILC3 and FoxP3+ Treg in the Small Intestine[J]. Molecules, 2023, 28(8): 3366.
[32] XIANG Y, WANG J, LI J P, et al. MKL-1 is a coactivator for STAT5b, the regulator of Treg cell development and function[J]. Cell Communication and Signaling, 2020, 18(1). http://dx.doi.org/10.1186/s12964-020-00574-1. DOI:10.1186/s12964-020-00574-1.
[33] BROWN M E, PETERS L D, HANBALI S R, et al. Human CD4+CD25+CD226- Tregs Demonstrate Increased Purity, Lineage Stability, and Suppressive Capacity Versus CD4+CD25+CD127lo/- Tregs for Adoptive Cell Therapy[J]. Frontiers in Immunology, 2022, 13. http://dx.doi.org/10.3389/fimmu.2022.873560. DOI:10.3389/fimmu.2022.873560.
[34] PELLEGRINO M, TRAVERSI G, ARENA A, et al. Effect of p53 activation through targeting MDM2/MDM4 heterodimer on T regulatory and effector cells in the peripheral blood of Type 1 diabetes patients[J]. PLOS ONE, 2020, 15(1): e0228296.
[35] HAASE D, PUAN K J, STARKE M, et al. Large-scale Isolation of Highly Pure “Untouched” Regulatory T Cells in a GMP Environment for Adoptive Cell Therapy[J]. Journal of Immunotherapy, 2015, 38(6): 250-258.

