

One-step TUNEL flow cytometry-based apoptosis assay is a rapid, quantitative apoptosis detection methods designed for research applications. It utilizes TdT enzyme to directly link fluorescently labeled dUTP to the 3’-OH ends of fragmented DNA in apoptotic cells, eliminating the need for secondary antibody incubation. Detection of late-stage apoptosis in suspension or adherent cells can be completed in 2.5-3 hours. This method offers multicolor fluorescence options that can be flexibly adapted to different flow cytometry channels. It supports combined multi-parameter analysis of cell cycle and apoptosis in specific cell subsets when used in conjunction with PI or surface marker antibodies. With sensitivity far exceeding that of conventional biochemical assays, it is the mainstream flow cytometry solution in the field of apoptosis research.
This review systematically elaborates on the overview of apoptosis mechanisms and common detection methods, followed by a detailed explanation of how the TUNEL assay identifies apoptotic cells at the molecular level. It then discusses the selection of fluorescent labels for TUNEL assays, covering green, red, and blue options to suit different experimental needs, and further explores multiplex detection of apoptosis using red fluorescent TUNEL in combination with cell-type markers for enhanced specificity. Finally, the review addresses TUNEL-based analysis of immune cell apoptosis, highlighting its application in immunology research.
Table of Contents
1. Overview of apoptosis mechanisms and common detection methods
2. How does the TUNEL assay identify apoptotic cells?
3. Choosing fluorescent labels for TUNEL assays: green, red, and blue options
4. Multiplex detection of apoptosis using Red Fluorescent TUNEL and cell-type markers
5. TUNEL-based analysis of Immune cell apoptosis
01 Overview of apoptosis mechanisms and common detection methods
Apoptosis is a genetically programmed, energy-dependent form of cell death that eliminates damaged, redundant, or potentially dangerous cells without triggering inflammation, fundamentally distinct from the chaotic lysis seen in necrosis[1,2].
Apoptosis is executed by a family of cysteine proteases called caspases (cysteine-aspartate-specific proteases), which systematically dismantle the cell. The process is initiated through two principal routes that ultimately converge on the same executioner machinery.
1.1 The Extrinsic (Death Receptor) Pathway
This pathway is triggered by extracellular death signals. Members of the tumor necrosis factor (TNF) receptor subfamily, including TNFRI, CD95/Fas, and TRAILR, are stimulated at the cell surface by their cognate ligands (TNF-α, FasL, TRAIL). Ligand binding induces receptor trimerization and assembly of the death-inducing signaling complex (DISC), which recruits and activates the initiator caspase-8. Active caspase-8 then directly cleaves and activates downstream effector caspases[1.2].
1.2 The Intrinsic (Mitochondrial) Pathway
The intrinsic pathway responds to intracellular stress signals, DNA damage, endoplasmic reticulum stress, metabolic stress, UV radiation, or growth-factor deprivation. The central decision point is governed by the Bcl-2 protein family, which contains both pro-apoptotic (Bax, Bak, BH3-only proteins) and anti-apoptotic (Bcl-2, Bcl-xL) members. Their relative balance determines whether the cell lives or dies[1.2].
When pro-apoptotic signals dominate, Bax and Bak oligomerize in the mitochondrial outer membrane, causing mitochondrial outer membrane permeabilization (MOMP), the central irreversible event of this pathway. MOMP releases cytochrome c into the cytosol, where it assembles with Apaf-1 into the apoptosome, which activates initiator caspase-9.
1.3 Convergence on Effector Caspases
Both pathways converge at the activation of effector caspases (primarily caspase-3 and caspase-7), which carry out the ordered demolition of the cell. These enzymes cleave hundreds of cellular substrates, producing the hallmark morphological changes: cell shrinkage, chromatin condensation, membrane blebbing, and packaging of cellular contents into membrane-bound apoptotic bodies. Importantly, phosphatidylserine (PS), normally confined to the inner leaflet of the plasma membrane, is externalized as an “eat-me” signal, allowing rapid phagocytic clearance without inflammation[1.2].
A third pathway involves cytotoxic granules (perforin/granzyme) from cytotoxic T cells and NK cells, which can directly activate caspases inside target cells.
Because apoptosis unfolds as a temporal cascade of distinct molecular events, detection strategies target different stages of this process. The choice of method depends on whether one needs to detect early, intermediate, or late apoptosis and each approach has inherent advantages and limitations.
Table 1. Common detection methods of cell apoptosis
|
Detection Target |
Method |
Mechanism Detected |
Stage |
|
PS externalization |
Annexin V/PI |
Membrane asymmetry loss |
Early |
|
Caspase activation |
Caspase-3/7 activity assays |
Executioner protease activity |
Early–Mid |
|
Mitochondrial damage |
Mitochondrial membrane potential probes (JC-1, TMRE) |
Membrane potential collapse |
Early |
|
DNA fragmentation |
TUNEL assay |
DNA strand breaks with exposed 3′-OH termini |
Late |
|
DNA fragmentation |
DNA ladder assay |
Internucleosomal cleavage |
Late |
|
DNA fragmentation |
Comet assay |
Single/double strand breaks |
Late |
|
Cytochrome c release |
Immunodetection/SPRi |
MOMP event |
Mid |
|
Morphology |
Electron/fluorescence microscopy |
Structural changes |
All stages |
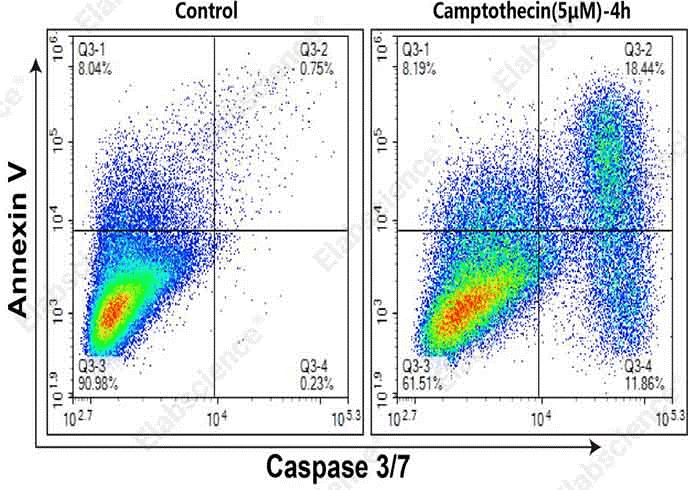
Fig. 1 Detection and analysis of caspase 3/7 and annexin V in apoptotic MOLT-4 cells. MOLT-4 cells were cultured without (Left) or with (Right) 5 μM Camptothecin for 4 h. Annexin V-APC single-positive cells (Q3-1) were early apoptotic cells with phosphatidylserine translocation. Annexin V and Caspase 3/7 double-positive cells (Q3-2) were apoptotic cells with higher Caspase 3/7 activity in early to mid-late Stage. Caspase 3/7 single-positive cells (Q3-4) were early apoptotic cells with caspase 3/7 activation. (The data are provided by Elabscience®.)
Elabscience® Quick Overview of Popular Products:
Table 2. Reagents for research on apoptosis research
|
Product Name |
Cat. No. |
|
Caspase 3/7 and Annexin V Double Staining Apoptosis Kit |
E-CK-A831 |
|
Caspase 3/7 Activity Assay Kit(Colorimetric Method) |
E-CK-A383 |
|
Caspase 3/7 Activity Detection Substrate for Flow Cytometry |
E-CK-A483 |
|
Annexin V Binding Buffer (10×) |
E-CK-A151 |
|
Annexin V-APC Reagent |
E-CK-A117 |
|
Annexin V-FITC/PI Apoptosis Kit |
E-CK-A211 |
|
Annexin V-PE/7-AAD Apoptosis Kit |
E-CK-A216 |
|
One-step TUNEL In Situ Apoptosis Kit (Green, Elab Fluor® 488) |
E-CK-A321 |
|
TUNEL In Situ Apoptosis Kit (HRP-DAB Method) |
E-CK-A331 |
|
One-step TUNEL In Situ Apoptosis Kit (Red, Elab Fluor® 594) |
E-CK-A322 |
|
One-step TUNEL Flow Cytometry Apoptosis Kit (Green, FITC) |
E-CK-A420 |
|
One-step TUNEL Flow Cytometry Apoptosis Kit (Red, Elab Fluor® 647) |
E-CK-A424 |
|
Caspase 8 Activity Detection Substrate for Flow Cytometry |
E-CK-A488 |
|
Caspase 6 Activity Detection Substrate for Flow Cytometry |
E-CK-A486 |
|
Caspase 9 Activity Assay Kit(Colorimetric Method) |
E-CK-A389 |
|
Caspase 9 Activity Detection Substrate for Flow Cytometry |
E-CK-A489 |
02 How does the TUNEL assay identify apoptotic cells?
An important hallmark of late‑stage apoptosis is DNA fragmentation. Terminal deoxynucleotidyl transferase (TdT) catalyzes the incorporation of fluorochrome‑labeled dUTP onto the exposed 3’‑OH termini of fragmented DNA, and the labeled signals can be visualized using fluorescence microscopy or flow cytometry. This approach is also referred to as the one‑step method, which features high detection sensitivity, straightforward readouts, and convenient experimental operation[3].
When exposed 3’‑OH termini are labeled with biotin‑labeled dUTP (Biotin‑dUTP) in a TdT‑dependent reaction, subsequent binding to HRP‑conjugated streptavidin (Streptavidin‑HRP) enables signal development via DAB chromogenic reaction catalyzed by HRP; apoptotic cells can thereby be visualized under conventional light microscopy[2,3].
The mechanistic workflow of this technique is described below:
1) Sample preparation: Cells or tissue sections are fixed (typically with 4 % paraformaldehyde), followed by permeabilization (e.g., using Triton X‑100 or proteinase K).
2) Creation of DNA breaks: In apoptotic cells, endogenous endonucleases cleave genomic DNA into ~180 bp oligonucleosomal fragments, generating numerous free 3’‑OH ends along the DNA backbone.
3) Labeling reaction: Samples are incubated with terminal deoxynucleotidyl transferase (TdT) together with a tagged nucleotide analog, most commonly fluorescein‑dUTP, digoxigenin‑dUTP, or biotin‑dUTP.
4) Detection: If fluorophore‑conjugated dUTP is applied, apoptotic nuclei exhibit bright fluorescent signals. After cell suspension and labeling, fluorescence intensity is measured for individual cells to permit quantitative evaluation of the apoptotic proportion. If digoxigenin or biotin labeling is used, secondary enzyme‑conjugated antibodies (e.g., HRP‑anti‑digoxigenin) are applied, and subsequent incubation with chromogenic substrates produces visible precipitates.
5) Data interpretation: A positive TUNEL signal indicates apoptotic cells (appropriate controls should exclude extensive DNA damage arising from necrosis), whereas a negative signal corresponds to non‑apoptotic cells.
Limitations:
Necrosis can also produce DNA breaks, particularly during late‑stage secondary necrosis, which may result in false‑positive TUNEL staining. For this reason, TUNEL assays are frequently combined with morphological features (cell shrinkage, chromatin condensation) or additional apoptotic markers (e.g., cleaved caspase‑3) to achieve definitive identification of apoptotic cells.
Fixation artifacts: Over‑fixation may mask 3′‑OH termini and reduce assay sensitivity; under‑fixation may sustain endogenous nuclease activity and introduce artifactual DNA breaks.
Enzyme source: TdT derived from different sources (calf thymus, recombinant protein) exhibits variable catalytic efficiency; therefore, optimization of enzyme concentration and incubation duration is generally required.
The TUNEL assay kit detects apoptotic cells by enzymatically labeling abundant 3′‑OH DNA termini generated during apoptotic DNA fragmentation. The label, fluorescent, biotinylated, or digoxigenin‑conjugated, serves as a visual or quantitative readout, enabling researchers to identify and enumerate apoptotic cells in nearly all cell types and tissue contexts.
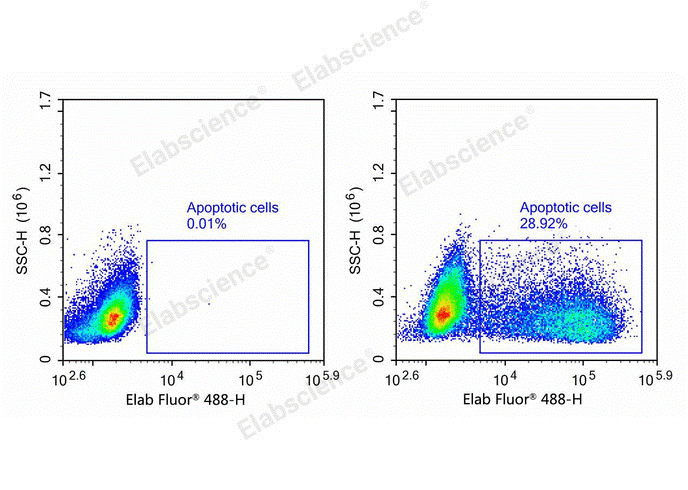
Fig. 2 Flow cytometry analysis of camptothecin‑induced apoptosis in Jurkat cells. Jurkat cells were treated with 5 μM camptothecin for 4 h, followed by staining using the One‑step TUNEL Flow Cytometry Apoptosis Kit (Green, Elab Fluor® 488) (Cat. No. E-CK-A421), and subsequently analyzed via flow cytometry. (The data are provided by Elabscience®.)
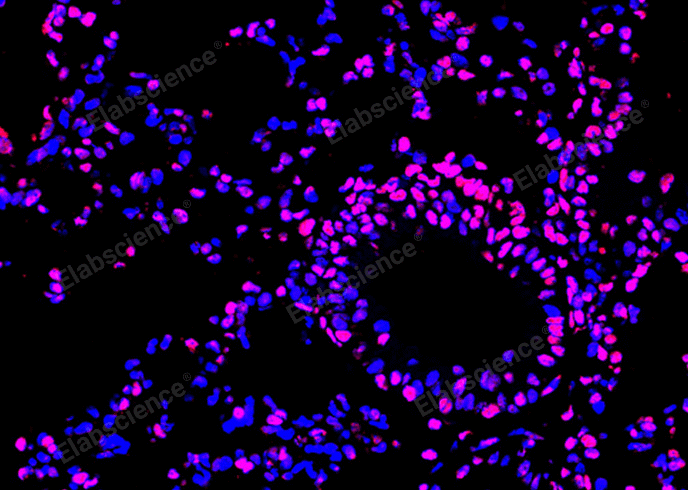
Fig. 3 Apoptosis analysis in paraffin-embedded sections of mouse lung tissue. Paraffin‑embedded mouse lung sections were treated with DNase I to induce DNA fragmentation, then stained with the One-step TUNEL In Situ Apoptosis Kit (Red, Elab Fluor® 647) (Cat. No. E-CK-A324). Samples with DNA strand breaks exhibited intense fluorescent signals (red) in DNase I‑treated groups. Nuclei were counterstained with DAPI (blue). Images were acquired using a confocal microscope. (The data are provided by Elabscience®.)
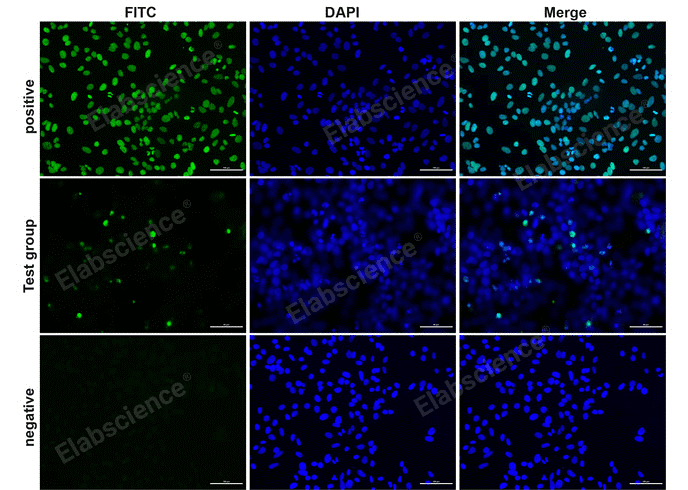
Fig. 4 Fluorescence microscope analysis of camptothecin-induced apoptosis of HeLa cells. HeLa cells were treated with 10 μM camptothecin for 20 h, followed by staining using the One-step TUNEL In Situ Apoptosis Kit (Green, FITC) (Cat. No. E-CK-A320), and subsequently analyzed via confocal microscope. (The data are provided by Elabscience®.)
Elabscience® Quick Overview of Popular Products:
Table 3. Reagents used for TUNEL assays
|
Product Name |
Cat. No. |
|
One-step TUNEL In Situ Apoptosis Kit (Green, FITC) |
E-CK-A320 |
|
One-step TUNEL In Situ Apoptosis Kit (Green, Elab Fluor® 488) |
E-CK-A321 |
|
One-step TUNEL In Situ Apoptosis Kit (Red, Elab Fluor® 594) |
E-CK-A322 |
|
One-step TUNEL In Situ Apoptosis Kit (Blue, EV450) |
E-CK-A323 |
|
One-step TUNEL In Situ Apoptosis Kit (Red, Elab Fluor® 647) |
E-CK-A324 |
|
One-step TUNEL In Situ Apoptosis Kit (Red, Elab Fluor® 555) |
E-CK-A325 |
|
TUNEL In Situ Apoptosis Kit (HRP-DAB Method) |
E-CK-A331 |
|
One-step TUNEL Flow Cytometry Apoptosis Kit (Green, FITC) |
E-CK-A420 |
|
One-step TUNEL Flow Cytometry Apoptosis Kit (Green, Elab Fluor® 488) |
E-CK-A421 |
|
One-step TUNEL Flow Cytometry Apoptosis Kit (Red, Elab Fluor® 594) |
E-CK-A422 |
|
One-step TUNEL Flow Cytometry Apoptosis Kit (Blue, Elab Fluor® Violet 450) |
E-CK-A423 |
|
One-step TUNEL Flow Cytometry Apoptosis Kit (Red, Elab Fluor® 647) |
E-CK-A424 |
|
One-step TUNEL Flow Cytometry Apoptosis Kit (Red, Elab Fluor® 555) |
E-CK-A425 |
03 Choosing fluorescent labels for TUNEL assays: green, red, and blue options
Fluorescent label selection for TUNEL assays primarily relies on matching the emission wavelength of labeled dUTP probes to the overall experimental design, with particular consideration of counterstains, co-staining markers, and the spectral filter sets of available microscopes. The three mainstream spectral channels (green, red, and blue) exhibit unique advantages and technical limitations for TUNEL staining.
Elab Fluor® 488 (EF488) and FITC-based TUNEL staining are among the most widely used labeling strategies, as most conventional fluorescence microscopes and flow cytometers are equipped with a 488 nm argon laser, enabling simple and efficient signal detection. Green-channel TUNEL signals exhibit no spectral overlap with red-emitting counterstains and are well compatible with blue nuclear dyes, including DAPI and Hoechst 33342. Specifically, the maximum emission wavelength of DAPI (461 nm) is distinctly separated from that of EF488 (519 nm), ensuring effective signal differentiation. Additionally, green TUNEL labeling can be combined with far-red-conjugated antibodies against cleaved caspase-3 for dual-target detection. Nevertheless, the blue-green spectral region is highly susceptible to tissue autofluorescence. Quantitative analyses have demonstrated that imaging systems utilizing blue-green fluorophores (e.g., EF488) generate background signals up to one order of magnitude higher than red/far-red imaging systems. Accordingly, rigorous background subtraction is indispensable for green TUNEL detection in tissue sections rich in lipofuscin or collagen, which exhibit strong intrinsic autofluorescence.
Red-channel TUNEL staining allows co-imaging with GFP-expressing cells (emission at ~509 nm) without spectral interference, thus enabling specific tracking of apoptotic cells within genetically labeled cell populations. Moreover, red fluorophores effectively reduce background noise, given that tissue autofluorescence decreases markedly at wavelengths exceeding 600 nm. This unique property renders Elab Fluor® 594-based TUNEL staining particularly suitable for thick tissue sections, paraffin-embedded specimens, and other biological samples with prominent green autofluorescence. However, a critical technical artifact requires careful attention in red TUNEL assays: DAPI photoconversion. UV irradiation can transform DAPI and Hoechst dyes into photoconverted derivatives that emit both green and red fluorescence. Notably, this red fluorescent artifact can be induced within 10 seconds of UV exposure and typically presents stronger intensity than green photoconversion signals. Therefore, minimizing UV exposure time is essential during red TUNEL staining with DAPI counterstaining to prevent false-positive signals and spectral bleed-through in the red channel.
Blue fluorophores offer superior performance for multiplexed imaging. Elab Fluor® Violet 450 (EV450) occupies a distinct spectral window with negligible overlap with conventional green (GFP/EF488) and red (EF594/Texas Red) channels. This spectral independence makes EV450 an optimal choice for multi-target labeling, such as the simultaneous detection of TUNEL signals (blue) and cleaved caspase-3 immunofluorescence (green) in a single tissue section. Furthermore, blue fluorescent labels feature extremely low tissue autofluorescence, which substantially improves the signal-to-noise ratio (SNR) of imaging results.
For multiplexed experimental design, a core principle is to pair the brightest fluorophores with the least abundant biological targets to guarantee valid signal detection against background noise. In TUNEL assays, signal intensity is positively correlated with the extent of DNA fragmentation. Cells with severe late-stage apoptosis produce robust fluorescent signals irrespective of fluorophore type. In contrast, early apoptotic cells with limited DNA fragmentation require bright, red-shifted fluorophores with low intrinsic background to achieve reliable and sensitive detection.
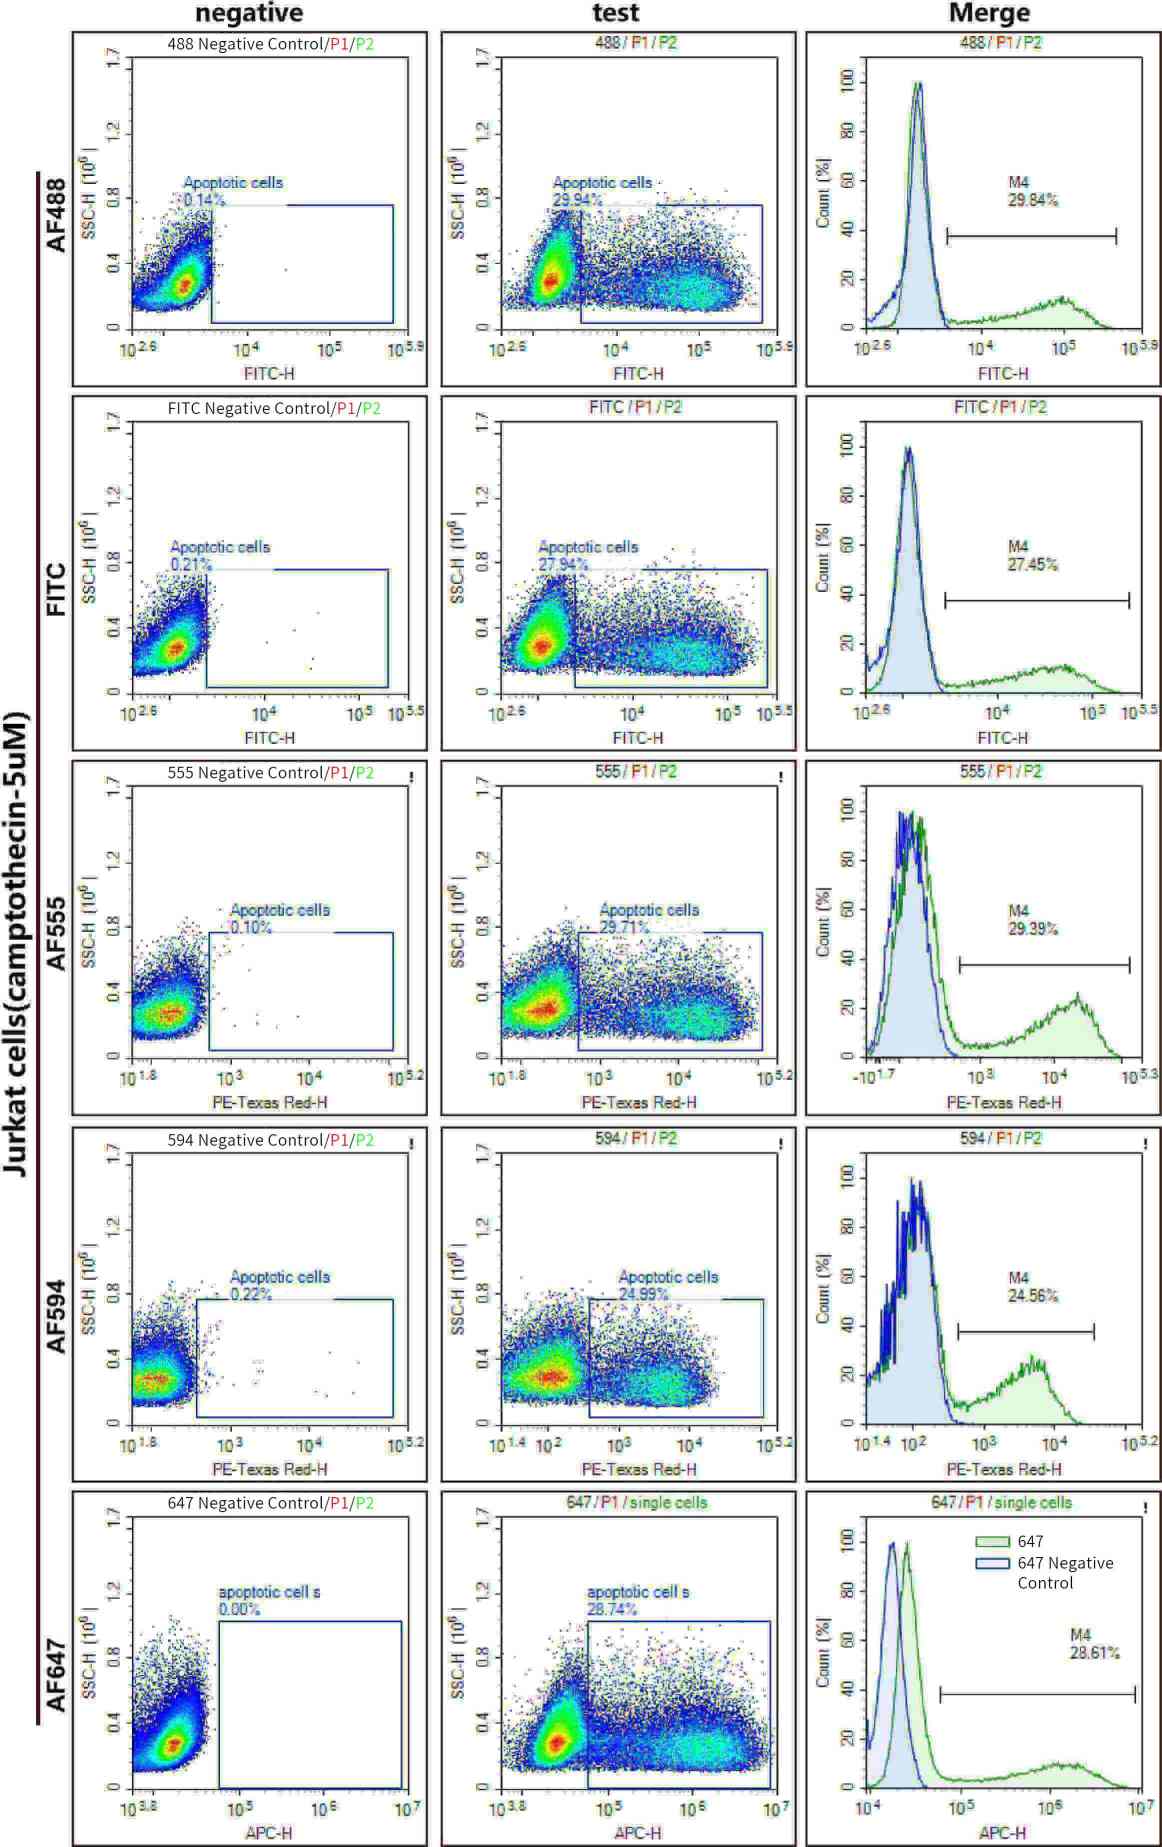
Fig. 5 Flow cytometry analysis of camptothecin-induced apoptosis in Jurkat cells. Jurkat cells were treated with 5 μM camptothecin for 4 h, followed by staining using the One‑step TUNEL Flow Cytometry Apoptosis Kit of different fluorescent labels (green, red, orange and blue), and subsequently analyzed via flow cytometry. (The data are provided by Elabscience®.)
Elabscience® Quick Overview of Popular Products:
Table 4. Reagents for research on tunel assay flow cytometry
|
Product Name |
Cat. No. |
|
One-step TUNEL Flow Cytometry Apoptosis Kit (Green, FITC) |
E-CK-A420 |
|
One-step TUNEL Flow Cytometry Apoptosis Kit (Green, Elab Fluor® 488) |
E-CK-A421 |
|
One-step TUNEL Flow Cytometry Apoptosis Kit (Red, Elab Fluor® 594) |
E-CK-A422 |
|
One-step TUNEL Flow Cytometry Apoptosis Kit (Blue, Elab Fluor® Violet 450) |
E-CK-A423 |
|
One-step TUNEL Flow Cytometry Apoptosis Kit (Red, Elab Fluor® 647) |
E-CK-A424 |
|
One-step TUNEL Flow Cytometry Apoptosis Kit (Red, Elab Fluor® 555) |
E-CK-A425 |
|
One-step TUNEL In Situ Apoptosis Kit (Green, FITC) |
E-CK-A320 |
|
One-step TUNEL In Situ Apoptosis Kit (Green, Elab Fluor® 488) |
E-CK-A321 |
|
One-step TUNEL In Situ Apoptosis Kit (Red, Elab Fluor® 594) |
E-CK-A322 |
|
One-step TUNEL In Situ Apoptosis Kit (Blue, EV450) |
E-CK-A323 |
|
One-step TUNEL In Situ Apoptosis Kit (Red, Elab Fluor® 647) |
E-CK-A324 |
|
One-step TUNEL In Situ Apoptosis Kit (Red, Elab Fluor® 555) |
E-CK-A325 |
|
TUNEL In Situ Apoptosis Kit (HRP-DAB Method) |
E-CK-A331 |
04 Multiplex detection of apoptosis using Red Fluorescent TUNEL and cell-type markers
This method uses red-fluorescently labeled dUTP as the core probe. Through the specific labeling of the 3'-OH ends of fragmented DNA in apoptotic cells by TdT enzyme, combined with cell-type-specific labeling antibodies, it enables multiplex detection for “precise cell subtype classification and quantitative assessment of apoptotic status.” The low spontaneous background of red fluorescence makes it particularly well-suited for multiparameter analysis of complex samples such as tissue sections and immune cells.
4.1 Standardized Operating Procedures (tunel assay protocol)
(1) Sample Preparation: Immune cells or tissue sections are fixed in 4% paraformaldehyde at room temperature for 15–20 minutes, then washed three times with PBS for 5 minutes each time.
(2) Permeabilization: Add 0.2% Triton X-100 and allow to permeabilize at room temperature for 5–10 minutes; wash thoroughly with PBS to remove residual permeabilization solution.
Note: Proteinase K treatment markedly diminishes the antigenicity of cellular markers, which results in impaired antibody binding during flow cytometry, attenuated fluorescence signals, and even false-negative results. Accordingly, for TUNEL and antibody co-staining, cells should be permeabilized using PBS supplemented with 0.1% Triton X-100.
(3) Cell Marker Antibody Incubation: Add dropwise pre-titrated, non-red-fluorescent cell-type-specific antibodies; incubate at room temperature in the dark for 30 minutes; wash twice after subtype labeling is complete.
(4) Red Fluorescent TUNEL Labeling: Add the pre-mixed red fluorescent TUNEL reaction working solution. Incubate in a humidified chamber at 37°C, protected from light, for 60 minutes. Wash three times with PBS.
(5) Nuclear counterstaining and mounting: Add the DAPI working solution and counterstain for 5 minutes at room temperature, protected from light. After rinsing, mount with an anti-fade mounting medium, then image or analyze by flow cytometry.
4.2 Key Precautions
(1) Fluorescence Spectrum Matching: Red-fluorescent TUNEL (e.g., EF647/EF594/EF555) must be paired with blue/green-fluorescently labeled cell-type antibodies; spectral overlap must be <5% to completely avoid cross-color interference.
(2) Optimized Labeling Sequence: Complete cell surface marker antibody staining before TUNEL labeling when the selected antibodies or epitopes are sensitive to fixation or permeabilization conditions, thereby minimizing potential signal loss during subsequent TUNEL staining.
(3) Background Control: Since the excitation and emission wavelengths of red fluorescence are relatively long, a negative control without TdT enzyme must be set up in advance to subtract the extremely low endogenous autofluorescence background in tissues or cells, ensuring accurate interpretation of apoptosis signals.
(4) Anti-quenching Adaptation: Red fluorescence exhibits better resistance to photobleaching than traditional green fluorescence, making it suitable for long-term layer-by-layer scanning in confocal microscopy and continuous imaging in high-content systems. However, operations must still be performed in the dark throughout the process to prevent signal decay caused by prolonged exposure to strong light.
05 TUNEL-Based analysis of Immune Cell apoptosis
For the immunological cell apoptosis analysis based on TUNEL, it is necessary to co-stain TUNEL with the marker antibodies. The tunel assay protocol of this experiment is as follows[4,5]:
5.1 Pre-experimental Preparation
(1) Sample Preparation: Collect 1-2 × 10⁶ immune cells, wash twice with pre-chilled PBS, centrifuge at 300g for 5 minutes, and discard the supernatant to prevent cell clumping.
(2) Reagent Preparation: Prepare the following in advance: 4% paraformaldehyde fixative, PBS permeabilization buffer containing 0.1% Triton X-100, one-step TUNEL reaction mixture (TdT enzyme + fluorescently labeled dUTP, prepare immediately before use), pre-titrated fluorescently labeled immune antibody, and PI staining working solution (containing RNase).
5.2 Step-by-Step Procedure
(3) Cell Fixation: Resuspend the cell pellet in 1 mL of 4% paraformaldehyde, fix at 4°C in the dark for 30 minutes, then centrifuge at 300g for 5 minutes and discard the fixative.
Note: For cell surface markers with low expression levels and those that are sensitive to fixation, cell surface marker antibody staining must be completed before TUNEL labeling to prevent the TdT enzyme from damaging the antibody-antigen binding sites and to minimize signal loss during subtype staining.
(4) Permeabilization: Add 1 mL of PBS containing 0.1% Triton X-100, incubate on an ice bath for 2 minutes, wash twice with PBS, centrifuging at 300g for 5 minutes each time.
Note: Proteinase K treatment markedly diminishes the antigenicity of cellular markers, which results in impaired antibody binding during flow cytometry, attenuated fluorescence signals, and even false-negative results. Accordingly, for TUNEL and antibody co-staining, cells should be permeabilized using PBS supplemented with 0.1% Triton X-100.
(5) TUNEL Labeling Reaction: Discard all supernatant, then add 50 μL of freshly prepared TUNEL reaction mixture. Incubate for 60 minutes in a humidified incubator at 37°C, protected from light. Gently tap the bottom of the tube every 20 minutes to resuspend the cells and prevent uneven labeling due to cell sedimentation. (For detailed information, please refer to the relevant tunel staining kit.)
(6) Stopping and Washing: Add 1.5 mL of TUNEL wash buffer, centrifuge at 300 g for 5 minutes, discard the supernatant, and repeat the washing step twice to thoroughly remove unbound free dUTP.
(7) Co-incubation with Labeled Antibody: Add an appropriate volume of the diluted fluorescent-labeled antibody working solution and incubate at room temperature in the dark for 30 minutes to complete the specific staining of immune cell surface markers.
Note: The cell surface staining markers need to be selected from the clones that have been validated using fixed-film breaking assays to avoid situations where the epitopes of clones intended for use with live cells are destroyed after treatment with paraformaldehyde and Triton, resulting in complete loss of signal.
(8) DNA Staining: After washing once with PBS, add 1 ml of PI staining solution and incubate at room temperature in the dark for 30 minutes to complete total DNA staining.
(9) Flow Cytometry Analysis: Centrifuge at 300 g, discard the PI staining solution, and resuspend the cells in 300 μL of PBS. Complete flow cytometry data acquisition within 1 hour, detecting the TUNEL fluorescence signal, antibody fluorescence signal, and PI red fluorescence signal in sequence.
5.3 Experimental Precautions
(1) Permeabilization and Digestion Control: After the proteinase K wash, the sample must be washed three times with PBS; inadequate washing will severely interfere with subsequent labeling reactions. The digestion time must be strictly controlled between 5 and 20 minutes; excessive digestion will destroy cell morphology, while insufficient digestion will prevent the probe from entering the cell nucleus.
(2) Mandatory Control Setup: Three types of controls must be set up simultaneously: a positive control using DNase I to treat normal cells and induce artificial DNA breaks; a negative control in which TdT is completely omitted from the reaction system; and single-fluorescence compensation controls, in which TUNEL fluorescence and antibody fluorescence are labeled separately to rule out nonspecific binding and cross-channel interference.
(3) Reaction Environment Control: Keep the TUNEL incubation in a constant-temperature, humidified chamber at 37°C throughout the entire process. Add water to the gaps in the incubation chamber to maintain humidity; an anti-evaporation film may be used to cover the samples to prevent nonspecific adsorption and false positives caused by drying of the reaction solution.
(4) Antibody Compatibility Verification: Verify in advance that the fluorescence spectrum of the labeled antibody does not overlap with that of TUNEL fluorescence to avoid fluorescence quenching or signal cancellation; if PI is used for counterstaining, reduce the PI concentration to 0.5 μg/ml to prevent quenching of FITC-type green fluorescence.
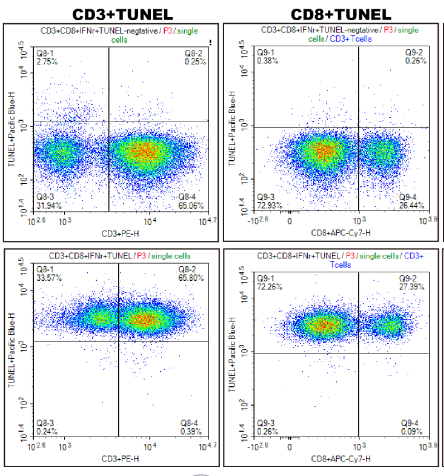
Fig. 6 Flow cytometric analysis of immunophenotypic markers and TUNEL co‑staining in human peripheral blood T cells. Human peripheral blood T cells were treated in the absence (upper panel) or presence (lower panel) of DNase I for DNA fragmentation, stained with PE anti‑human CD3 and APC/Cy7 anti‑human CD8 antibodies, labeled with the One‑step TUNEL Flow Cytometry Apoptosis Kit (blue, Elab Fluor® Violet 450), and analyzed via flow cytometry. (The data are provided by Elabscience®.)
Table 5. Reagents for research on TUNEL-Based analysis of immune cell apoptosis
|
Product Name |
Cat. No. |
|
PE Anti-Human CD3 Antibody[OKT-3] |
E-AB-F1001D |
|
APC/Cyanine 7 Anti-Human CD8a Antibody[HIT8a] |
E-AB-F1271N |
|
One-step TUNEL Flow Cytometry Apoptosis Kit (Blue, Elab Fluor® Violet 450) |
E-CK-A423 |
|
One-step TUNEL Flow Cytometry Apoptosis Kit (Red, Elab Fluor® 647) |
E-CK-A424 |
References:
[1] Otsuki Y , Li Z , Shibata M A .Apoptotic detection methods - From morphology to gene[J].Progress in Histochemistry and Cytochemistry, 2003, 38(3):275-339.DOI:10.1016/S0079-6336(03)80002-5.
[2] Barrett K L, Willingham J M, Garvin A J, et al. Advances in cytochemical methods for detection of apoptosis[J]. Journal of Histochemistry & Cytochemistry, 2001, 49(7): 821-832.
[3] Lebon C , Rodriguez G V , Zaoui I E ,et al.On the use of an appropriate TUNEL assay to identify apoptotic cells.[J].Analytical Biochemistry, 2015, 480.
[4] Ray S K , Schaecher K E , Shields D C ,et al.Combined TUNEL and double immunofluorescent labeling for detection of apoptotic mononuclear phagocytes in autoimmune demyelinating disease[J].Brain Research Protocols, 2000, 5(3):305-311.
[5] Chen M , Wang J , Tu L ,et al.Targeted Radionuclide Therapy With 131I‐Labeled Anti‐PD‐L1 Antibody Suppresses Pharyngeal Squamous Cell Carcinoma in the Animal Model[J].Head & Neck, 2026, 48(6):1409-1415.

