

Table of Contents
1. MTT assay principle and formazan formation
2. How does cell seeding density affect MTT assay results?
3. MTT incubation time and absorbance optimization
4. How do metabolic changes interfere with MTT-based viability assays?
5. MTT assay versus alternative cell viability assays
6. Key takeaways
7. Related resources
Introduction
The MTT assay is routinely read as a direct measure of viable cell number, yet its endpoint reflects reductive capacity (cell number × per-cell metabolic rate), conflating proliferation, metabolic state, and abiotic chemistry in one absorbance value. This article examines formazan generation and accumulation, seeding density effects on linearity and apparent drug potency, incubation time, dye concentration, solubilization effects on readings, metabolic and chemical interference producing false cytotoxicity or survival signals, and comparison with independent endpoints.
So, what should you consider when interpreting and optimizing MTT results?
● Examine formazan generation and accumulation to understand what absorbance reflects.
● Control seeding density to preserve linearity and avoid distorted apparent potency.
● Standardize incubation time, dye concentration, and solubilization for reproducible readings.
● Identify metabolic and chemical interference that can produce false cytotoxicity or survival signals.
● Compare MTT with independent endpoints, including LDH, to distinguish metabolic changes from cell damage.
The key to optimizing MTT results is therefore not simply following a standard protocol. MTT readouts reflect reductive capacity shaped by cell number, metabolic state, and assay conditions, and should be optimized and validated against independent endpoints according to the research question.
01 MTT assay principle and formazan formation
MTT [3-(4, 5-dimethylthiazol-2-yl)-2, 5-diphenyltetrazolium bromide] is a yellow monotetrazolium salt. Originally, its positive charge was thought to carry it across the plasma and mitochondrial inner membranes, with the tetrazole ring cleaved only in active mitochondria; this persists in many protocols but is no longer supported. Reduction yields a violet-blue, insoluble formazan; the MTT cell viability assay reads the optical density of solubilized formazan at about 570 nm[1].
Formazan localizes to cytosolic lipid droplets, not mitochondria or lysosomes, matching logP of 2.0 for MTT versus 4.9 for formazan[2]. Reducing activity is mainly cytosolic and endoplasmic, driven by glycolytic NADH: it rises with glucose, is blocked by cytochalasin B and 2-deoxyglucose, and resists respiratory inhibitors. Ascorbate, thiols, tocopherols and test compounds reduce MTT non-enzymatically[2,3]; see the interference section below.
Three consequences follow. The assay reports reductive capacity, the product of cell number and per-cell metabolic rate, not cell number alone: within a validated range, OD rises linearly with cell number, and activated lymphocytes produced tenfold more formazan per cell than resting cells. It is therefore not a mitochondrial function assay. MTT is not metabolically inert: NADH autofluorescence falls and FAD rises after labeling, recovering in 3 h, and most of the formazan is cleared within 24 h[2,7]. The measurement perturbs the system, so a short, standardized labeling window is essential.
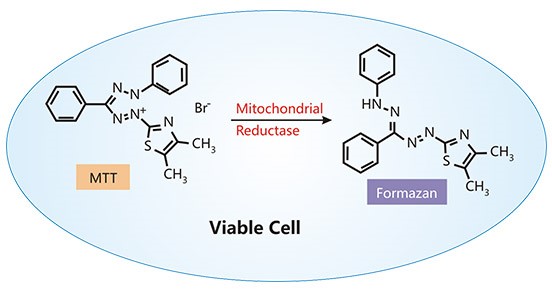
Fig. 1 Schematic illustration of the MTT assay principle. In viable cells, intracellular reductases convert yellow MTT into insoluble purple formazan crystals. The amount of formazan reflects cellular reductive capacity, i.e. cell number × per-cell metabolic rate, rather than cell number alone.
02 How does cell seeding density affect MTT assay results?
The commonly recommended seeding range for 96-well plates is 500 to 10,000 cells per well with a 4 h incubation, although linearity has been reported up to about 10⁶ cells per well in some systems, and short incubations of 2 h are used above 100,000 cells per well[4]; both figures must be confirmed by a standard curve in the laboratory in use and checked against the plate acceptance criteria described below. In PC-3 cells, optical density was not proportional to cell number: doubling from 5,000 to 10,000 cells changed it by only about 5%, whereas doubling from 10,000 to 20,000 raised it by about 39%[1]. High density brings confluence, nutrient depletion, pH drift and formazan saturation; low density risks falling below detection; and cell proximity alters per-cell metabolism, so equal cell numbers can give different signals in vessels of different area[1].
Because signal reflects per-cell metabolism as well as cell number, MTT serves as a cell proliferation assay only where per-cell rate is stable. In doxorubicin-treated HeLa cells, IC₅₀ fell by about 30% at 2.5 μM when seeding density dropped from 100,000 to 12,500 cells cm⁻², since DNA intercalation is division dependent, but the shift was density independent at 5 and 100 μM[5]; such inoculum effects make IC₅₀ protocol dependent.
Generate a standard curve of optical density against cell number for every cell line, serum batch and plate lot, with at least six densities and three replicates, and confirm linearity before calculating percent viability. Seed controls to about 70 to 80% confluence at reading, and shorten treatment beyond 48 h, since proliferating controls otherwise plateau while inhibited wells stay linear. Suspension lines need higher densities, such as 5 × 10⁵ HL60 cells per well[6]. Acceptable screening performance should meet a Z′ factor of at least 0.5, with a coefficient of variation of 15% or less in vehicle and maximum-lysis controls; Z′ rather than raw OD is the criterion that separates a usable screen from an uninterpretable one. Exclude or fill outermost wells, and subtract cell-free blanks before any calculation.
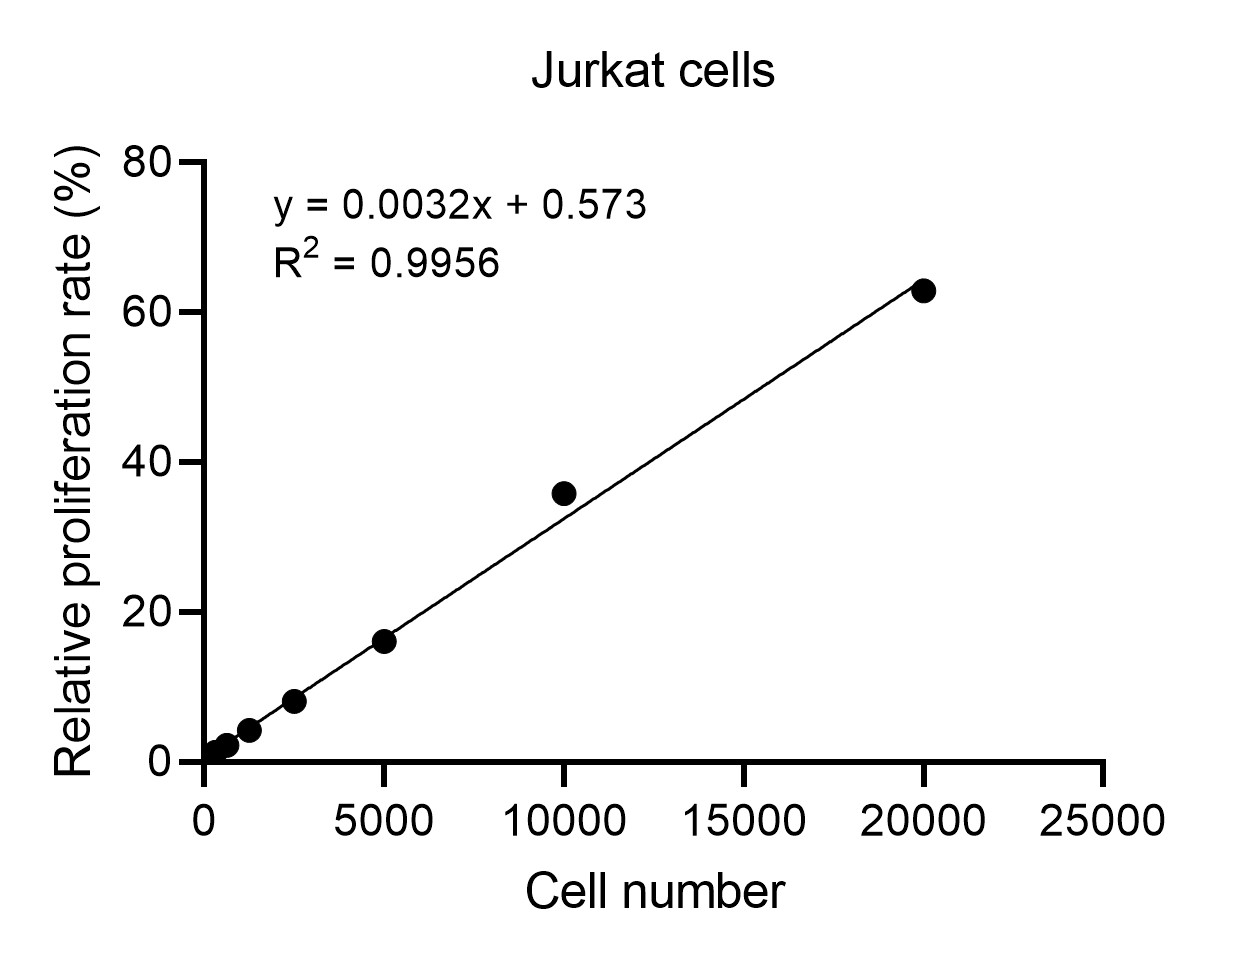
Fig. 2 Linear relationship between seeding density and relative proliferation rate of Jurkat cells. Jurkat cells were seeded at the indicated numbers (0–2.5 × 10⁴ cells/well) and cultured for 24 h, followed by MTT assay. (The data are provided by Elabscience®)
03 MTT incubation time and absorbance optimization
The MTT assay protocol (E-CK-A341) dilutes the MTT stock (5×) 1:5 to 1× working solution, prepared fresh in the dark, and adds 50 μL to 100 μL of cell suspension for 4 h under culture conditions; literature protocols typically use a final MTT concentration of 0.2–0.5 mg/mL, with the incubation shortened to 2 h above 100,000 cells per well[4]. Both are cell line specific: 0.25 mg/mL for 4 h gave the highest signal in HEK293T and HL60 cells, while 1 to 2 mg/mL lowered it[6]; PC-3 signal plateaued at 0.4 mg/mL[1]. Optimize the conditions in a preliminary experiment first.
MTT is cytotoxic: in SH-SY5Y cells, by 120 min most cells carried needle crystals and over 70% were trypan blue positive[7], so one protocol used 50 to 70 min[8]. Signal is nearly linear from 0.5 to 2 h[8].
Solubilize with 100 μL Formazan Dissolution Buffer for 1 to 4 h at 37 °C, or centrifuge, remove supernatant and add 150 μL DMSO; alternatives are acidified isopropanol, 10 min DMSO, SDS-HCl[4] and 90:60 DMSO:SDS[6]. Keep the total working volume per well within 300 μL so that the reading is not limited by evaporation or by exceeding the plate’s capacity.
Confirm dissolution, remove bubbles and read at 570 nm within 1 h; the spectrum is matrix dependent. Skip washing by default; change medium before MTT if reducing agents are present.
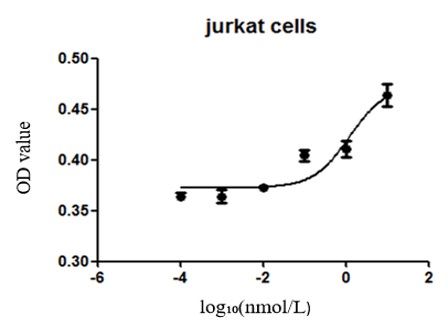
Fig. 3 Effect of camptothecin on Jurkat cell viability determined by MTT assay. Jurkat cells were treated with camptothecin at the indicated concentrations and cell viability was assessed by MTT assay with absorbance read at 570 nm. Camptothecin reduced Jurkat cell viability in a concentration-dependent manner, indicating that the MTT assay reliably reflects the antiproliferative effect of camptothecin on Jurkat cells.
Assay Used for This Experiment:
MTT Cell Proliferation and Cytotoxicity Assay Kit
Cat. No.: E-CK-A341
Sample Type: Cell samples
Detection Instrument: Microplate reader
A colorimetric assay for evaluating cellular metabolic activity and viability-related changes.
Explore the MTT Assay Kit Used in 84 Publications →
04 How do metabolic changes interfere with MTT-based viability assays?
MTT reports metabolic enzyme activity, not viable cell number; any treatment altering metabolic flux, oxidoreductase activity, dye uptake or formazan trafficking shifts signal independently of viability. This is the central limitation of the MTT cytotoxicity assay.
Interference is large. Growth arrest yields hyperactive cells reducing MTT up to tenfold, so viability looks unchanged while proliferation is blocked[1]. Kinase inhibitors act through metabolic off-targets the same way: temozolomide remodels the electron transport chain, U0126 inhibits complex I, temsirolimus reprograms metabolism, imatinib raises reduction with apoptosis, rottlerin dissipates membrane potential. Abiotic reduction adds error: ascorbate, polyphenols and plant extracts form formazan without cells, as do epirubicin, paclitaxel, docetaxel and cisplatin[3]. Silver ions catalyze reduction[9]. Gold nanoparticles absorb light in the 500 to 600 nm region; at 5 nM they produced an apparent 22% increase in cell viability, while the normalized per-cell MTT reduction had in fact decreased by approximately 60%[1]. Serum must match, since 26 h starvation lowered optical density from 1.0 to 0.41 but 2 h did not[1].
Four controls are required to separate signal from interference:
(1) cell-free wells containing treatment, medium and MTT, which reveal abiotic formazan formation;
(2) medium-only blanks for background absorbance;
(3) lysate and supernatant wells, which define the upper and lower limits of the assay range;
(4) per-cell formazan normalization, which allows cells and cell-free wells to be compared directly.
05 MTT assay versus alternative cell viability assays
In the MTT vs LDH assay comparison, LDH released on membrane rupture is quantified by coupled tetrazolium reduction, classically INT read near 490 nm and alternatively WST-8 in a soluble format[10]. As a late cytolytic endpoint it complements MTT, which detects stress before death; both multiplex in one plate[11]. MTS cannot separate death from growth inhibition. LDH, by contrast, tends to underestimate killing when proliferation is blocked, because maximum release is referenced to vehicle wells that contain more cells[11]; including a Triton X-100 maximum-release control at every dose keeps this reference constant and restores comparability. LDH is acid labile, INT is unstable at alkaline pH, and copper and chloroquine interfere[3,10]. Choose MTT for metabolic capacity, early stress and throughput; choose LDH for membrane damage or confounded metabolism. A worked example of LDH-based cytotoxicity detection in pyroptotic cells is shown in Fig. 4.
MTT, ATP and calcein explained 93% of variance in one component, so potency rankings are robust across endpoints while absolute potencies stay protocol dependent[8]. Impedance detected doxorubicin effects about 5 h earlier than MTS and caught density effects MTT missed[5]; resazurin shows minimal interference[4,9]. Neutral red uptake is one of the few in vitro cytotoxicity methods accepted for regulatory phototoxicity testing (OECD TG 432), but its dye is adsorbed by carbon nanotubes and gold nanoparticles, so label-free interference must be excluded. MTT did not correlate with clonogenic survival after photodynamic treatment[12].
MTT assay kit formats differ in salt (MTT versus soluble MTS) and in supplied buffer or stop solution; MTS omits solubilization, LDH enables multiplexing. Verify any kit against the standard curve and Z′ criteria above before screening, and keep one lot throughout.
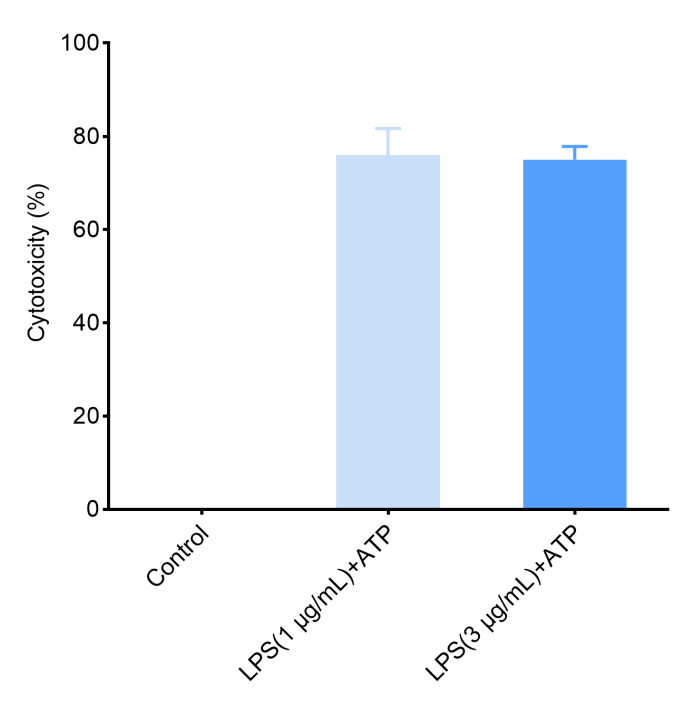
Fig. 4 Increased LDH release in LPS/ATP-induced pyroptotic RAW264.7 cells. Pyroptosis was induced in RAW264.7 cells by LPS priming followed by ATP stimulation, and the culture supernatants were collected for LDH measurement using the LDH Cytotoxicity Assay Kit. (The data are provided by Elabscience®)
Assay Used for This Experiment:
Lactate Dehydrogenase (LDH) Cytotoxicity Colorimetric Assay Kit
Cat. No.: E-BC-K771-M
Sample Type: Cell samples
Detection Instrument: Microplate reader
Quantify LDH release as an indicator of cytotoxicity and loss of plasma membrane integrity.
Special Offer: Enjoy 15% OFF from Sep 1 to Dec 18, 2026. → View Promotion
06 Key takeaways
● MTT measures cellular reductive capacity, i.e. cell number × per-cell metabolic rate, rather than cell number alone.
● Formazan forms in cytosolic lipid droplets, so MTT is not a mitochondrial function assay.
● Seeding density alters apparent potency; generate a standard curve for every cell line, serum batch and plate lot before calculating viability.
● MTT is cytotoxic and cell-line specific, so pre-optimize dye concentration, incubation time and solubilization.
● Growth arrest can raise the MTT signal up to tenfold, making blocked proliferation look like unchanged viability.
● Always run cell-free interference controls, because compounds, serum and abiotic chemistry all shift the readout.
● Choose MTT for metabolic capacity and early stress, and LDH for membrane damage when metabolism is confounded.
● Validate any kit against your own standard curve and keep one lot throughout, since absolute potencies remain protocol dependent.
The most appropriate workflow is therefore:
Standard curve → Standardized labeling conditions → Cell-free interference controls → Validation against an independent endpoint
07 Related resources
● Gain a holistic view of MTT and LDH assays in cytotoxicity testing and learn how to combine metabolic-viability and membrane-integrity readouts for reliable cell viability assessment.
● Learn how to distinguish proliferation, viability, and cytotoxicity and choose the right assay for your research.
Read Demystifying Cell Assays: How to Distinguish Proliferation, Viability & Cytotoxicity →
● Discover cell death detection solutions for cytotoxicity, apoptosis, and necrosis research.
Download Your Free Cell Death Guide →
References:
[1] Ghasemi, M., et al., The MTT Assay: Utility, Limitations, Pitfalls, and Interpretation in Bulk and Single-Cell Analysis. International Journal of Molecular Sciences, 2021. 22(23):12827 DOI: 10.3390/ijms222312827
[2] Stockert, J.C., et al., MTT Assay for Cell Viability: Intracellular Localization of the Formazan Product Is in Lipid Droplets. Acta Histochemica, 2012. 114(8):785-796 DOI: 10.1016/j.acthis.2012.01.006
[3] Stepanenko, A.A., Dmitrenko, V.V., Pitfalls of the MTT Assay: Direct and Off-Target Effects of Inhibitors Can Result in Over/Underestimation of Cell Viability. Gene, 2015. 574(2):193-203 DOI: 10.1016/j.gene.2015.08.009
[4] Kumar, P., Nagarajan, A., Uchil, P.D., Analysis of Cell Viability by the MTT Assay. Cold Spring Harbor Protocols, 2018. 2018(6):pdb.prot095505 DOI: 10.1101/pdb.prot095505
[5] Caviglia, C., et al., Interdependence of Initial Cell Density, Drug Concentration and Exposure Time Revealed by Real-Time Impedance Spectroscopic Cytotoxicity Assay. The Analyst, 2015. 140(10):3623-3629 DOI: 10.1039/c5an00097a
[6] Nga, N.T.H., et al., Optimization and Application of MTT Assay in Determining Density of Suspension Cells. Analytical Biochemistry, 2020. 610:113937 DOI: 10.1016/j.ab.2020.113937
[7] Lü, L., et al., Exocytosis of MTT Formazan Could Exacerbate Cell Injury. Toxicology in Vitro, 2012. 26(4):636-644 DOI: 10.1016/j.tiv.2012.02.006
[8] Mueller, H., Kassack, M.U., Wiese, M., Comparison of the Usefulness of the MTT, ATP, and Calcein Assays to Predict the Potency of Cytotoxic Agents in Various Human Cancer Cell Lines. SLAS Discovery, 2004. 9(6):506-515 DOI: 10.1177/1087057104265386
[9] Mello, D.F., et al., Caveats to the Use of MTT, Neutral Red, Hoechst and Resazurin to Measure Silver Nanoparticle Cytotoxicity. Chemico-Biological Interactions, 2020. 315:108868 DOI: 10.1016/j.cbi.2019.108868
[10] Kroll, A., et al., Current In Vitro Methods in Nanoparticle Risk Assessment: Limitations and Challenges. European Journal of Pharmaceutics and Biopharmaceutics, 2009. 72(2):370-377 DOI: 10.1016/j.ejpb.2008.08.009
[11] Smith, S.M., et al., A Simple Protocol for Using a LDH-Based Cytotoxicity Assay to Assess the Effects of Death and Growth Inhibition at the Same Time. PLoS ONE, 2011. 6(11):e26908 DOI: 10.1371/journal.pone.0026908
[12] Kessel, D., Pitfalls and Other Issues with the MTT Assay. Photodiagnosis and Photodynamic Therapy, 2025. 54:104700 DOI: 10.1016/j.pdpdt.2025.104700

