

Propidium iodide (PI) is the reagent that most laboratories reach for first when a cell cycle question appears on a project plan, because it is cheap, bright, excitable on the workhorse 488 nm laser, and can be read out on almost every analyser in service. On its own, however, PI answers only one question, namely how much DNA a cell contains at the moment of measurement. Every question that follows from that measurement, from whether a population is quiescent or merely arrested to whether a compound blocks DNA synthesis or delays mitosis, therefore requires deliberate protocol design and, in most cases, a second and third parameter layered on top of the DNA histogram.
This article covers the three practical pillars of the field: how to run a PI protocol that produces a histogram worth modelling; how PI compares with BrdU and EdU incorporation as a measure of proliferation; and how multiparameter panels turn DNA content into a mechanistic readout of cell cycle state in phenotypically defined subsets.
Table of Contents
1. What are the best protocols for cell cycle analysis using propidium iodide?
2. PI-based cell cycle analysis versus BrdU or EdU incorporation
3. Multiparameter flow cytometry for cell cycle and biomarker profiling
4. Key takeaways
5. Related resources
01 What are the best protocols for cell cycle analysis using propidium iodide?
Propidium iodide (PI) is a phenanthridine-based intercalating dye that becomes strongly fluorescent (excitation maximum approximately 493 nm; emission maximum approximately 617 nm) only upon insertion into a double-stranded nucleic acid duplex. This photophysical property imposes two operational constraints that underlie virtually every step of standard PI staining protocols.
First, PI is membrane-impermeant. Cells must therefore be fixed or permeabilized with a detergent before the dye can gain access to chromatin. Second, PI cannot discriminate DNA from double-stranded RNA, and the cytoplasm of a metabolically active cell is abundant in RNA. Without DNase-free RNase A treatment, the G1 peak broadens, the apparent S-phase fraction is overestimated, and the resulting DNA content histogram becomes uninterpretable. RNase digestion is therefore not an optional refinement but an integral component of the staining procedure.
A third, less conspicuous requirement is that fluorescence emission must be stoichiometric with DNA content. Any factor that alters dye accessibility without changing the amount of DNA, such as chromatin condensation during mitosis, apoptotic nuclear fragmentation, residual cytoplasmic material, or cell clumping, will distort the measured signal. Effective PI staining protocols are thus, in essence, procedures designed to deliver to the laser a uniform, RNase-treated, single-cell suspension of intact nuclei.
1.1 The standard ethanol-fixation protocol
This remains the reference method for cultured cells and is prioritized for validation. It is robust, compatible with batch staining, and fixed samples can be stored at -20 °C for several weeks. The procedure is outlined below.
(1) Harvest without bias. For adherent cells, collect the culture supernatant (it contains mitotic and apoptotic cells that have detached), then trypsinise the monolayer and pool. Discarding the supernatant is the single most common cause of a spuriously small G2/M fraction.
(2) Wash once in cold PBS, 300-400 × g for 5 min, and resuspend at 1-2 × 10⁶ cells/mL.
(3) Fix dropwise. With the tube on a vortex at low speed, add 0.3 mL of cell suspension to 0.7 mL of ice-cold 100% ethanol, or add 0.7 mL of ice-cold 70% ethanol to 0.3 mL of suspension — either way the final concentration is 70%. Adding fixative in one bolus, or fixing while the cells are at high density, produces aggregates that survive every subsequent step.
(4) Fix for at least 2 h at 4 °C, or overnight at -20 °C. Samples are stable for several weeks at -20 °C.
(5) Wash twice in cold PBS to remove residual ethanol. Ethanol carry-over inhibits RNase A.
(6) Digest RNA. Resuspend the pellet in 0.5 mL of staining buffer containing 100-200 µg/mL RNase A and incubate at 37 °C for 15-30 min. Room temperature for 30 min also works but is less complete.
(7) Stain. Add PI to 20-50 µg/mL and incubate for 15-30 min at room temperature in the dark.
(8) Filter and acquire. Pass through a 35-40 µm mesh immediately before acquisition. Analyse within 1-2 h; PI fluorescence drifts slowly and the sample should not be left overnight at room temperature.
For samples with a low cell number (sorted populations, rare subsets), scale the volumes down but keep the 70% ethanol ratio and the cell density above 2 × 10⁵/mL, dilute suspensions fix unevenly and lose cells to the tube wall.
Table 1. Reagents for cell cycle analysis with propidium iodide
|
Reagent |
Working concentration |
Notes |
|
PBS, Ca²⁺/Mg²⁺-free |
1× |
Contains EDTA if you need to limit clumping |
|
Ethanol |
70% (v/v), ice-cold |
Prepared fresh from 100% ethanol, stored at −20 °C |
|
RNase A |
100–200 µg/mL |
Must be DNase-free; boil or use molecular-biology grade |
|
PI |
20–50 µg/mL |
Protect from light; 1 mg/mL stock in water is stable for months at 4 °C |
|
Staining buffer |
PBS + 2% FBS or 0.1% BSA |
Protein reduces sticking and dye loss |
1.2 Alternative protocols and when to use them
Krishan one-step stain (no fixation). Cells are resuspended directly in a hypotonic buffer containing 0.1% sodium citrate, 0.1% NP-40 or Triton X-100, 100 µg/mL RNase A and 50 µg/mL PI. The detergent permeabilises, the hypotonic citrate reduces nuclear volume and improves peak resolution, and staining is complete in 15–30 min. It is fast and gives excellent CVs on lymphoid lines, but the samples are not stable and the preparation is incompatible with any downstream antibody staining. Use it for high-throughput screens on fresh material.
Nicoletti hypotonic PI. A citrate-buffered, hypotonic PI stain designed to preserve and resolve apoptotic nuclei, giving a clean sub-G1 peak. If apoptosis quantification rather than cell cycle distribution is the primary endpoint, this is the appropriate variant; do not try to extract high-resolution S-phase fractions from it.
Vindeløv detergent–trypsin method. Developed for solid tumours and frozen tissue, this two-step procedure (detergent + trypsin to disaggregate and digest, then inhibitor + spermine buffer + PI) releases clean nuclei from tissue without mechanical disaggregation. It is more demanding to set up but is the method of choice for biopsy material and for DNA index determination in clinical samples.
Methanol fixation. Ice‑cold 80% methanol or 100% methanol stored at -20 °C achieves stronger permeabilization than ethanol and provides superior preservation of phospho‑epitopes. This fixative is preferred for co‑staining PI with intracellular phosphorylated proteins. Methanol fixation typically yields slightly broader peaks and increased cell clumping relative to ethanol fixation; therefore, fixation duration should be titrated, and samples must always be filtered.
No fixation, no permeabilisation. If live cells must be recovered for sorting or functional assays after analysis, use Hoechst 33342 or a far-red live-cell DNA dye instead of PI. PI is not appropriate for viable-cell cell cycle work, and optimisation cannot resolve this issue.
1.3 Acquisition settings and the gates that decide everything
Acquire in linear fluorescence mode, not log. The PI signal spans roughly a factor of two between G1 and G2/M, and linear scaling keeps the peaks equidistant so that modelling software behaves predictably. Use a 585/42 or 610/20 bandpass; on instruments with a 561 nm laser, PI is equally well excited.
Maintain a moderate event rate of 200-500 events/s and acquire a minimum of 20,000 events within the analysis gate, with 50,000 events preferred. For rare cell subsets, the required event number scales with the frequency of the target subset rather than the total acquired events.
Two gates precede any modelling, and skipping either ruins the result:
(1) Scatter singlet gate. FSC-A versus FSC-H removes doublets and clumps that would otherwise appear as a false 4N population.
(2) Fluorescence singlet gate. PI-A versus PI-H (or PI-W) is the decisive gate. Two G1 cells stuck together carry the same total DNA as one G2/M cell; only pulse-area versus pulse-height separates them. A well-set PI-A/PI-H gate typically removes 2-10% of events and can remove far more after clumsy fixation.
Monitor three quality metrics for each acquisition run: the G1 peak CV (values below 5% are acceptable, below 3% are good, and below 2% are excellent), the coefficient of variation ratio between G2/M and G1, and the percentage of events excluded from the fitted model. If the CV increases across experiments, potential causes include incomplete RNase digestion, dye depletion, excessive sample concentration, and laser misalignment, listed in this order of priority.
For instrument linearity, run chicken or trout erythrocyte nuclei alongside the sample. Their DNA content is known relative to the diploid mammalian genome, so a misplaced peak immediately reveals a scaling problem rather than a biology problem.
1.4 Modelling the histogram and transparent reporting
After singlet gating, the DNA histogram is deconvolved into G1, S, and G2/M compartments. Two widely adopted models include the Dean–Jett–Fox (DJF) model and the Watson pragmatic model. The DJF model fits Gaussian G1 and G2/M peaks with a polynomial S-phase component and incorporates debris and aggregate terms, whereas the Watson pragmatic model employs broadened rectangles and tolerates suboptimal data. The DJF model yields superior fitting for high-quality data and serves as the default algorithm in most contemporary software packages. In contrast, the Watson model exhibits greater stability when the S-phase fraction is low or the CV is elevated.
Regardless of the analytical platform, the report should specify the model applied, the total number of analysed events, the G1 CV, the singlet gating strategy, and whether debris and aggregates were modelled or excluded. A cell cycle summary table lacking CV values does not constitute a valid result.
For all tumour samples, the DNA index (DI) should be reported as the ratio of the mean fluorescence of the aneuploid G1 peak to that of the diploid G1 peak. The proportion of cells within the aneuploid compartment should also be included if an aneuploid population is detected.
1.5 Troubleshooting
The following are the most common abnormal phenomena, causes, and corresponding solutions in the experiment, covering all issues from sample preparation to data analysis:
Table 2. Troubleshooting for propidium iodide-based cell cycle analysis
|
Symptom |
Most likely cause |
Fix |
|
Broad G1 peak, CV > 6% |
Incomplete RNase digestion; ethanol carry-over |
Use DNase-free RNase at 200 μg/mL; wash twice after fixation |
|
High debris, sub-G1 shoulder |
Dead cells at harvest; over-fixation; vigorous pipetting |
Remove dead cells before fixation; fix at 4 ℃; cut with a wide-bore tip |
|
Apparent 4N population that will not go away |
Doublets not excluded |
Add PI-A vs PI-H singlet gate; vortex during fixation; filter |
|
G2/M fraction lower than expected |
Mitotic cells lost in the discarded supernatant |
Pool supernatant with the trypsinised monolayer |
|
Signal decays during acquisition |
Dye photobleaching, sample warming |
Keep samples dark and at 4 ℃; acquire within 2 h |
|
Everything shifted left |
Dye concentration too low or PI absorbed by protein |
Re-titrate PI in the presence of your exact buffer |
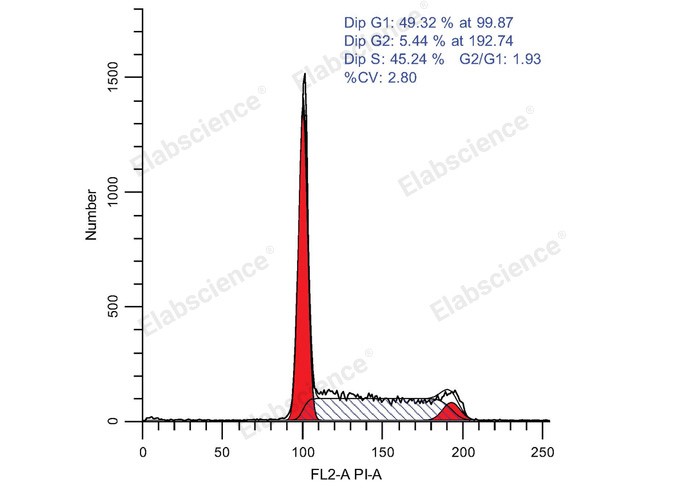
Fig. 1 Flow cytometric analysis of the cell cycle of Molt-4 cells. Molt-4 cells were treated with ethanol overnight and detected with the Cell Cycle Assay Kit (Red Fluorescence) (E-CK-A351). (The data are provided by Elabscience®)
Interpretation: Cell cycle refers to the whole process from the end of one mitosis to the end of the next. During this process, the genetic material is replicated and doubled, and evenly distributed to two daughter cells at the end of division. Cell cycle can also be divided into phases like interphase and Metaphase. Interphase can also be divided into dormancy (zero gap, G0), prophase of DNA synthesis (first gap, G1), anaphase of DNA synthesis (synthesis, S) and anaphase of DNA synthesis (second gap, G2). DNA detection can be used to reflect the status of each phase of the cell cycle which is also named cell proliferation. DNA can bind to fluorescent dyes (such as propidium iodide (PI)), the fluorescent dyes binding to DNA at different stages are different, and the fluorescence intensity detected by flow cytometry can also be used to detect different phases in cell cycle. When apoptotic cells occur, apoptotic bodies are produced due to the concentration and nucleolysis of cytoplasm and chromatin, which will change the light scattering properties of cells. In the early stage of apoptosis, the forward scattering (FSC) of cells decreased significantly, while the side scatter (SSC) increased or remained unchanged. In the late stage of apoptosis, both FSC and SSC signals decreased. Therefore, apoptotic cells can be observed by measuring the changes of light scattering by flow cytometry. After staining with PI, assuming that the fluorescence intensity of G0/G1 phase cells is 1, the theoretical value of fluorescence intensity of G2/M phase cells containing double genomic DNA is 2, and the fluorescence intensity of S phase cells undergoing DNA replication is between 1 and 2. Apoptotic cells lost part of genomic DNA fragmentation due to nucleus concentration and DNA fragmentation. Therefore, apoptotic cells showed obvious weak staining after PI staining and the fluorescence intensity was less than 1. The sub-G1 peak appeared on the flow cytometry fluorescence map which is apoptotic cell. The kit can be used to detect the DNA content (cell cycle) of cultured cells (suspension or adherence cells).
Assay Used for This Experiment:
Cell Cycle Assay Kit (Red Fluorescence)
Cat. No.: E-CK-A351
Sample Type: cells
Detection Instrument: Flow Cytometer
Fluorophores: PE
Explore the Cell Cycle Assay Kit (Red Fluorescence) Used in 218 Publications →
02 PI-based cell cycle analysis versus BrdU or EdU incorporation
PI cell cycle analysis, BrdU incorporation assay, and EdU incorporation assay represent three widely used approaches for cell cycle evaluation. Their key distinctions span multiple dimensions, including working principle, operational complexity, and compatibility with multiplex staining. A detailed comparative analysis is provided below.
2.1 Information obtainable and limitations of PI-based DNA histograms
PI quantifies cellular DNA content at the time of fixation. This single readout enables robust inference of the proportions of cells harbouring 2N DNA (G1), intermediate DNA content (S), and 4N DNA (G2/M). Nevertheless, the method cannot resolve four practically important features.
(1) G0 versus G1. Both populations exhibit a 2N DNA content and equivalent PI fluorescence intensity. Serum-starved cultures, contact-inhibited cultures, and proliferating cultures that transiently reside in G1 yield indistinguishable PI profiles.
(2) Subposition within S phase. Early‑S and late‑S cells both display intermediate DNA content and cannot be separated.
(3) Active DNA synthesis in S‑phase cells. Cells arrested in S phase by hydroxyurea retain intermediate DNA content and contribute to the modelled S‑phase fraction despite the absence of ongoing DNA synthesis.
(4) Direction of cell‑cycle progression. Static snapshot measurements cannot discriminate population accumulation from depletion in the absence of time‑course sampling.
The S‑phase fraction derived from PI histogram modelling is an inferred parameter rather than a direct measurement. It is calculated from a curve fitted to the DNA distribution and relies on the underlying assumptions of the fitting model. The most critical assumption is that the cell population is asynchronous and exponentially growing. This assumption breaks down in synchronised cultures, aneuploid tumour samples, or specimens with substantial debris. Under these conditions, the modelled S‑phase fraction may deviate from the true value by several percentage points.
2.2 BrdU: a well‑validated standard method with technical trade‑offs
Bromodeoxyuridine is a thymidine analogue that is incorporated into newly synthesised DNA by DNA polymerase during S phase. Detection relies on anti‑BrdU antibodies, which bind their target only after DNA denaturation. The classic denaturation strategy uses 2 M HCl for 20–30 min followed by neutralisation with sodium borate, although DNase I treatment serves as an alternative.
Combining BrdU labelling with PI staining generates a bivariate BrdU versus DNA plot that resolves cell‑cycle status clearly. This plot distinguishes BrdU‑negative 2N cells (G0/G1), BrdU‑positive cells distributed across the S‑phase DNA range, and BrdU‑negative 4N cells (G2/M). This approach directly measures DNA synthesis and has accumulated decades of validation in proliferation, toxicology, and clinical investigations.
The major limitation arises from the denaturation step. Acidic treatment compromises DNA integrity and destroys many protein epitopes, leading to the following consequences.
(1) G1 peak CVs increase substantially after HCl‑mediated denaturation.
(2) Surface and intracellular antibody panels frequently fail unless staining is performed before denaturation and the target epitopes are acid‑resistant.
(3) Sample loss and cell aggregation are exacerbated.
BrdU is also light‑sensitive and potentially mutagenic, requiring appropriate biosafety handling.
2.3 EdU: equivalent biological readout without acid denaturation
EdU (5‑ethynyl‑2′‑deoxyuridine) contains a terminal alkyne group in place of bromine. It is detected via copper‑catalysed azide–alkyne cycloaddition, commonly termed click chemistry, using a fluorescent azide reporter. DNA denaturation is unnecessary because the alkyne moiety remains accessible within intact DNA duplexes.
This feature yields several important practical advantages.
(1) DNA integrity is preserved, such that subsequent PI staining produces higher‑quality histograms than BrdU–PI protocols. Side‑by‑side comparisons consistently show that EdU–PI assays yield G1 CV values that are two to three percentage points lower than those obtained with BrdU–PI.
(2) Protein epitopes are better retained, so EdU can be multiplexed with surface markers and most intracellular proteins. This property makes EdU the preferred option for multiparameter panels aimed at phenotypic characterisation of proliferating cells.
(3) The assay workflow is shortened. A 30 min click reaction replaces the longer 60 min sequence of denaturation and neutralisation required for BrdU.
(4) Fluorescent EdU azide conjugates are available across multiple emission channels including 488, 550, 594, and 647 nm, enabling selection of a fluorophore spectrally separated from PI.
Two important caveats should be noted. The copper catalyst may quench certain fluorochromes and induce reactive oxygen species. Therefore, staining sequence requires careful planning; click chemistry can be performed either before antibody staining or after antibody staining following empirical validation for each panel. In addition, EdU, like BrdU, reports DNA synthesis rather than cell division. It can weakly label cells undergoing DNA repair synthesis and mitochondrial DNA replication.
A representative EdU–PI protocol is as follows. Pulse cells with 10 µM EdU for 30 min to 2 h, harvest and fix samples in 70% ethanol or 4% PFA, then permeabilise the fixed cells. Perform the click reaction with an azide–fluorophore conjugate for 30 min at room temperature. Samples are subsequently treated with RNase A and stained with PI. Acquire the EdU signal on a detector channel well separated from the PI emission peak at 617 nm.
2.4 Head-to-head
PI cell cycle analysis, BrdU incorporation method, and EdU incorporation method are three commonly used cell cycle detection techniques. The core differences lie in multiple aspects such as principle, operational complexity, and compatibility with multiple stains. The specific comparison is shown in the following table:
Table 3. Comparison of PI, BrdU and EdU cell cycle analysis methods
|
Feature |
PI alone |
PI + BrdU |
PI + EdU |
|
What is measured |
DNA content (static) |
DNA content+DNA synthesis |
DNA content+DNA synthesis |
|
Distinguishes G0 from G1 |
No |
Yes |
Yes |
|
S-phase fraction |
Modelled |
Measured directly |
Measured directly |
|
Early vs late S |
No |
Yes (by DNA content) |
Yes (by DNA content) |
|
DNA quality after staining |
Excellent |
Degraded by acid |
Excellent |
|
Compatible with antibody panels |
Limited (fixation-dependent) |
Poor (epitope loss) |
Good |
|
Hands-on time |
~2 h |
~4 h |
~2.5 h |
|
Cost per sample |
Lowest |
Moderate |
Moderate–high |
|
Best for |
Screening, large cohorts, limited sample |
Validated/regulated assays, archival comparability |
Multiparameter phenotyping, precious samples |
2.5 Selection among the three cell cycle analysis methods
PI alone is suitable for studies examining population-level shifts, such as whether a treatment increases the 4N fraction or whether siRNA reduces the S-phase fraction. This approach is preferred when sample throughput is high or starting material is limited. It also represents a cost-effective option for duplicate measurements in 96-well screening formats.
PI combined with EdU should be selected when direct measurement rather than model fitting of the S-phase fraction is required, when G0 and G1 populations need to be discriminated, when proliferating cells require phenotypic characterisation, or when samples are valuable and cannot tolerate the cell loss associated with acid denaturation.
PI combined with BrdU is appropriate when results must be comparable with historical datasets, when the assay is embedded within a validated regulatory workflow, or when a validated anti-BrdU antibody clone is already established in the laboratory. This method offers no inherent biological advantage over EdU; its use is driven by institutional requirements.
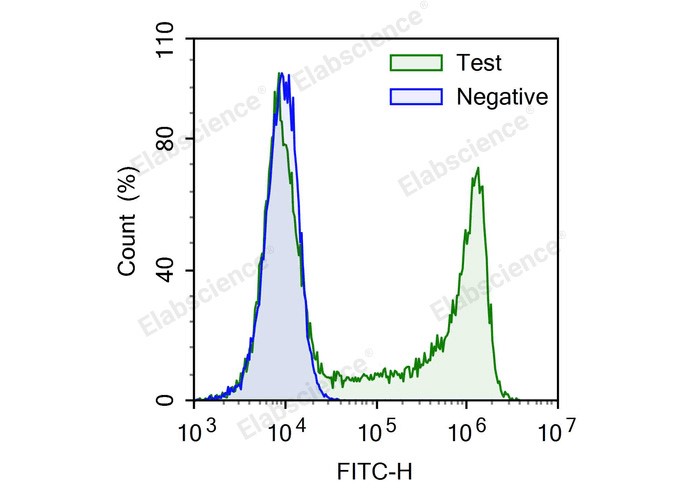
Fig. 2 Analyze the proliferation of Jurkat cells using EdU. Jurkat cells were treated with (Test) or without (Negative) 10 μM EdU for 4 hours. (The data are provided by Elabscience®)
Interpretation: Cell proliferation assays are widely used in the evaluation of cell viability, genotoxicity, and the effect of antitumor drugs. Direct detection of DNA synthesis in cells is considered to be the most accurate method for detecting cell proliferation. The initial widely used method for detecting DNA synthesis in cells was the radiolabeled nucleoside incorporation method, but this method was greatly limited due to radioactive contamination and the difficulty of single-cell detection, and was gradually replaced by the BrdU method based on antibody detection. The BrdU method has many steps and requires the use of BrdU antibody, which has many influencing factors and poor stability. EdU method is based on EdU incorporation and subsequent click reaction, without the use of antibodies, convenient operation and high detection sensitivity. It is a new method upgraded on the basis of BrdU method and will gradually replace BrdU method. EdU (5-ethynyl-2-deoxyuridine), is a thymidine analog, EdU can replace thymidine in the process of DNA synthesis to incorporate into new in synthetic DNA. On the other hand, the acetylene group on EdU can react with fluorescently labeled small molecule azide probes (such as FITC Azide, Elab Fluor® 488 Azide, Elab Fluor® 594 Azide, Elab Fluor® 647 Azide) through the catalysis of monovalent copper ions to form a stable triazole ring. This reaction is very rapid and is called the click reaction. Through the click reaction, the newly synthesized DNA is labeled with the corresponding fluorescent probe, so that the proliferating cells can be detected using the appropriate fluorescent detection equipment.
Assay Used for This Experiment:
E-Click EdU Cell Proliferation Flow Cytometry Assay Kit (Green,FITC) (E-CK-A370)
Cat. No.: E-CK-A370
Sample Type: Cell Slides; Cell Smears
Detection Instrument: Flow Cytometer
Fluorophores: FITC
03 Multiparameter flow cytometry for cell cycle and biomarker profiling
The core value of multiparameter flow cytometry in cell cycle and biomarker analysis lies in enabling a paradigm shift from coarse-grained description of average phase distribution across a cell population toward fine-grained characterization of functional states at the single-cell level. Conventional DNA content analysis only resolves G1, S, and G2/M phases. By contrast, multiparameter detection of DNA content, nucleotide incorporation, cyclin abundance, phosphorylated signaling proteins, and surface phenotypes permits further discrimination between G0 and G1 as well as G2 and M states. This strategy directly links cell cycle status to signaling pathway activation, cellular differentiation identity, and apoptotic potential.
3.1 The underdiscussed design constraint: fluorophore selection
Once a panel expands beyond DNA staining paired with a single antibody, propidium iodide becomes a major limiting factor. It exhibits broad emission spanning approximately 570 to 750 nm. This emission profile causes spectral spillover into PE, PE-Dazzle, and PE-Cy5 channels, and may also overlap with the APC channel depending on instrument configuration. Compensation for PI spillover into PE is technically feasible yet compromises the dynamic range of both channels. Such tradeoff impairs resolution precisely within the region critical for DNA histogram fitting.
Two rules follow. If the panel is fixed-cell and the instrument has a UV or violet laser, use DAPI or Hoechst rather than PI, the DNA histogram will be cleaner and the antibody panel will not have to be built around a dye. If PI is non-negotiable, build the panel in FITC, APC and Pacific Blue, and accept that PE is off the table.
3.2 Separating G0 from G1: Ki-67 and the RNA axis
Ki-67 is expressed throughout the active cell cycle and is absent from quiescent cells. In cell cycle analysis, when combined with DNA content, it resolves the 2N peak into two functionally distinct compartments: Ki-67-negative 2N cells represent G0, whereas Ki-67-positive 2N cells represent G1. The same bivariate plot separates G2 (Ki-67-high, 4N) from M and yields a proliferation index that does not depend on S-phase modelling.
An alternative, less expensive cell cycle assay combines Hoechst 33342 with Pyronin Y. G0 cells contain low RNA and G1 cells high RNA, so the two populations can be resolved within the 2N compartment without an antibody. This assay requires viable, carefully handled cells and is less robust than Ki-67 staining, but it is useful when intracellular staining is not feasible.
The two strategies are complementary: Ki-67 suits fixed-cell panels that include surface markers, whereas Hoechst/Pyronin Y suits viable-cell experiments in which the cells must survive the analysis.
3.3 Mitotic and phase-specific markers
PI staining flow cytometry cannot distinguish G2 from M, because both are 4N. Four markers close this gap:
(1) Phospho-histone H3 (Ser10). Phospho-H3 (Ser10) is the standard mitotic marker. A 4N population positive for phospho-H3 provides a direct measure of the mitotic fraction, and combining it with DNA content separates G2 (4N, phospho-H3-negative) from M (4N, phospho-H3-positive). This marker is essential for studying mitotic arrest, Aurora or PLK1 inhibition, and checkpoint integrity.
(2) Cyclin B1. Cyclin B1 accumulates through S and G2 and is degraded at the metaphase-anaphase transition. Cyclin B1-high 4N cells therefore represent G2, whereas cyclin B1-low 4N cells represent late M or post-mitotic cells. Methanol fixation gives the best results.
(3) Cyclin A and cyclin E. Cyclin A marks S and G2, and cyclin E marks the G1/S transition. Together with DNA content, they provide a phase-resolved view of the cell-cycle machinery rather than a simple phase assignment.
(4) Phospho-Rb (Ser807/811). The Rb protein is hypophosphorylated in G0 and early G1 and becomes hyperphosphorylated from late G1 through M. Combined with DNA content, phospho-Rb serves as a useful single-colour surrogate for pathway activation status.
3.4 Cell cycle in phenotypically defined subsets
The most common question in flow cytometry cell cycle analysis is not 'what is the cell cycle distribution of this culture' but 'what is the cell cycle distribution of this subset'. Three examples illustrate the design principles.
T-cell subsets. Cells are stained for surface CD3, CD4 and CD8 (with CD45RA and CCR7 to distinguish naive from memory cells), fixed and permeabilised, and then stained intracellularly for Ki-67 and with DAPI for DNA. The readout is the fraction of Ki-67-positive cells within each subset, the standard measure of homeostatic proliferation in vivo. Because the subsets are defined by surface markers, all surface staining must precede fixation, and the fixative must be chosen to preserve epitopes rather than to optimise PI intensity.
Haematopoietic progenitors. CD34-positive cells are rare (often <1%), so event numbers dominate the experimental design: 10⁵-10⁶ events per sample are recommended, together with a 'time' or 'CD45' gate to ensure acquisition accuracy. Combining DNA content with CD34 and Ki-67 yields the cycling fraction of the progenitor pool, a measurement that a bulk PI histogram cannot provide because the progenitors are diluted 100-fold.
Tumour DNA content. Events are gated on CD45-negative, EpCAM-positive cells to exclude infiltrating leukocytes, and the DNA index (DI) of the tumour population is then determined. A DI of 1.0 indicates diploidy; any other value indicates aneuploidy, and the aneuploid S-phase fraction is the prognostically relevant number. This is one of the few applications in which PI remains clearly superior to DAPI, because the clinical literature and cut-offs are all built on PI.
3.5 Live-cell and division-tracking approaches
When the cells must survive the analysis, whether for sorting, functional follow-up or time-lapse correlation, the available options change:
(1) FUCCI reporters. Cdt1–mCherry marks G1, and Geminin–EGFP marks S/G2/M. The system provides a direct, genetically encoded phase readout in living cells and is the cleanest way to sort pure phase populations.
(2) Hoechst 33342 or DyeCycle Violet. Combined with efflux-pump inhibition, these dyes give a DNA-content readout in viable cells, at the cost of some toxicity and a mandatory titration step.
(3) CellTrace Violet or CFSE dilution. These reagents measure division history rather than phase. They answer a different and often more useful question: how many rounds has this cell completed? Combined with a DNA dye or a proliferation marker, they link division history to the current cycle position.
(4) Label retention. Pulse-labelling with an EdU cell proliferation assay kit or a BrdU cell proliferation assay kit, followed by a long chase, identifies slowly cycling or quiescent cells in vivo and is a standard tool in stem-cell biology.
3.6 Controls, compensation and analysis
In cell cycle flow cytometry, DNA dyes are awkward to compensate because their emission is broad and their signal is extremely strong relative to antibody staining. The following practical rules apply to the PI staining protocol:
(1) Prepare single-stain controls for the DNA dye itself, not only for the antibodies, and set the DNA channel voltage so that the G2/M peak falls comfortably within the linear range.
(2) Include fluorescence-minus-one (FMO) controls for each antibody in the panel, gated on the DNA histogram so that the negative population is the relevant reference.
(3) Verify that fixation and permeabilisation do not shift the DNA peak by comparing fixed and unfixed nuclei from the same sample.
(4) Because DNA content is a continuous variable, avoid analysis strategies that treat 'G1' as a Boolean gate. Use the histogram or fit the model, and report the quality of the fit.
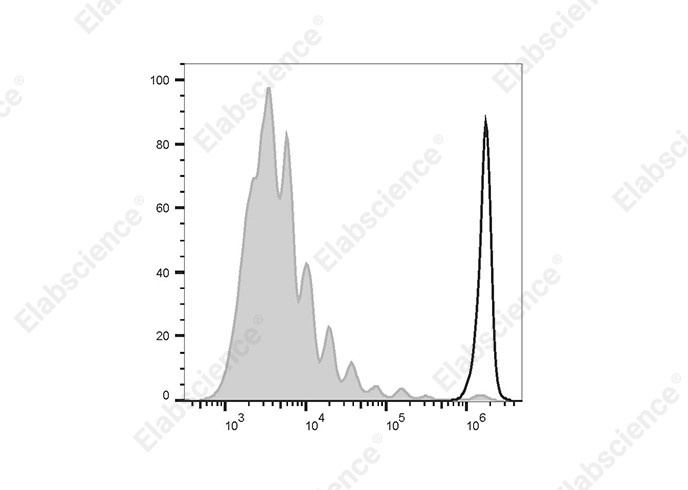
Fig. 3 Flow cytometric analysis of T-cell proliferation in human peripheral blood using CFSE. Human peripheral blood mononuclear cells (PBMCs) were stimulated with Human T-Activator CD3/CD28, then stained with CFSE Cell Division Tracker Kit on Day 0 (empty black histogram) or on Day 7 (filled gray histogram). Solid gray peaks represent successive generations. (The data are provided by Elabscience®)
Interpretation: CFDA SE is a kind of fluorescein dye with membrane permeability, which has no fluorescence itself. When CFDA SE enters living cells through the cell membrane, it can be catalyzed by esterase in cytoplasm to produce carboxyfluorescein succinimide ester (CFSE), which can emit strong green fluorescence, can not penetrate the cell membrane, and can remain intact in the cell. CFSE can also spontaneously and irreversibly combine with amino groups of intracellular proteins to couple to these proteins. At the same time, excess unreacted CFDA-SE passively diffuses back into the extracellular medium and removed by subsequent washing steps.
Assay Used for This Experiment:
CFSE Cell Division Tracker Kit
Cat. No.: E-CK-A345
Sample Type: Cells
Detection Instrument: Flow Cytometer
Fluorophores: FITC
Explore the CFSE Cell Division Tracker Kit (E-CK-A345) Used in 10 Publications →
04 Key takeaways
● RNase is not optional. Most “bad PI data” is under-digested RNA, not bad antibody or bad instrument.
● Singlet gating decides the 4N fraction. PI-A versus PI-H must be set before any modelling, or G2/M is a doublet artefact.
● A PI S-phase fraction is a fit, not a measurement. Report the model, the CV, and the event count alongside the percentages.
● EdU has largely displaced BrdU for research panels: same biology, better DNA integrity, better epitope preservation, faster.
● PI and PE do not coexist peacefully. If the panel is more than three colours, switch the DNA dye to DAPI, Hoechst or DRAQ5.
● G2 and M are not the same compartment. Add pHH3 when mitosis is the endpoint.
● G0 and G1 are not the same compartment. Add Ki-67, or Hoechst/Pyronin Y, when quiescence is the question.
05 Related resources
● Learn how to perform cell cycle analysis using the Cell Cycle Assay Kit, from cell collection and ethanol fixation to PI staining and flow cytometry detection.
Watch Cell Cycle Assay Kit Operation Video →
● Explore common challenges in cell cycle analysis and practical solutions to improve detection accuracy and data reliability.
Read Three Common Problems and Solutions of Cell Cycle Detection →
References:
[1] Krishan,A.Rapid flow cytofluorometric analysis of mammalian cell cycle by propidium iodide staining.[J].The Journal of cell biology, 1975, 66(1):188-93.
[2] Jett D J H .Mathematical Analysis of DNA Distributions Derived from Flow Microfluorometry[J].Journal of Cell Biology, 1974, 60(2):523-527.
[3] Vindeløv, Lars L, Christensen I J , Nissen N I .A detergent-trypsin method for the preparation of nuclei for flow cytometric DNA analysis.[J].Cytometry, 2010, 3(5):323-327.
[4] Nicolletti I , Magliorati G , Pagliacci M C ,et al.A rapid and simple method for measuring thymocyte apoptosis by propidium iodide staining and flow cytometry.[J].Journal of Immunological Methods, 1991, 139(2).
[5] Dolbeare F , Gratzner H , Pallavicini M G ,et al.Flow cytometric measurement of total DNA content and incorporated bromodeoxyuridine[J].Proceedings of the National Academy of Sciences, 1983, 80(18):5573-5577.
[6] Adrian,Salic,Timothy,et al.A chemical method for fast and sensitive detection of DNA synthesis in vivo.[J].Proceedings of the National Academy of Sciences of the United States of America, 2008.
[7] Asako Sakaue-Sawano and Hiroshi Kurokawa and Toshifumi Morimura and Aki Hanyu and Hiroshi Hama and Hatsuki Osawa and Saori Kashiwagi and Kiyoko Fukami and Takaki Miyata and Hiroyuki Miyoshi and Takeshi Imamura and Masaharu Ogawa and Hisao Masai and Atsushi Miyawaki.Visualizing Spatiotemporal Dynamics of Multicellular Cell-Cycle Progression[J].Cell, 2008.
[8] Rieger A M , Hall B E , Luong L T ,et al.Conventional apoptosis assays using propidium iodide generate a significant number of false positives that prevent accurate assessment of cell death[J].Journal of Immunological Methods, 2010, 358(1-2):81-92.

