

Cytokine detection in cell culture supernatant is central to cell function, polarization, and inflammation models. But no signal, reversed trend, abnormal dilution, high CV, cross-reactivity - these six nightmares are all too familiar.
CellaQuantTM ELISA Kits are validated on real cell samples across all targets, eliminating pain points in cell supernatant detection.
Table of Contents
1. No detectable cytokine signal in cell supernatant
2. Unexpected polarization trends in cell-based models
3. Nonlinear dilution effects and false hook phenomena
4. High CV (>30%) and poor reproducibility between replicates
5. ELISA kit stability challenges in long-term studies
6. Minimizing cytokine cross-reactivity in immune assays
7. Available and upcoming CellaQuantTM ELISA targets
01 No detectable cytokine signal in cell supernatant
User says:
"RAW264.7 induced with LPS for 24h - no IL‑6, TNF‑α, or IL‑1β in supernatant. Switched two domestic kits, blank OD higher than sample. My PI asked if I killed the cells..."
Root causes:
(1) Cell Models: Suboptimal cell model (induction concentration/time, cell density) caused cytokine levels below detection limit.
(2) Assay Kits: Kit not validated for cell samples: phenol red, 10% FBS, and antibiotics in culture media cause matrix interference (suppression or false negative). Antibody pairs not screened for cell matrix; chromogenic system not optimized - blank OD > sample OD.
CellaQuantTM Solution:
(1) Cell-model Validated: All targets tested on ≥2 cell lines (e.g., RAW264.7, THP-1) with real supernatant data.
%20and%20TNF-%CE%B1%20(CQM002)%20levels%20in%20RAW264_7%20cell%20supernatant_.png)
Fig. 1 Mouse IL-6 (CQM001) and TNF-α (CQM002) levels in RAW264.7 cell supernatant: untreated vs. stimulated with 1 μg/mL LPS + 20 ng/mL GM-CSF for 1, 2, or 4 days.
%20and%20TNF-%CE%B1%20(CQM002)%20in%20culture%20supernatants%20of%20various%20common%20cell%20lines_.png)
Fig. 2 Detection of Mouse IL-6 (CQM001) and TNF-α (CQM002) in culture supernatants of various common cell lines.
(2) Matrix Interference Controlled: Works with/without phenol red, various serum concentrations.
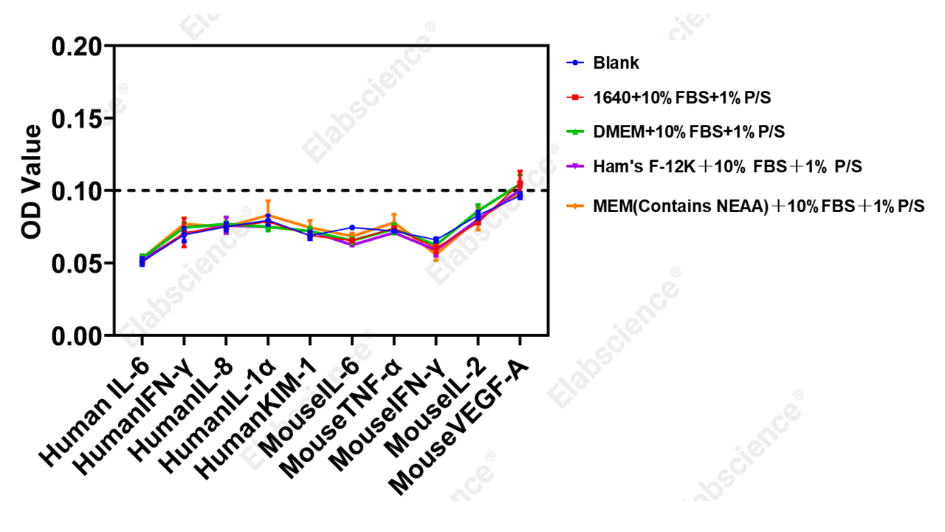
Fig. 3 Blank absorbance values in different complete culture media.
02 Unexpected polarization trends in cell-based models
User says:
"THP-1 M1 polarization - TNF-α should increase, but my model group is lower than control. Repeated for a month, trend always opposite. Reviewer questioned data validity…"
Root causes:
(1) No Process Control
Cannot distinguish between failed cell model vs. failed detection.
(2) No Cell-specific Calibrator
Batch‑to‑batch variation in antibody titer/coating.
CellaQuantTM Solution:
(1) Built-in Control: Each lot includes a quality control to monitor assay integrity.
_.png)
Fig. 4 37℃ accelerated stability of QC and standard (4-20 days).
(2) Standardized M1/M2 Protocol: Matches literature expression profiles.
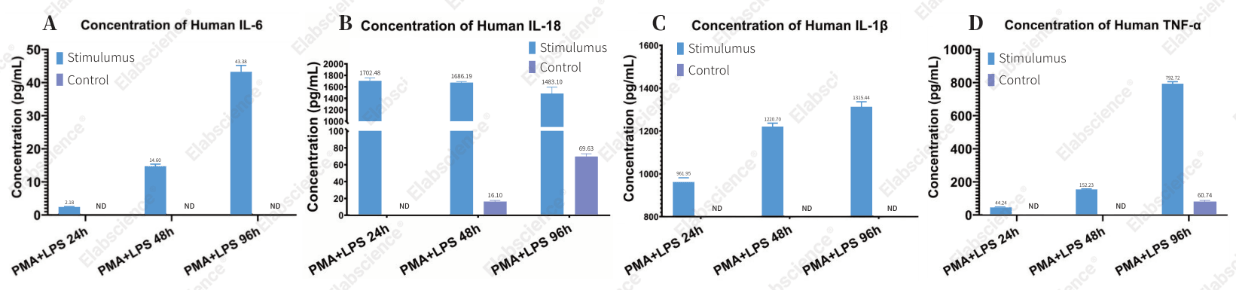
Fig. 5 Cytokine secretion by THP-1 cells. THP-1 cells were induced with 100 ng/mL PMA and 500 ng/mL LPS for 24, 48, or 96 h; supernatants were collected. Panels A-D show Human IL-6, IL-18, IL-1β, and TNF-α, respectively.
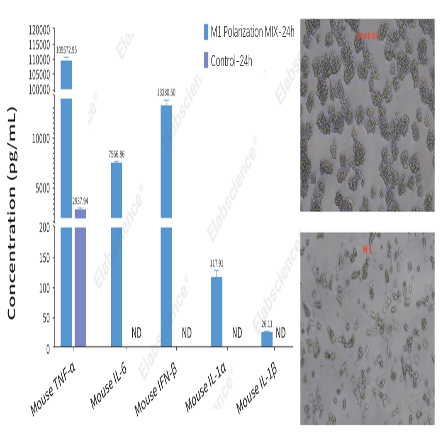
Fig. 6 Cytokine secretion by M1-polarized RAW264.7 cells. RAW264.7 cells were induced using the M1 macrophage polarization culture & detection kit (XJM004) for 24 h; supernatants were collected. Mouse TNF-α, IL-6, IFN-β, IL-1α, and IL-1β were measured by ELISA.
(3) Correlation with Leading Company R: R² >0.9 on cell supernatant.
_.png)
Fig. 7 Correlation with international gold standard (R² > 0.9).
03 Nonlinear dilution effects and false hook phenomena
User says:
"Serum dilutes fine, but 1:2/1:4 dilution of cell supernatant gives higher OD than neat - mistaken for hook effect, but actual concentration is low…"
Root causes:
(1) Cell‑matrix Specific Inhibition
Complement, cell debris, intracellular proteins in supernatant inhibit signal at high concentration; dilution relieves inhibition → false hook effect (not true antigen excess).
(1) Kit Buffer Mismatched
Optimized for serum, not for cell matrix; no linearity validation.
CellaQuantTM Solution:
(1) Cell Specific Buffer System
Optimized antibody concentration and sample diluent to completely remove matrix inhibition.
(2) Strict Linearity & Recovery
Both meet 80-120% international standard.
Table 1. Linearity: spike recovery of human IL-6 in serial 2‑, 4‑, 8‑, and 16‑fold diluted samples: recovery range and average recovery (CQH001)
|
Dilution Ratio |
Recovery Rate |
Human PBMC (n=5) |
Human THP-1 (n=5) |
Human A549 (n=5) |
|
1:2 |
Recovery Range (%) |
98-115 |
96-107 |
86-101 |
|
Mean Recovery (%) |
105 |
102 |
93 |
|
|
1:4 |
Recovery Range (%) |
101-116 |
92-107 |
87-99 |
|
Mean Recovery (%) |
108 |
98 |
93 |
|
|
1:8 |
Recovery Range (%) |
106 |
93-105 |
87-101 |
|
Mean Recovery (%) |
106 |
99 |
93 |
|
|
1:16 |
Recovery Range (%) |
97-115 |
93-104 |
89-101 |
|
Mean Recovery (%) |
105 |
99 |
94 |
Table 2. Spike recovery: known concentrations of human IL-6 added to different sample matrices: recovery range and average recovery (CQH001)
|
Samples |
Recovery Range (%) |
Mean Recovery (%) |
|
Human PBMC(n=6) |
87-100 |
94 |
|
Human THP-1(n=6) |
88-99 |
94 |
|
Human A549(n=6) |
94-107 |
99 |
04 High CV (>30%) and poor reproducibility between replicates
User says:
"Same supernatant, triplicate CV >30%. Is it me or the kit?"
Root causes:
(1) Poor Supernatant Uniformity: Cell debris, dead cell proteins, batch variation in serum/phenol red amplify well to well error.
(2) Kit Factors: Poor pre-coating (intra plate CV >15%); wash intensity/antibody concentration not optimized for cell samples; edge effects.
(3) Operator: Incomplete mixing, uneven incubation, incomplete washing, timing/volume variation in stop solution, temperature fluctuation.
CellaQuantTM Solution:
(1) Precision: Intra- and inter-assay CV <10%.
Table 3. Intra‑assay and inter‑assay precision data (CQH001)
|
|
Intra-assay precision |
Inter-assay precision |
||||
|
Sample |
1 |
2 |
3 |
1 |
2 |
3 |
|
Number |
20 |
20 |
20 |
20 |
20 |
20 |
|
Mean |
46.01 |
141.23 |
371.85 |
47.92 |
129.7 |
365.55 |
|
SD |
2.35 |
8.50 |
17.96 |
3.02 |
9.34 |
27.23 |
|
CV (%) |
5.11 |
6.02 |
4.83 |
6.31 |
7.20 |
7.45 |
(2) Built-in Control: Traceable, validated.
Table 4. QC description in product manual (CQH001)
|
Target |
Diluent volume |
M ± 3SD (pg/mL) |
|
Human IL-6 |
1000 μL |
62.72-76.74 |
(3) Full technical support: Real‑time online consultation.
05 ELISA kit stability challenges in long-term studies
User says:
"Imported brand: 2-3 months lead time, 6-month shelf life, only 3-4 months left upon arrival; opened kit lasts only 1 month - not enough for my sample collection."
Root causes:
(1) Imported Kits: Long lead time, short post opening stability (1 month).
(2) Domestic Kits: Often lack systematic open stability validation.
(3) Research Reality: Cell experiments take 2-3 months (induction → collection → detection); 1 month open stability is insufficient.
CellaQuantTM Solution:
(1) Dual Stability Validation
Accelerated (37℃) & real-time (2-8℃).
(2) Extended post-opening stability
Up to 12 months at 2-8℃/-20℃ (see manual).
_.png)
Fig. 8 Accelerated stability data of CellaQuantTM Human IL‑6 ELISA (7 days, 11 days at 37℃).
06 Minimizing cytokine cross-reactivity in immune assays
User says:
"PBMC anti-CD3/CD28 activation - IFN-γ increased, but IL-4 and IL-10 also 'increased'. Flow cytometry shows Th1 bias, IL-4 shouldn't go up. Suspect cross-reactivity."
Root causes:
(1) Structural Similarity within Th1/Th2 Families
IL-4/IL-13 share IL-4Rα chain; IFN-γ/IL-10 both contain four helix bundle domain. Polyclonal antibodies without stringent screening may recognize conserved epitopes.
(2) High Cytokine Concentration in Supernatant Amplifies Weak Cross-reactivity
CellaQuantTM Solution:
(1) Recombinant Monoclonal Antibody Pairs
High specificity, validated against related factors, no cross-reactivity.
Table 5. Intra‑assay and inter‑assay precision data (CQH001)
|
Protein |
Cross-reactivity |
|
Human IL-5 |
<0.1% |
|
Human IL-10 |
<0.1% |
|
Human LIF |
<0.1% |
|
Human MIP-1β |
<0.1% |
|
Human RANTES |
<0.1% |
|
Human IL-6 |
<0.1% |
|
Human IL-12 |
<0.1% |
|
Human MCP-1 |
<0.1% |
|
Human PDGF-AA |
<0.1% |
|
Human SCF |
<0.1% |
|
Human IL-6R |
<0.1% |
|
Human IP-10/CXCL10 |
<0.1% |
|
Human MCP-3 |
<0.1% |
|
Human PDGF-AB |
<0.1% |
|
Human TGF-α |
<0.1% |
|
Human IL-7 |
<0.1% |
|
Human TGFβ1 |
<0.1% |
|
Human MIP-1α |
<0.1% |
|
Human PDGF-BB |
<0.1% |
|
Human TNF-β |
<0.1% |
|
Human ANG |
<0.1% |
|
Human G-CSF |
<0.1% |
|
Human IFN-γ |
<0.1% |
|
Human IL-1R1 |
<0.1% |
|
Human EGF |
<0.1% |
|
Human GROβ/CXCL2 |
<0.1% |
|
Human IGF-1 |
<0.1% |
|
Human IL-1R2 |
<0.1% |
|
Human EPO |
<0.1% |
|
Human gp130 |
<0.1% |
|
Human IGF-2 |
<0.1% |
|
Human IL-2 |
<0.1% |
|
Mouse GM-CSF |
<0.1% |
|
Mouse IL-5 |
<0.1% |
|
Mouse LIF |
<0.1% |
|
Mouse IL-1β |
<0.1% |
|
Mouse IL-6 |
<0.1% |
|
Mouse MIP-1α |
<0.1% |
|
Mouse IL-3 |
<0.1% |
|
Mouse IL-9 |
<0.1% |
|
Mouse MIP-1β |
<0.1% |
|
Mouse TNF-α |
<0.1% |
|
Mouse IL-10 |
<0.1% |
|
Mouse SCF |
<0.1% |
(2) Cell Model Specificity Validation: In PBMC (anti-CD3/CD28) ensures consistency with Th1/Th2 literature profiles.
%20and%20TNF%E2%80%91%CE%B1%20(CQH014)%20levels%20in%20human%20PBMC%20supernatant_.png)
Fig. 9 IFN‑γ (CQH003) and TNF‑α (CQH014) levels in human PBMC supernatant: untreated vs. stimulated with 10 μg/mL anti‑CD3 mAb + 1 μg/mL anti‑CD28 mAb for 1, 2, or 4 days.
%20and%20IL%E2%80%9117A%20(CQH010)%20levels%20in%20human%20PBMC%20supernatant_.png)
Fig. 10 IFN‑γ (CQH003) and IL‑17A (CQH010) levels in human PBMC supernatant: untreated vs. stimulated with 10 μg/mL PHA for 1, 2, or 4 days.
07 Available and upcoming CellaQuantTM ELISA targets
Human:
VEGF-A, TNF-α, TGF-β1, IL-1β, IL-1α, IL-2, IL-5, IL-6, IL-8, IL-10, IL-12, IL-15, IL-17A, IL-18, IL-22, IL-23, IL-33, IFN-γ, IFN-β, EPO, KIM-1.
Mouse:
VEGF-A, TNF-α, IL-1β, IL-1α, IL-2, IL-5, IL-6, IL-10, IL-17A, IFN-γ.
Rat:
TNF-α, IL-1β, IL-4, IL-10, IL-18, IFN-γ.
CellaQuantTM ELISA Kits - zero failure, accurate quantitation, publication-ready for cell supernatant detection.

