As the last procedure of ELISA, calculation of results is of great
importance to the success of the assay.
1. ELISA samples are always tested in duplicates or in triplicates,
then average the absorbance values for each set
of standards and samples.
2. Subtract the average value of zero standard OD (this step is
unnecessary in procedure of competitive ELISA).
3. Create standard curve.
Plot a four parameter logistic curve on log-log graph paper, with
standard concentration on the x-axis and OD values on the y-axis. The software Origin is recommended to
use.
The details are as follows:
Step 1: Input information of the OD value and concentration of the
standards

Step 2: Select the curve type:
Select the value box, and then select items in turn as
below.


Step3: Select the specific X/Y:

After setting the above items, click the Fit button, then the curve
and its information is produced as showed in step 4.
Step4: Check the information of the standard curve (parameter values,
R-Square, etc.)

Step5: Set the axis to log-log type.
Double click the Fitted Curve Plot in step 4 to make the curve to
editable state. Then double click the X axis and Y axis to set them to log type.


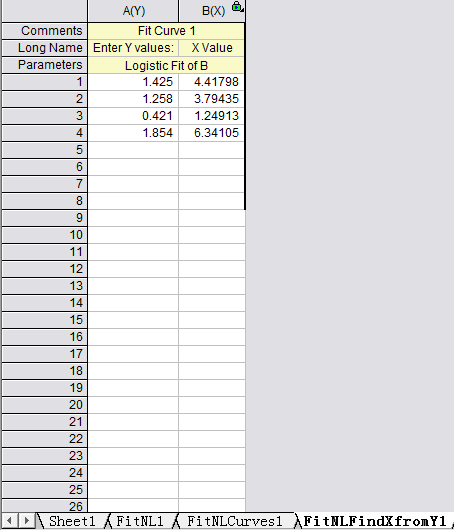
Step 6: Calculate the concentration according to the curve
Select the 4th work sheet (Fit NLF Find X from Y1), input or copy
the OD value of the sample to the left column, the concentration will be calculated
automatically.
If the OD value of the sample is out of upper limit of the standard
curve in sandwich(or out of the lower limit of competitive ELISA), these samples should be diluted before
proceeding with the ELISA to obtain an accurate result. As for these samples, the concentration obtained
from the standard curve must be multiplied by the dilution factor when analyzing the results.

