Flow cytometry (FCM) is a technology that uses a flow cytometer as the detection instrument, enabling rapid, accurate, and objective measurement of multiple characteristics of individual biological particles simultaneously, with quantification, and also allows sorting of specific populations. Since its emergence in the 1960s, it has become the gold standard detection tool in fields such as immunology, oncology, hematology, and cell biology. Unlike traditional microscopic observation or population-averaging analysis methods, flow cytometry can detect tens of thousands of cells in a short time and simultaneously acquire multiple characteristic parameters of each cell. So, what principles does this technology rely on? And what parameters of cells can it measure? This article will systematically elaborate from three aspects: basic principles, measurable parameters, and typical applications.
Table of Contents
1. How flow cytometry works: core principles and detection mechanisms
2. What can flow cytometry measure? Key cellular parameters and biomarkers
3. Common applications of flow cytometry in biomedical research
01 How flow cytometry works: core principles and detection mechanisms
1.1 Single-cell hydrodynamic focusing (hydrodynamic focusing)
Flow cytometry requires cells to pass through the detection point one by one; otherwise, accurate signals from individual cells cannot be obtained. This goal is achieved through hydrodynamic focusing. The cell suspension in the sample tube is introduced into the sheath fluid stream, which surrounds the sample stream at a higher speed and greater pressure, passing through a narrow nozzle. Due to laminar flow between the two liquids, the sample stream is compressed into a thin line only a few micrometers in diameter, ensuring that cells are arranged in single file along this line.
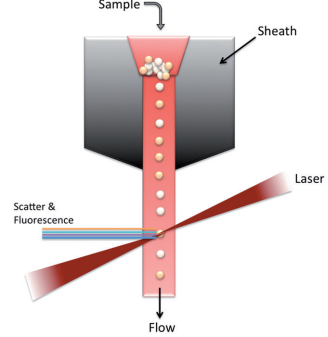
Fig. 1 Single-cell hydrodynamic focusing.
After successfully preparing a single-cell suspension, the single cells surrounded by sheath fluid allow subsequent laser excitation and signal detection to reflect the independent characteristics of each cell, thereby obtaining accurate statistical distributions[1].
1.2 Laser excitation
When cells in single file pass through the detection point, one or more laser beams of specific wavelengths are directed perpendicularly onto the cells. Commonly used lasers include 488 nm (blue), 640 nm (red), 405 nm (violet), etc. The cell's own structure (such as size, granularity) and the fluorescent dyes labeled on its surface, cytoplasm, or nucleus generate two types of signals upon laser irradiation:
Scattered light: direct scattering of the laser by the cell.
Fluorescence: cells bound to fluorochrome-labeled antibodies or dyes emit fluorescence of specific wavelengths upon excitation.
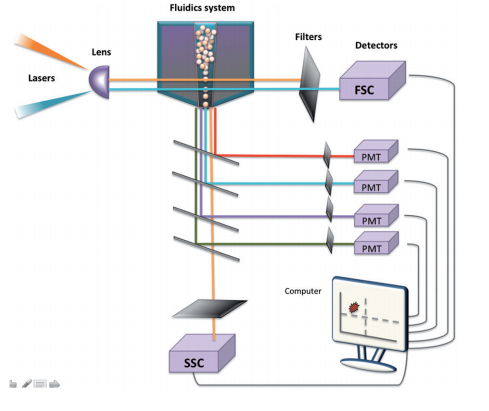
Fig. 2 Laser excitation and signal detection in flow cytometry.
1.3 Optical signal collection
Scattered light and fluorescence are collected separately and directed to different detectors.
Forward Scatter (FSC): collects scattered light at small angles (0.5°–10°) relative to the laser beam direction. FSC intensity is generally correlated with cell size: larger cells produce stronger FSC, while smaller cells produce weaker FSC.
Side Scatter (SSC): collects scattered light at a perpendicular direction (approximately 90°) to the laser beam. SSC is very sensitive to the internal complexity of cells (such as granules, nuclear lobulation, cytoplasmic granules): complex cells like granulocytes have high SSC, while lymphocytes have low SSC.
Fluorescence signals: also collected at the 90° direction, but after passing through a series of dichroic mirrors and bandpass filters, they are received by fluorescence detectors (photomultiplier tubes, PMTs) of different wavelengths. Through filter combinations, multiple different colors of fluorescence can be distinguished simultaneously.
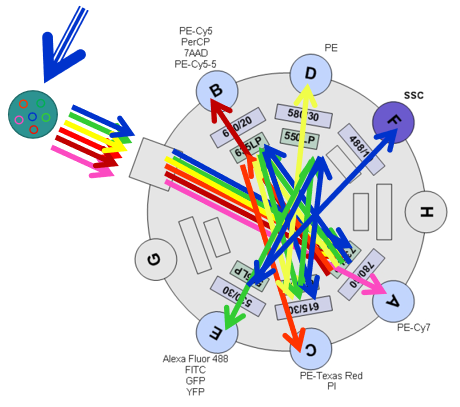
Fig. 3 Optical signal collection in flow cytometry.
1.4 Electronic signal processing and sorting
The light signals received by the detectors are converted into electronic pulses. The height, area, and width of each pulse reflect the characteristics of that cell. The computer converts these analog signals into digital signals and stores them as single-cell data. Through software analysis, graphs such as scatter plots and histograms can be generated. If the instrument is equipped with a sorting function (FACS, fluorescence-activated cell sorting), target cell populations can be physically separated after detection. The specific process is: when a cell meeting preset conditions is detected, the instrument charges the droplet in an instant, and then uses deflection plates to make the charged droplet fall into a designated collection tube.
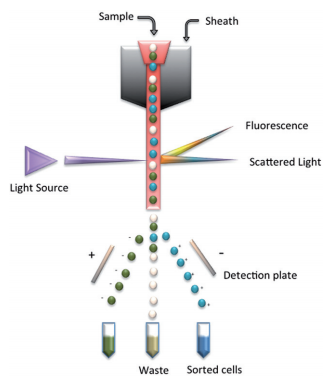
Fig. 4 Cell sorting in flow cytometry.
02 What can flow cytometry measure? Key cellular parameters and biomarkers
2.1 Cell physical structure parameters and technical advantages
Without any staining, the flow cytometer can directly measure two basic physical parameters:
Cell size: reflected by FSC. For example, lymphocytes (6–10 µm) have lower FSC than monocytes (12–20 µm).
Cell internal complexity: reflected by SSC. For example, in peripheral blood, lymphocytes have low SSC, monocytes have moderate SSC, and neutrophils have the highest SSC.
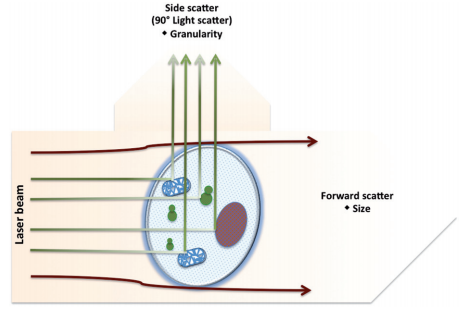
Fig. 5 Physical structure parameters measured by flow cytometry.
2.2 Cell biochemical and molecular parameters (via fluorescent labeling)
By using antibodies or fluorescent dyes labeled with different fluorophores, various molecular characteristics within cells can be measured:
Antigen expression (immunophenotype): using fluorescently labeled antibodies to detect cell surface or intracellular proteins, such as CD4, CD8, cytokines, etc. The proportion of positive cells or fluorescence intensity (reflecting expression density) can be quantified.
DNA content and cell cycle: after staining with DNA dyes such as PI (propidium iodide) or DAPI, distinguish G0/G1 phase (diploid), S phase (synthesis phase), and G2/M phase (tetraploid) based on fluorescence intensity.
Apoptosis: Annexin V combined with PI staining can distinguish viable cells, early apoptotic cells, and late apoptotic/necrotic cells.
Cell proliferation: CFSE (carboxyfluorescein diacetate succinimidyl ester) labeling method, where fluorescence intensity halves with each cell division, allowing tracking of up to 8 generations of cells.
Reactive oxygen species (ROS), calcium ion concentration, mitochondrial membrane potential: respectively measured functionally using corresponding fluorescent probes.
2.3 High-throughput and multi-parameter capability
High-throughput: a standard flow cytometer can analyze thousands to tens of thousands of cells per second, obtaining data from tens of thousands of cells within minutes, with high statistical reliability.
Multi-parameter: flow cytometers can simultaneously detect over 20 fluorescence parameters (multicolor flow cytometry), and spectral flow cytometry can even exceed 40 parameters. This means that from a single cell, one can simultaneously obtain its size, complexity, dozens of antigen expressions, cell cycle position, apoptosis status, and other functional information.
03 Common applications of flow cytometry in biomedical research
3.1 TBNK lymphocyte subset analysis
TBNK is one of the most routine flow cytometry applications, referring to total T cells (CD3+), B cells (CD19+), natural killer cells (NK, CD3−CD56+), as well as helper T cells (CD3+CD4+), cytotoxic T cells (CD3+CD8+), allowing rapid acquisition of the proportions and absolute counts of each subset.
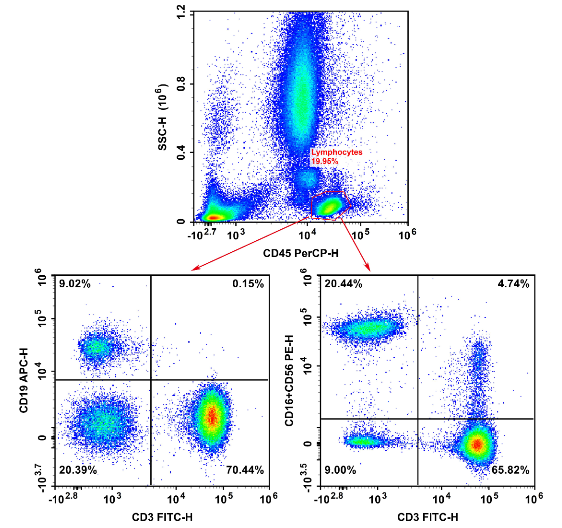
Fig. 6 Human TBNK subset analysis.
T, B, and NK cells mediate adaptive immunity and innate immunity respectively, and together they form the core framework of the human immune system. To assess cellular immune status, use the detection of various immune cell ratios. Clinically, it can be used for the auxiliary diagnosis of autoimmune diseases, immunodeficiency diseases, and lymphoproliferative diseases.
3.2 Treg regulatory T cell detection
Tregs are core regulatory cells that maintain immune self-tolerance and immune homeostasis; they actively suppress excessive immune responses, prevent autoimmunity and chronic inflammation, but also become key drivers of tumor immune escape.
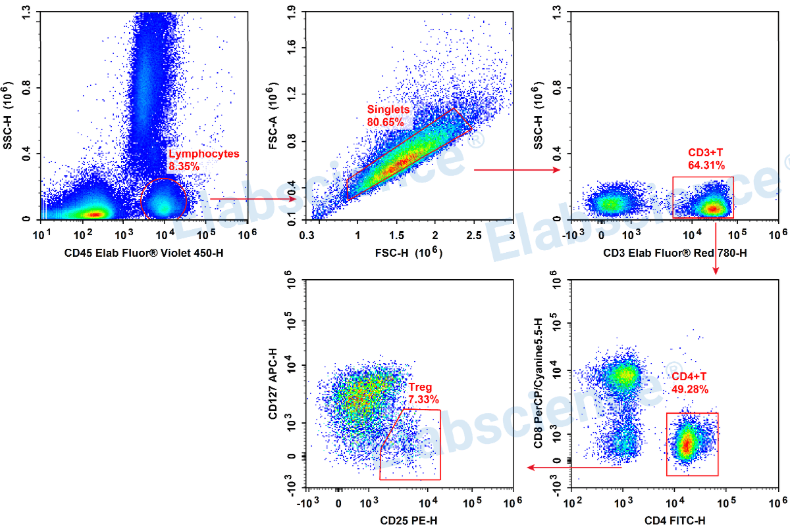
Fig. 7 Human Treg subset analysis.
Tregs play a crucial role in the pathogenesis and therapeutic targets of autoimmune diseases, negative regulation of tumor immunity, induction of transplantation tolerance, and research on allergic diseases and reproductive immunity.
3.3 Th17 helper T cell detection
Th17 is a unique pro-inflammatory subset within the effector T cell family, characterized mainly by the secretion of IL-17A; it fills the gaps in specific pathogen defense and autoimmune inflammation mechanisms that the traditional Th1/Th2 paradigm could not explain.
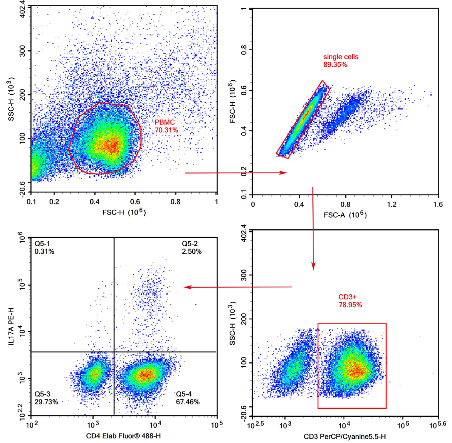
Fig. 8 Human Th17 subset analysis.
Th17 is an important cell connecting adaptive immunity and innate immunity, defending against pathogens and causing autoimmune pathology.
Conclusion:
Flow cytometry, with hydrodynamic focusing, laser excitation, multi-signal collection, and electronic processing/sorting as its core principles, achieves high-throughput, multi-parameter analysis of single cells. It can not only directly measure cell size and internal complexity but also precisely evaluate various biochemical and molecular characteristics such as antigen expression, DNA content, cell cycle, apoptosis, and proliferation through fluorescent labeling. Based on these capabilities, typical applications such as TBNK subset analysis, Treg and Th17 detection have played an irreplaceable role in immune status assessment, autoimmune disease monitoring, tumor immunity, and transplantation tolerance. Flow cytometry connects basic cell biology and clinical diagnosis, serving as an important technical pillar in the era of precision medicine.
References:
[1] Adan A, Alizada G, Kiraz Y, Baran Y, Nalbant A. Flow cytometry: basic principles and applications. Crit Rev Biotechnol. 2017 Mar; 37(2):163-176. doi: 10.3109/07388551.2015.1128876. Epub 2016 Jan 14. PMID: 26767547.

