

Microglial polarization is central to understanding the chronic neuroinflammation that drives neurodegenerative diseases, and the BV2 cell line has become the most widely used in vitro model for studying this process. Despite its popularity, researchers often encounter challenges such as suboptimal M1 polarization efficiency, confusion over flow cytometric marker selection, and difficulty determining the optimal induction time, leading to repeated optimization and wasted effort. This article brings together the complete workflow for BV2 M1 polarization, covering the underlying biological mechanisms and providing a practical, ready-to-use protocol to help streamline your experiments.
Table of Contents
1. Current Status of Neurodegenerative Disease Research
2. Microglia: The Brain's "Two-Faced Immune Sentinels"
3. BV2 Cells: A "Powerful Tool" for Studying Microglia
4. BV2 Cell Polarization Culture and Flow Cytometry Detection Protocol
01 Current Status of Neurodegenerative Disease Research
Alzheimer's disease (AD) and Parkinson's disease (PD) are the most common central neurodegenerative disorders, posing a severe health challenge to aging societies worldwide. The global number of AD patients is rising sharply, while the prevalence of PD has increased by 74.3% over the past three decades, with the patient population expected to double by 2040[1]. However, current therapeutic approaches for these two diseases remain primarily symptomatic, lacking treatments that can effectively slow or reverse disease progression[1,4]. This therapeutic dilemma has compelled the scientific community to re-examine the fundamental pathological mechanisms underlying neurodegenerative diseases.
Why do neurons continue to die? Over the past several decades, a substantial body of genetic, pathological, and neuroimaging evidence has pointed to a central factor: chronic neuroinflammation[1,2]. Genome-wide association studies (GWAS) have identified over 80 independent genetic risk loci associated with AD, and pathway analyses indicate that innate and adaptive immune responses are key pathways in AD pathogenesis. Notably, nearly one-quarter of potential AD genetic risk genes are highly or specifically expressed in microglia[1]. In PD, substantial accumulation of activated microglia in the substantia nigra pars compacta and significantly elevated levels of pro-inflammatory cytokines have also been observed.
In this "fire" of neuroinflammation, are microglia, the resident immune cells of the brain, "firefighters" or "arsonists"? The answer is not black and white, but highly dependent on their polarization state.
02 Microglia: The Brain's "Two-Faced Immune Sentinels"
Microglia are the resident macrophages of the central nervous system, originating from yolk sac progenitor cells in early embryonic development and accounting for 5%–20% of glial cells in the brain. They are widely distributed throughout the brain parenchyma in a ramified, resting state, continuously extending and retracting their processes to monitor subtle changes in the microenvironment, thus constituting the brain's first line of immune defense[3]. Microglia express a rich array of pattern recognition receptors on their surface, enabling them to acutely recognize pathogen-associated molecular patterns (PAMPs) and damage-associated molecular patterns (DAMPs), such as Aβ aggregates, α-synuclein, and other aberrant proteins, and rapidly initiate immune responses[3,4].
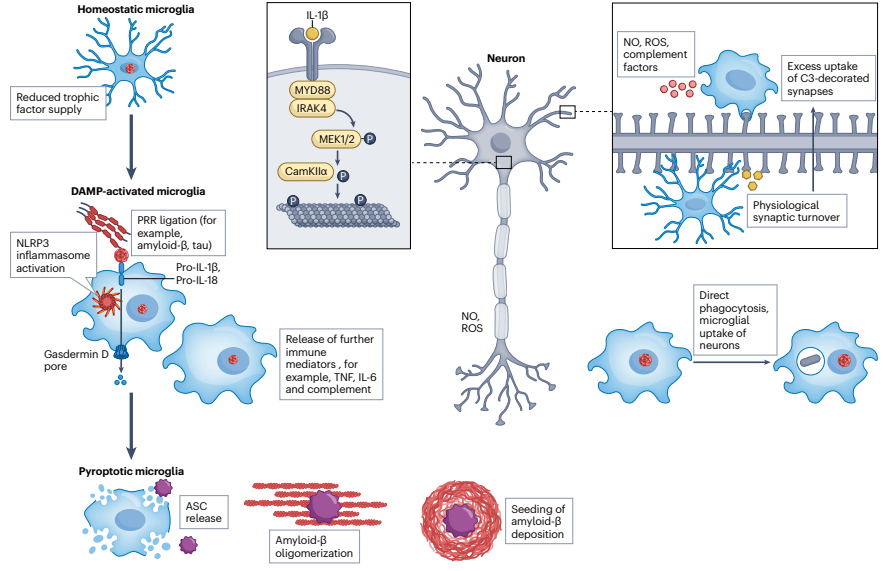
Fig. 1 Local neuron–microglia interactions in Alzheimer's disease[1]. In Alzheimer's disease, homeostatic microglia are activated by pathological proteins such as Aβ and tau, triggering the NLRP3 inflammasome and releasing IL-1β and IL-18. IL-1β promotes tau phosphorylation and neurofibrillary tangle formation; activated neurons in turn release factors including TNF, IL-6, and reactive oxygen species, exacerbating neuronal damage. Sustained inflammation can lead to microglial pyroptosis, releasing ASC specks that further promote Aβ aggregation. Meanwhile, complement C3 excessively tags synapses, leading to aberrant synaptic pruning; neurons lacking "don't-eat-me" signals may even be completely phagocytosed by microglia.
Upon stimulation by distinct microenvironmental signals, microglia can polarize into functionally divergent subtypes. The classical classification divides them into the M1 phenotype (pro-inflammatory/neurotoxic) and the M2 phenotype (anti-inflammatory/neuroprotective)[3]. M1 microglia are activated by stimuli such as lipopolysaccharide and interferon-γ, releasing abundant pro-inflammatory cytokines, including TNF-α, IL-1β, IL-6, as well as reactive oxygen and nitrogen species. These mediators can directly induce neuronal damage and exacerbate synaptic toxicity[3,4]. In the cerebrospinal fluid and serum of patients with PD and AD, the levels of these pro-inflammatory cytokines are significantly elevated and closely correlate with cognitive decline and disease progression[1,4]. In contrast, M2 microglia, induced by signals such as IL-4 and IL-13, express markers including arginase-1, CD206, and TREM2, secrete anti-inflammatory cytokines such as IL-10 and transforming growth factor-β, and exhibit enhanced phagocytic capacity to clear Aβ and cellular debris, thereby promoting tissue repair and neuronal survival[3].
The significance of polarization balance lies in the fact that the dynamic equilibrium between M1 and M2 determines the trajectory of neuroinflammation. During the pathological progression of AD and PD, chronic aberrant protein aggregation and persistent DAMPs continuously activate microglia, skewing them toward the M1 phenotype while the protective M2 phenotype remains relatively insufficient, establishing a vicious cycle of "pro-inflammation → neuronal damage → release of more DAMPs" [2,4]. Therefore, promoting the phenotypic switch of microglia from M1 to M2 has emerged as an important research direction for therapeutic strategies in neurodegenerative diseases.
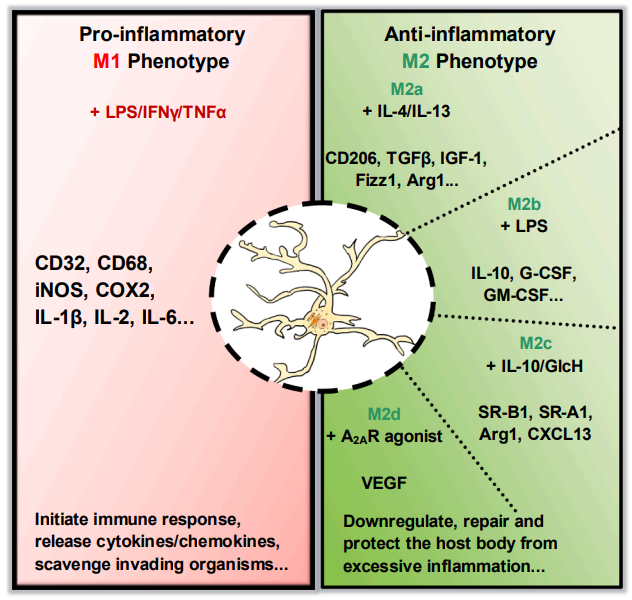
Fig. 2 Activation phenotypes of microglia[3]. The figure indicates the molecules that induce classical (M1) or alternative (M2) activation pathways, and displays the molecules expressed by differently polarized cells (M1, M2a, M2b, M2c, and M2d).
03 BV2 Cells: A "Powerful Tool" for Studying Microglia
The BV2 cell line is a murine microglial cell line established by immortalizing neonatal mouse microglia with v-raf/v-myc retrovirus, and is currently one of the most commonly used in vitro models for studying microglial function and polarization mechanisms. BV2 cells retain key characteristics of primary microglia, including the expression of TLR4 receptors, the ability to release inflammatory cytokines upon stimulation with LPS, and the capacity to exhibit M1/M2 polarization states[5]. Since its establishment in 1992, this cell line has become an important bridging tool connecting in vitro mechanistic studies with in vivo animal models, offering the following advantages:
3.1 Stable passage and ease of genetic manipulation
BV2 cells can be stably passaged, eliminating the laborious process of repeatedly isolating primary microglia from neonatal mouse brain tissue and significantly reducing the need for experimental animals[6]. Their immortalized nature makes them particularly suitable for genetic manipulations such as gene transfection, RNA interference, and CRISPR editing, facilitating mechanistic studies of signaling pathways.
3.2 Responsive to LPS and other stimuli, with inducible M1/M2 polarization
BV2 cells highly express TLR4 on their surface. Upon LPS stimulation, they activate NF-κB and MAPK signaling pathways via the MyD88-dependent pathway, inducing classical M1 polarization and releasing abundant pro-inflammatory cytokines such as TNF-α, IL-1β, IL-6, iNOS, and COX-2[5,7]. Meanwhile, M2 polarization can be induced by treatment with IL-4, IL-13, and other factors, with expression of anti-inflammatory markers including ARG-1, CD206, and IL-10.
3.3 Excellent experimental reproducibility
Compared with primary microglia, the BV2 cell line provides a highly homogeneous cell population, eliminating individual variability and batch effects from isolation and purification procedures, thereby ensuring good reproducibility of experimental results[7].
04 BV2 Cell Polarization Culture and Flow Cytometry Detection Protocol
4.1 General preparation
BV2 cells are thawed and passaged to expand to the logarithmic growth phase. Cells are harvested by digestion (BV2 cells adhere loosely; trypsin digestion time should not be prolonged, and pipetting should be gentle), and the cell density is adjusted to an appropriate concentration (recommended: 5 × 10⁵ cells/mL). Cells are seeded into suitable culture plates and cultured in complete medium (high-glucose DMEM containing 10% FBS) at 37°C in a 5% CO₂ incubator for overnight attachment.
4.2 M1 polarization
The old medium is aspirated and replaced with fresh complete medium containing LPS (100 ng/mL) and IFN-γ (20 ng/mL). Cells are incubated at 37°C in a 5% CO₂ incubator for 24 h. After induction, cells or supernatants are collected for subsequent assays.
4.3 M2 polarization
The old medium is aspirated and replaced with fresh complete medium containing IL-4 (20 ng/mL) and IL-13 (20 ng/mL). Cells are incubated at 37°C in a 5% CO₂ incubator for 24 h. After induction, cells or supernatants are collected for subsequent assays.
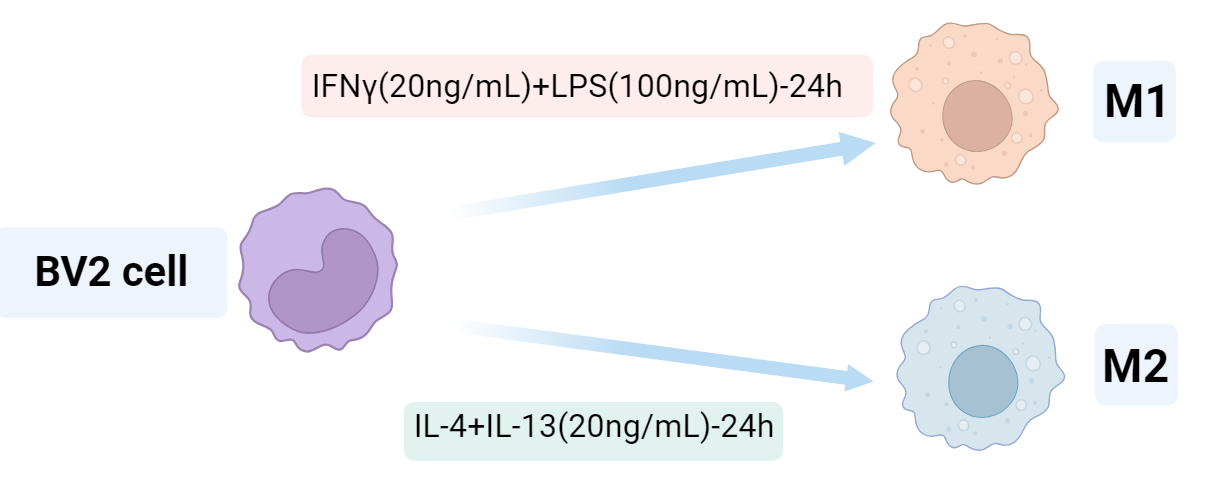
Fig. 3 BV2 cell polarization culture workflow.
4.4 Flow cytometry detection
(1) Collect the cell suspension and centrifuge at 150 × g for 3 min.
(2) Discard the supernatant, resuspend the cell pellet in Cell Staining Buffer (E-CK-A107) or PBS buffer, and adjust the cell density to 1–10 × 106 cells/mL.
(3) Take 100 μL of the cell suspension, add 2 μL of Purified Anti-Mouse CD16/32 Antibody (E-AB-F0997A) to each tube, mix gently by pipetting, and incubate at room temperature in the dark for 10 min to block Fc receptors on the cell surface.
(4) Add the respective flow cytometry antibodies (5 μL/test), mix gently by pipetting, and incubate at 4°C in the dark for 30 min.
(5) After incubation, add 1 mL of Cell Staining Buffer ((E-CK-A107)) to each tube, mix gently by pipetting, centrifuge at 150 × g for 3 min, and discard the supernatant.
(6) Resuspend the cell pellet in 200 μL of Cell Staining Buffer (E-CK-A107) and proceed to flow cytometry analysis.
4.5 Cytokine detection
(1) Four hours before cell collection, add Cell Stimulation MIX (E-CK-A019) and Protein Transport Inhibitor MIX (E-CK-A013) to the cells, and mix gently by pipetting.
(2) Collect the cells. Following the protocol of the Intracellular Fixation/Permeabilization Buffer Kit (E-CK-A109), first perform surface staining with other antibodies, then proceed with fixation and permeabilization, followed by staining with TNF-α antibody. Detect cytokine expression by flow cytometry.
4.6 Results of BV2 cell polarization toward the M1 macrophage phenotype
BV2 cells were treated with LPS (100 ng/mL) and IFN-γ (20 ng/mL) to induce M1 polarization. Cells were harvested at 24 h and 48 h post-induction, respectively. The expression of F4/80, CD86, CD206, and TNF-α on BV2 cells was detected by flow cytometry to compare the effects of different induction durations on polarization efficiency.
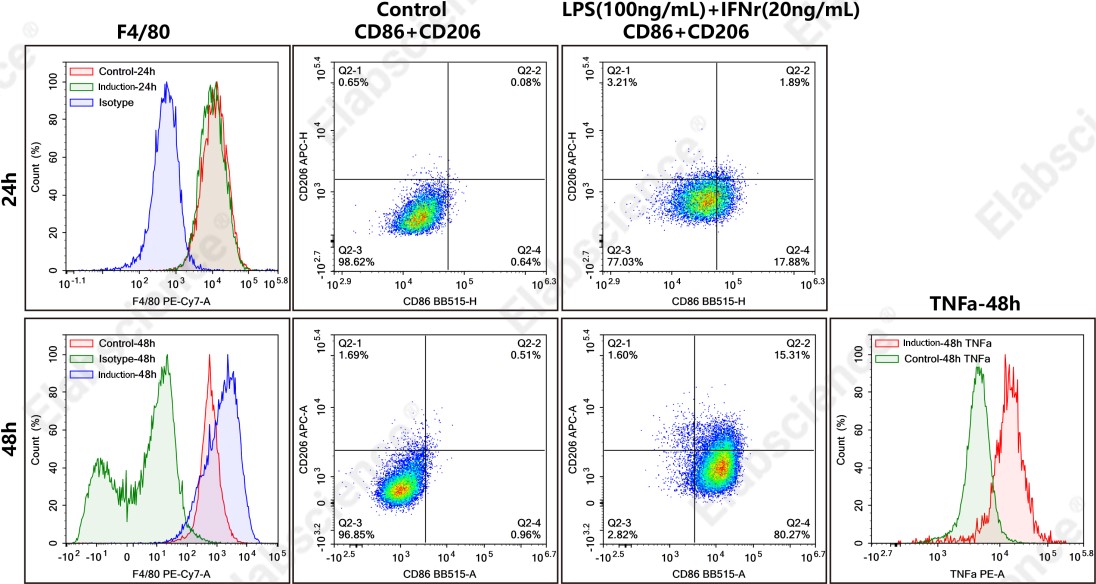
Fig. 4 Detection results of BV2 cell M1 polarization. BV2 cells were treated with LPS (100 ng/mL) and IFN-γ (20 ng/mL) for 24 h or 48 h, respectively. The expression of F4/80, CD86, CD206, and TNF-α on BV2 cells was then detected by flow cytometry to compare the induction efficiency of the two treatment conditions.
As shown in the figure, compared with the untreated Control group, BV2 cells induced with LPS + IFN-γ for 24 h showed no obvious F4/80 expression, and the proportion of M1 macrophages (CD86⁺CD206⁻) was 17.88%. In contrast, after 48 h of induction, F4/80 expression in BV2 cells was markedly upregulated relative to the Control group, and the proportion of M1 macrophages further increased to 80.27%. Additionally, TNF-α expression in the induced cells was also significantly elevated compared with the Control group. These results indicate that a 48 h induction period achieves better M1 polarization efficiency in BV2 cells.
Elabscience® Recommended Products:
Table 1. Products used for BV2 microglia polarization and flow cytometry detection
|
Cat. No. |
Product Name |
|
E-CK-A107 |
Cell Staining Buffer |
|
E-AB-F0997A |
Purified Anti-Mouse CD16/32 Antibody[2.4G2] |
|
E-CK-A091 |
Cell Stimulation and Protein Transport Inhibitor Kit |
|
E-CK-A109 |
Intracellular Fixation/Permeabilization Buffer Kit |
|
E-AB-F0995H |
PE/Cyanine7 Anti-Mouse F4/80 Antibody[CI:A3-1] |
|
E-AB-F0994C |
FITC Anti-Mouse CD86 Antibody[GL-1] |
|
E-AB-F1135E |
APC Anti-Mouse CD206/MMR Antibody[C068C2] |
|
AN00567D |
PE Anti-Mouse TNFα Antibody[XT3.11] |
From the in vitro polarization model of BV2 cells to the precise corroboration of flow cytometry data (in which CD86 upregulation parallels a surge in TNF-α), we have not only recapitulated the pro-inflammatory switch of M1-type microglia but also unveiled the core chain by which they drive neurodegeneration through the release of inflammatory cytokines. Targeting polarization imbalance may light up new hope for overcoming neurodegenerative diseases such as Alzheimer's disease. Elabscience® offers a comprehensive suite of flow cytometry antibody solutions to facilitate precise dissection of macrophage phenotype and functional studies. What other curiosities do you have about macrophage research? Feel free to leave a comment and join the discussion!
References:
[1]Heneka MT, van der Flier WM, Jessen F, et al. Neuroinflammation in Alzheimer disease. Nature Reviews Immunology. 2024;25(5):321-352. DOI: 10.1038/s41577-024-01104-7
[2]Yao J, Wang Z, Song W, Zhang Y. Targeting NLRP3 inflammasome for neurodegenerative disorders. Molecular Psychiatry. 2023;28(11):4512-4527. DOI: 10.1038/s41380-023-02239-0
[3]Wang Z, Weaver DF. Microglia and microglial-based receptors in the pathogenesis and treatment of Alzheimer's disease. International Immunopharmacology. 2022;110:109070. DOI: 10.1016/j.intimp.2022.109070
[4]Dong-Chen X, Yong C, Yang X, Chen-Yu S, Li-Hua P. Signaling pathways in Parkinson's disease: molecular mechanisms and therapeutic interventions. Signal Transduction and Targeted Therapy. 2023;8(1). DOI: 10.1038/s41392-023-01353-3
[5]Cao CY, Yang YX, Xie Z, et al. Derivatives of sarcodonin A isolated from Sarcodon scabrosus reversed LPS-induced M1 polarization in microglia through MAPK/NF-κB pathway. Bioorganic Chemistry. 2022;125:105854. DOI: 10.1016/j.bioorg.2022.105854
[6]Das A, Kim SH, Arifuzzaman S, et al. Transcriptome sequencing reveals that LPS-triggered transcriptional responses in established microglia BV2 cell lines are poorly representative of primary microglia. Journal of Neuroinflammation. 2016;13(1). DOI: 10.1186/s12974-016-0644-1
[7]Chen HL, Yang L, Zhang XLN, et al. Scutellarin Acts via MAPKs Pathway to Promote M2 Polarization of Microglial Cells. Molecular Neurobiology. 2023;60(8):4304-4323. DOI: 10.1007/s12035-023-03338-3

