

B cell activation is a tightly regulated, multi-step process that transforms naive B lymphocytes into antibody-secreting plasma cells or long-lived memory B cells. This transformation is governed by the integration of extrinsic signals from the microenvironment and intrinsic signaling cascades initiated by the B cell receptor (BCR). The activation process is fundamentally dependent on two distinct signals: Signal 1, which involves antigen recognition by the BCR, and Signal 2, which consists of co-stimulatory inputs, most notably from CD40-CD40L interactions with T helper cells.
This review systematically elaborates the core fundamentals of B cell activation. It first provides a comprehensive overview of the initiating events and signaling cascades that trigger resting B cells to enter a proliferative state. The two predominant B cell activation pathways, namely T cell-dependent and T cell-independent pathways, are then delineated, with a focus on their distinct molecular prerequisites and temporal dynamic characteristics. This review further discusses the critical functions of diverse cytokines, which modulate the magnitude of B cell immune responses and direct the differentiation of activated B cells into antibody-secreting plasma cells and memory B cell compartments. Additionally, this work summarizes the surface marker profiles of activated B cells, establishing a feasible framework for B cell immunophenotyping via flow cytometry and other single-cell analytical technologies. Finally, the review outlines conventional experimental approaches for quantifying B cell activation, covering both functional biological assays and high-resolution analytical tools. Collectively, this review integrates mechanistic understandings of B cell activation and translational applications, providing a comprehensive and holistic perspective in this field.
Table of Contents
1. Overview of B cell activation
2. T cell-dependent and T cell-independent B cell activation pathways
3. Cytokines that regulate B cell activation and differentiation
4. Surface markers of activated B cell immunophenotyping
5. Experimental methods for measuring B cell activation
01 Overview of B cell activation
B cell activation proceeds via a sequential cascade tightly linked to anatomical microenvironments and is categorized into T-cell-dependent (TD) and T-cell-independent (TI) pathways. The TD pathway dominates responses to protein antigens and takes place at the T–B cell border within peripheral lymphoid organs including lymph nodes and the spleen. Naive B cells acquire primary stimulation upon antigen engagement by B cell receptors (BCRs). Subsequent interactions with follicular helper T (Tfh) cells via CD40L–CD40 ligation deliver essential co-stimulation alongside secreted cytokines[1,2].
Alternatively, the TI pathway is initiated by antigens bearing repetitive epitopes, such as bacterial polysaccharides and lipopolysaccharide (LPS). This response proceeds independent of T cell help: extensive BCR crosslinking mediates TI-2 activation, whereas direct mitogenic signals drive TI-1 activation. Both forms of TI responses occur predominantly within the splenic marginal zone and lymph node medulla[1,2].
Beyond upstream signaling, terminal differentiation products and anatomical localization differ substantially between TD and TI B cell activation. TD responses generate long-lived plasma cells and memory B cells, which sustain high-affinity humoral immunity and durable immunological memory. By contrast, TI stimulation yields only short-lived plasma cells localized to the spleen and lymph node medulla, mediating transient low-affinity protection without establishing immune memory. This functional and spatial segregation enables TD pathways to establish persistent adaptive immunity, while TI pathways mediate rapid frontline defense against invading pathogens[2,3].
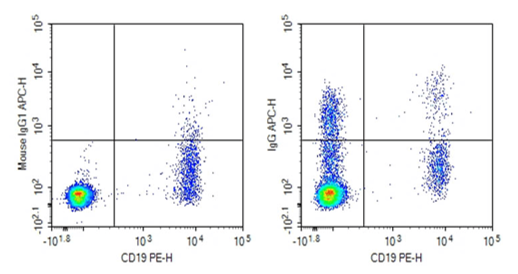
Fig. 1 Detection and analysis of IgG expression in human peripheral blood B lymphocytes. Human peripheral blood mononuclear cells (PBMCs) were stained with 0.2 μg purified anti-human IgG antibody (clone G18-145, right) or 0.2 μg mouse IgG1 κ isotype control antibody (left). Cells were subsequently incubated with APC-conjugated goat anti-mouse IgG secondary antibody, followed by staining with PE-conjugated anti-human CD19 monoclonal antibody. (The data are provided by Elabscience.)
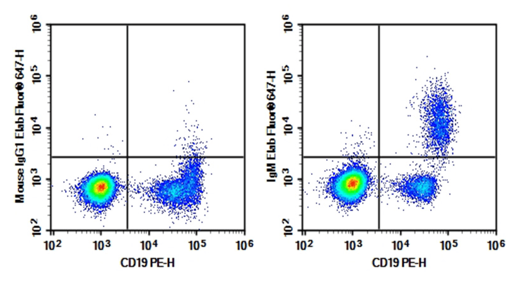
Fig. 2 Detection and analysis of IgM expression in human peripheral blood B lymphocytes. Human peripheral blood lymphocytes were stained with 0.2 μg Purified Anti-Human IgM Antibody[MHM-88] (Right) and 0.2 μg Mouse IgG1, κ Isotype Control (Left), followed by Elab Fluor® 647-conjugated Goat Anti-Mouse IgG Secondary Antibody, then anti-Human CD19 PE-conjugated Monoclonal Antibody. (The data are provided by Elabscience.)
Elabscience® Quick Overview of Popular Products:
Table 1. Reagents for research on high-affinity antibody generation by humoral immune B cells
|
Product Name |
Cat. No. |
|
Purified Anti-Human IgM Antibody[MHM-88] |
E-AB-F11720P |
|
PE/Cyanine5.5 Anti-Human IgM Antibody[MHM-88] |
E-AB-F1172I |
|
Elab Fluor® 700 Anti-Human IgM Antibody[MHM-88] |
E-AB-F1172M1 |
|
Purified Anti-Human IgG Antibody[G18-145] |
AN010450P |
|
PE Anti-Mouse CD19 Antibody[1D3] |
E-AB-F0986D |
|
PE Anti-Human/Monkey CD19 Antibody[CB19] |
E-AB-F1004D |
|
PE Anti-Mouse CD40 Antibody[FGK4.5/FGK45] |
E-AB-F1028D |
|
FITC Anti-Human CD40 Antibody[3A8] |
E-AB-F1037C |
|
Elab Fluor® 647 Anti-Human CD154 (CD40L) Antibody[24-31] |
AN00341M |
|
Mouse IgG(Immunoglobulin G) ELISA Kit |
E-EL-M0692 |
|
Human IgG(Immunoglobulin G) ELISA Kit |
E-EL-H0169 |
|
Porcine IgG(Immunoglobulin G) ELISA Kit |
E-EL-P0004 |
|
QuicKey Pro Mouse IgA(Immunoglobulin A) ELISA Kit |
E-OSEL-M0007 |
|
Rat IgA(Immunoglobulin A) ELISA Kit |
E-EL-R3015 |
|
QuicKey Pro Human IgA(Immunoglobulin A) ELISA Kit |
E-OSEL-H0009 |
|
Human PBMC Separation Solution(P 1.077) |
E-CK-A103 |
|
10×ACK Lysis Buffer |
E-CK-A105 |
|
10× RBC Lysis/Fixation Solution |
E-CK-A106 |
02 T cell-dependent and T cell-independent B Cell activation pathways
B cell activation is a fundamental process in adaptive immunity, bifurcated into two distinct pathways: T cell-dependent (TD) and T cell-independent (TI) activation. These pathways differ significantly in their antigen requirements, signaling mechanisms, cellular locations, and the nature of the resulting immune response. The choice between these pathways dictates whether the immune system generates high-affinity, class-switched antibodies with long-term memory or rapid, lower-affinity responses primarily involving IgM. Understanding these distinctions is critical for vaccine design and the treatment of autoimmune diseases where B cell signaling is aberrant[4].
2.1 T Cell-Dependent (TD) B Cell Activation
TD activation is the primary mechanism for generating robust, long-lasting humoral immunity against protein antigens. This process requires direct interaction between B cells and CD4+ T helper cells, specifically T follicular helper (Tfh) cells, within secondary lymphoid organs. The activation initiates when the B cell receptor (BCR) binds to its specific antigen. The BCR complex, consisting of membrane-bound immunoglobulin associated with the CD79a/CD79b heterodimer, transduces the signal via phosphorylation of immunoreceptor tyrosine-based activation motifs (ITAMs) by Src-family kinases. This triggers a cascade involving Syk, BTK, and PLCγ2, leading to the activation of NF-κB, MAPK, and PI3K-AKT pathways[4,5].
Following antigen internalization, the B cell processes the protein and presents peptides on MHC class II molecules to Tfh cells. The critical “second signal” is delivered through the interaction of CD40 on the B cell with CD40L on the T cell. This CD40-CD40L engagement is indispensable for germinal center (GC) formation, somatic hypermutation, and class-switch recombination (CSR). Concurrently, cytokines such as IL-4 and IL-21 (which can be detected by IL-21 ELISA), secreted by Tfh cells, further drive B cell proliferation and B cell differentiation into plasma cells and memory B cells. The metabolic demands of this intense proliferation are met through immunometabolic reprogramming, including increased glycolysis and mitochondrial activity. The outcome of TD activation is the production of high-affinity, class-switched antibodies (IgG, IgA, IgE) and the establishment of long-lived memory B cells[5].
2.2 T Cell-Independent (TI) B Cell Activation
TI activation occurs in response to antigens that can cross-link the BCR extensively without T cell help, such as polysaccharides, lipids, and nucleic acids with repetitive structures. This pathway is divided into two subsets: TI-1 and TI-2. TI-1 responses are often driven by microbial components like lipopolysaccharide (LPS) that engage both the BCR and innate receptors such as Toll-like receptors (TLRs), particularly TLR4 and TLR9. TI-2 responses involve highly multivalent antigens that cross-link many BCRs simultaneously, providing a strong enough signal to activate the B cell directly[6].
TI activation typically occurs in extrafollicular regions of the spleen or lymph nodes, such as the marginal zone, rather than in germinal centers. Because it lacks T cell-derived signals like CD40L and cytokines, TI activation does not generally lead to somatic hypermutation or extensive class switching. Consequently, the primary antibody produced is IgM, although some limited switching to IgG2 (in mice) or IgG2/IgG4 (in humans) can occur, particularly in TI-2 responses involving cytokines from innate cells. TI responses are crucial for early defense against encapsulated bacteria but do not generate robust long-term memory[6].
2.3 Signaling Pathways and Co-receptor Integration
Both TD and TI pathways rely on the core BCR signaling machinery involving CD79a/CD79b, Syk, and downstream effectors. However, the integration of co-receptors differs. In TD responses, the CD19/CD21 co-receptor complex amplifies BCR signaling by lowering the threshold for activation when complement-opsonized antigens are present. In TI responses, innate receptors like TLRs play a more prominent role, providing signals that substitute for T cell help. The NF-κB pathway is central to both, but its regulation and duration vary, influencing whether the cell undergoes apoptosis, anergy, or activation[6,7].
In summary, TD activation leads to high-affinity, class-switched antibodies and memory through T cell collaboration and germinal center reactions, while TI activation provides rapid, mostly IgM-mediated defense against repetitive antigens without significant memory formation. The distinct signaling requirements and outcomes of these pathways highlight the versatility of the B cell response in combating diverse pathogens.
Table 2. Head-to-head comparison of T cell-dependent (TD) and T cell-independent (TI) B cell activation pathways[5,6,7]
|
Dimension |
TD Pathway |
TI Pathway |
|
Typical antigens |
Proteins |
Polysaccharides, lipopolysaccharides, nucleic acids |
|
T cell requirement |
Essential (CD40L, cytokines) |
None |
|
Primary site(s) |
Unfolds progressively from the T–B border to extrafollicular foci and ultimately the germinal center. |
Spleen marginal zone/mucosal B-1 zones |
|
Key receptor interactions |
BCR, MHC-II-TCR, CD40-CD40L, and cytokine receptors |
Extensive BCR cross-linking combined with TLR or other pattern-recognition receptor signaling, and sometimes complemented by complement receptor CD21 engagement. |
|
Intracellular master switches |
Bcl-6 up-regulated (GC), Blimp-1 up-regulated (plasma cell) |
Blimp-1 (baseline high in marginal zone B cells) |
|
Somatic hypermutation |
Extensive (GC) |
Negligible |
|
Class switch recombination |
Full (to all isotypes) |
Limited/absent (mostly IgM) |
|
Affinity |
High (post-maturation) |
Low–moderate |
|
Duration of protection |
Long-term (memory and long-lived plasma cells) |
Short-term (transient plasmablasts) |
|
Vaccine relevance |
Subunit, mRNA, protein, conjugate vaccines |
Pure polysaccharide vaccines; conjugate vaccines convert TI antigens into TD format |
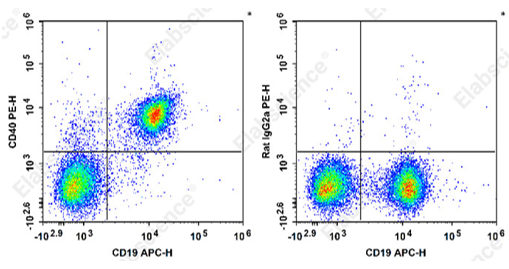
Fig. 3 Detection of CD40 expression in B cells from C57BL/6 murine splenocytes. C57BL/6 murine splenocytes were stained with APC Anti-Mouse CD19 Antibody[1D3] (E-AB-F0986E) and PE Anti-Mouse CD40 Antibody[FGK4.5/FGK45](E-AB-F1028D) (left) or PE Rat IgG2a, κ Isotype Control (right). Total viable cells were used for analysis. (The data are provided by Elabscience.)
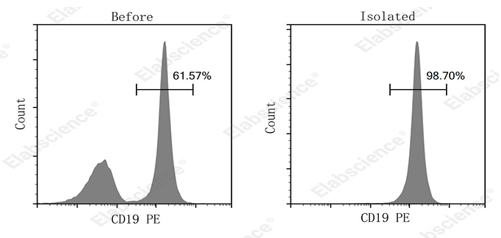
Fig. 4 Detection of B cells isolated from mouse tissues. B cells were sorted from C57BL/6 mice splenocyte using the EasySort™ Mouse B Cell Isolation Kit (MIM004N), then stained with PerCP Anti-Mouse CD45 Antibody[30-F11] (E-AB-F1136F) and PE Anti-Mouse CD19[1D3] (E-AB-F0986D). The purities of the initial unseparated population and final enriched CD45+CD19+ B cell fraction were 61.57% and 98.70%, respectively. (The data are provided by Elabscience.)
Elabscience® Quick Overview of Popular Products:
Table 3. Reagents used for B cell research
|
Product Name |
Cat. No. |
|
EasySort™ Mouse B Cell Isolation Kit |
MIM004N |
|
EasySort™ Mouse CD4+T Cell Isolation Kit |
MIM002N |
|
EasySort™ Human CD4+ T Cell Isolation Kit |
MIH002N |
|
EasySort™ Human B Cell Isolation Kit |
MIH004N |
|
PE Anti-Mouse CD19 Antibody[1D3] |
E-AB-F0986D |
|
PE Anti-Human/Monkey CD19 Antibody[CB19] |
E-AB-F1004D |
|
PE Anti-Mouse CD40 Antibody[FGK4.5/FGK45] |
E-AB-F1028D |
|
FITC Anti-Human CD40 Antibody[3A8] |
E-AB-F1037C |
|
Elab Fluor® 647 Anti-Human CD154 (CD40L) Antibody[24-31] |
AN00341M |
|
Mouse IgG(Immunoglobulin G) ELISA Kit |
E-EL-M0692 |
|
Human IgG(Immunoglobulin G) ELISA Kit |
E-EL-H0169 |
|
Porcine IgG(Immunoglobulin G) ELISA Kit |
E-EL-P0004 |
|
QuicKey Pro Mouse IgA(Immunoglobulin A) ELISA Kit |
E-OSEL-M0007 |
|
Rat IgA(Immunoglobulin A) ELISA Kit |
E-EL-R3015 |
|
QuicKey Pro Human IgA(Immunoglobulin A) ELISA Kit |
E-OSEL-H0009 |
|
Human PBMC Separation Solution(P 1.077) |
E-CK-A103 |
|
10×ACK Lysis Buffer |
E-CK-A105 |
|
10× RBC Lysis/Fixation Solution |
E-CK-A106 |
03 Cytokines that regulate B cell activation and differentiation
Cytokines function as pivotal extrinsic regulators that dictate the trajectory of B cell activation, B cell differentiation, and functional specialization within the adaptive immune system. These soluble mediators act in concert with B cell receptor (BCR) ligation and co-stimulatory signals to determine whether a naive B cell undergoes apoptosis, participates in germinal center reactions, or differentiates into antibody-secreting plasma cells or long-lived memory B cells. The cytokine milieu is largely dictated by the type of helper T cell involved, particularly T follicular helper (Tfh) cells, as well as innate sources such as dendritic cells[8].
Key cytokines including interleukin-4 (IL-4), interleukin-21 (IL-21), interleukin-10 (IL-10), and B-lymphocyte stimulator (BLyS/BAFF) orchestrate these fate decisions through specific receptor signaling pathways, primarily the JAK–STAT axis, which crosstalks with canonical BCR signaling networks such as NF-κB and PI3K–AKT. Cytokines regulating B-cell proliferation, differentiation, and other functional responses are summarized in the table below[8,9].
Table 4. Key cytokines regulating B cell proliferation, B cell differentiation and effector functions
|
Cytokine |
Primary Source |
Main B Cell Target Stage |
Key Outcome |
|
IL-21 |
Tfh |
GC B cells |
Plasma cell diff., SHM, proliferation |
|
IL-4 |
Tfh2, Th2, Basophils |
Activated B cells |
Proliferation, CSR |
|
IFN-γ |
Th1, CD8⁺ T, NK |
Activated B cells |
CSR, enhanced presentation |
|
IL-10 |
Tfh, Tfr, Breg |
GC B cells, Plasma cells |
Plasma cell diff., anti-inflammation |
|
IL-6 |
Tfh, Stroma, Macro |
Activated B cells |
Plasmablast differentiation |
|
BAFF |
Myeloid, Stroma |
Transitional → Naive; MZ B cells |
Survival, TI response, PC survival |
|
APRIL |
Myeloid, Stroma |
Mucosal B cells, Plasma cells |
IgA CSR, PC survival |
|
TGF-β |
Treg, Stroma |
Mucosal B cells |
IgA CSR, inhibition |
The crosstalk between cytokine cues and BCR signaling is orchestrated by sophisticated downstream signaling cascades. BCR ligation, mediated by the Igα (CD79a)/Igβ (CD79b) heterodimer, initiates core signaling cascades involving Syk, BTK, and PLCγ2, which subsequently activate the NF-κB, MAPK, and PI3K-AKT pathways. Cytokine receptor signaling dynamically converges on these BCR-associated cascades. For example, IL-4 and IL-21 trigger JAK-STAT activation, which synergizes with the PI3K-AKT axis to drive B cell growth and metabolic reprogramming. Dysregulation of such integrated signaling networks, including constitutive activation of NF-κB or BTK, represents a hallmark feature of B cell malignancies and autoimmune disorders, rendering these pathways promising targets for small-molecule inhibitor therapy[10].
Recent advances in immunometabolism have further clarified the mechanistic links between cytokine signaling and B cell bioenergetics. Co-stimulation via cytokine receptors and the BCR induces mitochondrial remodeling and enhanced glycolytic flux, which fulfill the elevated biosynthetic and energetic demands of B cell proliferation and antibody production. Mitochondrial dysfunction, such as that induced by Tfam deficiency, impairs germinal center formation and promotes aged immune phenotypes, confirming an intrinsic regulatory axis connecting cytokine signaling, metabolic fitness, and B cell functional competence. Furthermore, spatiotemporal profiling of co-receptor signaling networks demonstrates that the dynamic assembly of membrane-localized signaling complexes is essential for robust and efficient signal transduction during B cell activation[11].
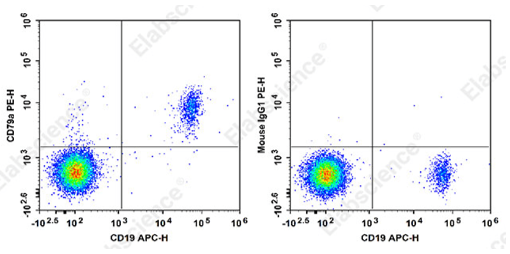
Fig. 5 Detection and CD79a expression in B cells of human peripheral blood cells. Intracellular staining of normal human peripheral blood cells with APC Anti-Human CD19 Antibody (E-AB-F1304E) and PE Anti-Human CD79a Antibody[HM47](E-AB-F1370D) (left) or PE Mouse IgG1, κ Isotype Control (right). Cells in the lymphocytes gate were used for analysis. (The data are provided by Elabscience.)
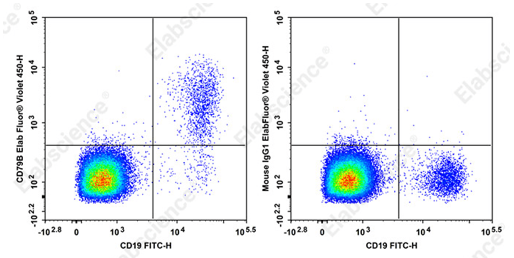
Fig. 6 Detection and CD79B expression in B cells of human peripheral blood cells. Staining of normal human peripheral blood cells with FITC Anti-Human CD19 Antibody (E-AB-F1304C) and Elab Fluor® Violet 450 Anti-Human CD79B Antibody [CB3-1](AN00481Q) (left) or Elab Fluor® Violet 450 Mouse lgG1, κ Isotype Control (right). Cells in the lymphocytes gate were used for analysis. (The data are provided by Elabscience.)
Elabscience® Quick Overview of Popular Products:
Table 5. Reagents for research on cytokines secretion of T/B cell
|
Product Name |
Cat. No. |
|
PE Anti-Human IL-21 Antibody[3A3-N2] |
E-AB-F1202D |
|
APC Anti-Mouse IL-4 Antibody[11B11] |
E-AB-F1204E |
|
APC Anti-Human IL-4 Antibody[MP4-25D2] |
E-AB-F1203E |
|
PE Anti-Mouse IL-6 Antibody[MP5-20F3] |
E-AB-F1207D |
|
PE Anti-Mouse IL-10 Antibody[JES5-16E3] |
E-AB-F1197D |
|
PE Anti-Mouse IFN-γ Antibody[XMG1.2] |
E-AB-F1101D |
|
APC Anti-Human CD19 Antibody[HI19a] |
E-AB-F1304E |
|
APC Anti-Human/Monkey CD19 Antibody[CB19] |
E-AB-F1004E |
|
PE Anti-Human CD79a Antibody[HM47] |
E-AB-F1370D |
|
Elab Fluor® Violet 450 Anti-Human CD79B Antibody[CB3-1] |
AN00481Q |
|
Cell Stimulation and Protein Transport Inhibitor Kit |
E-CK-A091 |
|
Human Th1/Th2 Flow Cytometry Staining Kit |
XJH001 |
|
Mouse Th1/Th2 Flow Cytometry Staining Kit |
XJM001 |
|
Human IL-4 (Interleukin 4) ELISPOT Kit |
ESP-H0007 |
|
CellaQuant™ Human IL-4 (Interleukin 4) ELISA Kit |
CQH018 |
|
Mouse IL-21(Interleukin 21) ELISA Kit |
E-EL-M1273 |
04 Surface markers of activated B cell immunophenotyping
Accurate immunophenotyping of activated B cells relies on precise recognition of dynamic surface marker profiles. B cell activation triggers rapid, often transient alterations in surface protein expression, which phenotypically distinguish activated B cells from naive and resting memory B cell populations. Activation induces the upregulation of co‑stimulatory molecules, adhesion proteins, and differentiation-associated markers, which support B cell–T cell crosstalk, germinal center migration, and terminal differentiation into plasma cells or memory B cells. Key phenotypic markers include CD69, CD80, CD86, CD40, CD95 (Fas), and CD21, along with the dynamically regulated canonical markers CD27, IgD, and CD38. Combinatorial profiling of these markers enables the discrimination of discrete B cell activation states, including early activation, germinal center involvement, and extrafollicular responses. Such high-resolution phenotyping is critical for evaluating B cell-driven autoimmune pathologies such as systemic lupus erythematosus (SLE) and monitoring the progression of B cell malignancies[12,13].
4.1 Early B Cell Activation Markers and Co-Stimulatory Molecules
Following antigen recognition and B cell receptor (BCR) engagement, naive B cells rapidly upregulate a panel of early activation markers. CD69 serves as one of the most sensitive early activation indicators, with expression detectable within hours of stimulation, though this upregulation is transient. In contrast, the co-stimulatory molecules CD80 (B7-1) and CD86 (B7-2) exhibit sustained expression after activation. By binding to T cell-expressed CD28 and CTLA-4, these molecules provide essential secondary signals that initiate and sustain T cell-dependent B cell responses. As a member of the tumor necrosis factor receptor superfamily, CD40 is also persistently upregulated on activated B cells, enabling stable interactions with CD40L expressed by T follicular helper (Tfh) cells. The CD40–CD40L signaling axis is essential for germinal center formation, immunoglobulin class-switch recombination, and the production of high-affinity antibodies. In autoimmune settings such as SLE, enhanced CD80 and CD40 expression reflects aberrant B cell hyperactivity and correlates with disease severity. Accordingly, these markers can serve as reliable phenotypic readouts for evaluating therapeutic responses to B cell-targeted agents, including the BLyS inhibitor belimumab[14].
The core lineage and early B cell activation markers of human B cells are summarized in the table below.
Table 6. Core lineage markers of B cells
|
Marker |
Human |
Mouse |
Notes |
|
CD19 |
+ (bright) |
+ (bright) |
Most reliable pan-B cell marker; retained until late plasma cell stage |
|
CD20 (MS4A1) |
+ |
+ |
Lost upon plasma cell differentiation; excellent for excluding plasma cells |
|
CD22 |
+ |
+ |
B-lineage restricted; siglec family |
|
B220 (CD45R) |
– (not expressed) |
+ |
Classic mouse B cell marker; isoforms differ from human |
|
CD79b |
+ |
+ |
Part of BCR complex; useful when CD19 is dim |
Table 7. Early activation markers of B cells
|
Marker |
Kinetics |
Function / Interpretation |
|
CD69 |
Hours 4–24 (earliest) |
Induces S1PR1 down-regulation, retains B cells in lymphoid tissue; transient expression. |
|
CD86 (B7-2) |
Peaks 24–48 h |
Binds CD28 on T cells; rapidly induced by BCR + CD40L. More dynamic than CD80. |
|
CD80 (B7-1) |
Days 2–4 |
Sustained expression; also binds CTLA-4 (inhibitory). |
|
HLA-DR (MHC-II) |
Upregulated within 24 h |
Antigen presentation to Tfh; high levels indicates actively presenting B cells. |
|
CD83 |
Late activation |
Maturation marker; also marks mature DCs. |
|
CD40 |
Constitutive, but clustering triggers signaling |
Engagement with CD40L, CD40–CD40L ligation represents a key determinant of TD B cell activation. |
4.2 Germinal Center and B Cell Differentiation Markers
As activated B cells initiate the germinal center reaction, they develop a unique phenotypic signature. Germinal center B cells generally exhibit high expression of CD95 (Fas) and CD10, accompanied by reduced surface IgD and expression of either IgM or class-switched immunoglobulin isotypes. CD95 is prominently expressed on germinal center B cells and activated memory B cells, marking cells subjected to antigen-mediated clonal selection. The differentiation of germinal center B cells into plasma cells is characterized by the down-regulation of canonical B cell markers CD19 and CD20, alongside the up-regulation of plasma cell-associated markers CD38 and CD138 (syndecan-1)[1,8].
Nevertheless, B cells display a CD27+ phenotype during intermediate activation and differentiation stages, a feature conventionally regarded as a hallmark of memory B cells. Emerging data indicate that CD27 expression is dynamically regulated. Cytokines including IL-21 can suppress CD27 expression within specific activated B cell subsets, limiting the reliability of CD27 alone for identifying memory B cells. Accordingly, combinatorial detection of CD27 together with additional markers such as IgD and CD38 is required to faithfully discriminate memory B cells from activated naive B cells[15].
Phenotypic profiling further highlights the complementary value of spatial biology and flow cytometry. The phenotype of activated B cells varies substantially according to their anatomical localization. These location-dependent phenotypic features are summarized in the table below.
Table 8. Comparison of extrafollicular (EF) activated B cells and plasmablasts markers in human and mouse
|
Marker |
Human |
Mouse |
Notes |
|
CD27 |
Bright ++ |
N/A (murine CD27 is not a reliable PB marker) |
Hallmark of human plasmablasts |
|
CD38 |
Bright ++ |
Variable |
Combined with CD27 defines plasmablasts |
|
CD138 (Syndecan-1) |
+ (late) |
+ (late) |
Mucosal homing; plasma cell adhesion |
|
CD20 |
Dim/− |
Dim/− |
Being lost during terminal differentiation |
|
CD19 |
Maintained |
Maintained |
Distinguishes from mature plasma cells |
|
Blimp-1 |
Intracellular |
Intracellular |
Transcriptional confirmation of plasma cell fate |
Note: These populations reside in lymph node medullary cords and splenic bridging channels.
Table 9. Comparison of germinal center (GC) B cells markers in human and mouse
|
Marker |
Human |
Mouse |
Notes |
|
CXCR5 |
+ (LZ enriched) |
+ (LZ enriched) |
Follicular homing; binds CXCL13 |
|
PD-1 (CD279) |
+ (LZ subset) |
+ (LZ subset) |
Interacts with PD-L1 on follicular dendritic cells or T follicular helper cells; marks selected GC B cells. |
|
CD95 (Fas) |
+ |
+ |
Apoptosis regulator; marks GC entry. |
|
GL7 |
Reactive (non-standard) |
+++ |
Murine GC-specific; human cross-reactivity is variable. |
|
Peanut Agglutinin (PNA) |
– |
+ |
Binds GC B cell glycocalyx; classical murine GC stain. |
|
CXCR4 |
+ (DZ enriched) |
+ (DZ enriched) |
Dark zone positioning via CXCL12. |
|
CD10 |
+ |
Rarely used |
Human precursor/GC B cell marker. |
|
Bcl-6 |
Intracellular only |
Intracellular only |
Master GC transcription factor. |
Note: Germinal center B cells reside within B-cell follicles, comprising dark zone (DZ) and light zone (LZ) subsets.
Table 10. Comparison of memory B cells markers in human and mouse
|
Marker |
Human |
Mouse |
|
CD27 |
+ (classical memory) |
Not reliable in mice |
|
IgD |
−/dim |
−/dim |
|
CD20 |
+ |
+ |
|
CD19 |
Bright |
Bright |
|
CXCR3 / CXCR5 |
Heterogeneous (tissue-homing profile) |
Various subsets |
Note: Atypical/age-associated B cells (ABCs, also called DN2 or “double-negative”) express CD11c+CD21-CD27-T-bet+ and expand in autoimmunity or chronic viral infection.
4.3 Regulatory and Pathological Subsets
Specific activated B cell subsets exert regulatory functions or drive pathological processes. Regulatory B cells (Bregs) suppress immune responses mainly through IL-10 secretion and are commonly defined as CD24hiCD38hi in humans. Although CD9 has been suggested as a marker for murine IL-10-competent Bregs, its reliability and practicability for human immunophenotyping remain debated. Accordingly, identification of human Bregs requires functional validation via intracellular cytokine staining instead of depending solely on surface phenotypic markers[16].
In autoimmune disorders, aberrant B cell activation promotes the expansion of unique subsets including CD21low B cells, a population linked to chronic antigen exposure and autoimmunity. Furthermore, double-negative B cells (IgD−CD27−) accumulate in diseases such as pediatric-onset autoimmune hepatitis. These cells constitute a distinct pool of activated or exhausted B cells that potentially participate in disease pathogenesis. Collectively, these subsets underscore the necessity of high-dimensional immunophenotyping to resolve the heterogeneity of activated B cells within clinical specimens[17].
4.4 High-Dimensional B Cell Immunophenotyping Strategies
The complexity of B cell activation demands high-parameter flow cytometry panels to resolve overlapping cellular phenotypes. Contemporary panels support 25–50-color detection, enabling simultaneous measurement of lineage markers, activation signatures, and memory B cell subsets. For instance, the inclusion of markers such as CD21, CD27, IgD, IgM, CD38, and CD95 enables the distinction between naive (IgD+CD27-), resting memory (IgD-CD27+), and activated memory (IgD-CD27+CD95+) B cells. Furthermore, inclusion of markers including CD11c and FCRL4 facilitates identification of tissue-like memory B cells, a subset frequently expanded during chronic infection and autoimmune disorders. Spectral flow cytometry improves the resolution of these populations by reducing fluorescence spillover, which allows integration of extra markers to characterize subtle activation phenotypes. This multifaceted strategy is critical for delineating spatiotemporal dynamics of B cell responses and discovering therapeutic targets for immune-mediated diseases[18,19].
Key phenotypic differences between human and mouse B cells are summarized in the table below.
Table 11. Key phenotypic differences between human and mouse B cells
|
Feature |
Human |
Mouse |
|
Memory marker |
CD27 is gold standard |
CD27 unreliable; use PDL2, CD73, CD80 or IgD⁻ |
|
GC marker |
CXCR5, PD-1, CD95 |
GL7, PNA, Fas |
|
Plasmablast marker |
CD27⁺⁺ CD38⁺⁺ |
CD138⁺ B220⁺ |
|
Marginal zone |
CD27⁺ IgD⁺ (spleen) |
Not well-defined; use CD21ʰⁱ CD23ˡᵒ |
|
Age-associated B cells |
CD11c⁺ CD21⁻ CD27⁻ |
T-bet⁺ (can be CD11c⁺) |
In summary, immunophenotyping of activated B cells depends on combinatorial marker profiling to reflect cellular functional status. Core markers include CD69, CD80, CD86, CD40, CD95 and CD21, together with dynamically regulated CD27 and IgD. Precise discrimination of distinct B cell subsets requires high-dimensional flow cytometry to resolve the heterogeneity embedded within B cell responses, especially under pathological conditions such as autoimmunity and infection. Characterization of these phenotypic signatures advances our understanding of B cell biology and supports the development of targeted therapeutics for B cell-mediated diseases.
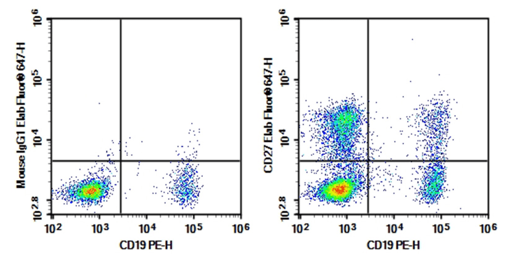
Fig. 7 Detection of memory B cells in human peripheral blood lymphocytes. Human peripheral blood lymphocytes were stained with 0.2 μg Purified Anti-Human CD27 Antibody[O323] (Right) and 0.2 μg Mouse IgG1, κ Isotype Control (Left), followed by Elab Fluor® 647-conjugated Goat Anti-Mouse IgG Secondary Antibody, then anti-Human CD19 PE-conjugated Monoclonal Antibody. The memory B cells exhibit the phenotype of CD19+CD27+IgD+. (The data are provided by Elabscience.)
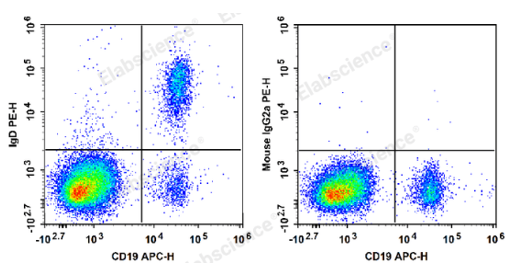
Fig. 8 Detection of memory B cells in human peripheral blood lymphocytes. Human peripheral blood lymphocytes are stained with APC Anti-Human CD19 Antibody and PE Anti-Human IgD Antibody (Left). Lymphocytes are stained with APC Anti-Human CD19 Antibody and PE Mouse IgG2a, κ Isotype Control (Right). The memory B cells exhibit the phenotype of CD19+CD27+IgD+. (The data are provided by Elabscience.)
Elabscience® Quick Overview of Popular Products:
Table 12. Reagents for memory B cell research
|
Product Name |
Cat. No. |
|
Purified Anti-Human CD27 Antibody[O323] |
E-AB-F11400P |
|
Elab Fluor® 647 Anti-Human/Monkey CD27 Antibody[O323] |
E-AB-F1140M |
|
PE Anti-Human/Monkey CD19 Antibody[CB19] |
E-AB-F1004D |
|
APC Anti-Human CD19 Antibody[HI19a] |
E-AB-F1304E |
|
FITC Anti-Human IgD Antibody[IA6-2] |
E-AB-F1171C |
|
PE Anti-Human IgD Antibody[IA6-2] |
E-AB-F1171D |
|
APC Anti-Mouse CD27 Antibody[LG.3A10] |
AN00322E |
|
Elab Fluor® Violet 450 Anti-Mouse IgD Antibody[11-26c.2a] |
E-AB-F1189Q |
|
APC Anti-Mouse IgD Antibody[11-26c.2a] |
E-AB-F1189E |
|
PE Anti-Mouse CD19 Antibody[1D3] |
E-AB-F0986D |
|
APC Anti-Mouse CD24 Antibody[M1/69] |
E-AB-F1179E |
|
PE/Cyanine7 Anti-Human CD38 Antibody[HIT2] |
E-AB-F1058H |
|
Elab Fluor® 700 Anti-Human/Monkey CD95/Fas Antibody[DX2] |
E-AB-F1168M1 |
|
Cell Staining Buffer |
E-CK-A107 |
|
Cell Stimulation and Protein Transport Inhibitor Kit |
E-CK-A091 |
|
Intracellular Fixation/Permeabilization Buffer Kit |
E-CK-A109 |
05 Experimental methods for measuring B cell activation
Experimental approaches for assessing B cell activation (B cell activation assay) comprise a broad spectrum of techniques tailored to characterize the dynamic and multi-layered features of B cell responses, ranging from acute intracellular signal transduction events to long-term phenotypic differentiation. Accurate quantification of B cell activation (B cell activation assay) is fundamentally important for elucidating the immune mechanisms involved in vaccination, pathogen infection, autoimmune disorders, and hematological malignancies. To dissect the intricate processes governing B cell activation, modern immunological studies predominantly adopt multiple technical strategies, including high-dimensional flow cytometry, phospho-flow cytometry, calcium flux assays, as well as functional assays such as ELISPOT (IL-4 elispot) and cell proliferation assays. These versatile methodological platforms enable the quantitative detection of surface marker expression, intracellular signaling protein phosphorylation, cellular metabolic reprogramming, and antibody secretion, thereby providing a holistic and systematic insight into the functional biology of B cells[1,2,7].
Among these technical tools, high-dimensional flow cytometry serves as the core technique for immunophenotypic profiling of activated B cells, allowing the simultaneous detection of multiple surface markers to delineate distinct activation statuses and cellular subsets. Traditional antibody panels have been progressively optimized into highly multiplexed detection systems, and recent advances in spectral flow cytometry have supported the development of 25-color and even 50-color panels. Benefiting from such high-resolution systems, researchers can precisely discriminate global immune compartments and lineage-specific B cell activation with unprecedented accuracy. Furthermore, spectral flow cytometry minimizes spectral overlap to substantially improve the resolution of rare and subtle B cell subsets, which allows the integration of additional marker panels for characterizing refined activation phenotypes and complex co-receptor signaling networks. A validated 11-color flow cytometry panel for comprehensive human B cell profiling is summarized in the table below[7,19].
Table 13. Example 11-Color Human Panel for Comprehensive B Cell Activation Profiling
|
Fluorochrome |
Marker |
Purpose |
Cat. No. |
|
Elab Fluor® Violet 500 |
CD19 |
Lineage gate |
E-AB-F1004R |
|
PE-Cy7 |
CD20 |
Lineage + plasma cell exclusion |
AN00776H |
|
Elab Fluor® 647 |
CD3 |
Lineage exclusion markers (T cells) |
E-AB-F1001M |
|
Elab Fluor® 647 |
CD14 |
Lineage exclusion markers (monocytes) |
AN00420M |
|
Elab Fluor® 647 |
CD16 |
Lineage exclusion markers (NK) |
E-AB-F1236M |
|
Elab Fluor® Violet 610 |
CD69 |
Early activation |
E-AB-F1138T |
|
PE |
CD86 |
Co-stimulation |
E-AB-F1012D |
|
PerCP-Cy5.5 |
CD27 |
Memory / plasmablast |
E-AB-F1140J |
|
APC |
CD38 |
Plasmablast / activation |
E-AB-F1058E |
|
FITC |
CXCR5 |
Follicular / GC positioning |
E-AB-F1287C |
|
Elab Fluor® 700 |
PD-1 |
GC light zone / Tfh interaction |
E-AB-F1229M1 |
|
Elab Fluor® Violet 450 |
HLA-DR |
Activation / presentation status |
E-AB-F1111Q |
|
STYX™ Yellow ( AmCyan) |
Live/Dead dye |
Viablity |
E-CK-A169 |
Beyond surface phenotyping, detection of intracellular signaling proteins and transcription factors directly reflects the functional status of B cell activation pathways. Following cell purification using a B cell isolation kit, phospho-flow cytometry enables simultaneous quantification of phosphorylated signaling molecules (NF-κB p65, SYK, AKT, and MAPK) alongside surface markers, providing a robust tool to dissect signaling mechanisms regulating B cell survival, proliferation, and differentiation. This technique captures immediate downstream events induced by B cell receptor (BCR) ligation and cytokine stimulation. Specifically, NF-κB signaling is critical for B cell fate decisions, and phospho-flow profiling reveals heterogeneous signaling activities among differentiating B cell subsets. However, reliable detection requires rigorous optimization of fixation and permeabilization protocols to preserve intracellular protein integrity and surface antibody binding capacity. Combined with high-dimensional surface phenotyping, phospho-flow cytometry further maps spatiotemporal signaling networks and clarifies how co-receptors (CD19 and CD21) modulate BCR signaling thresholds[5,7].
Beyond static intracellular signaling profiling, calcium flux assays are a foundational approach for evaluating acute BCR signaling responsiveness. Upon antigen binding, the BCR complex, signal-transduced by Igα (CD79a) and Igβ (CD79b), triggers rapid intracellular calcium influx, which acts as a core second messenger initiating downstream activation cascades. Fluorescent indicator-based calcium flux measurement generates kinetic data on the magnitude and duration of BCR signaling, complementing static protein phosphorylation analyses. This assay is particularly suitable for evaluating the efficacy of BCR-targeted therapeutic inhibitors, including Bruton’s tyrosine kinase (BTK) inhibitors widely applied in B cell malignancy treatment. Comparing calcium flux profiles before and after treatment enables quantitative assessment of functional BCR signaling suppression by targeted interventions[4].
While the above assays characterize upstream signaling dynamics of B cell activation, purified B cells prepared with a B cell isolation kit can be subjected to functional assays, including ELISPOT (such as IL-4 elispot) and proliferation assays, quantify the terminal outcomes of B cell activation: antibody secretion and clonal expansion. ELISPOT achieves single-cell resolution detection of antibody-secreting cells, characterizing the magnitude and antigen specificity of humoral immune responses. B cell proliferation, driven by cytokines such as IL-4 and IL-21, is routinely measured via carboxyfluorescein succinimidyl ester (CFSE) dilution or Ki-67 staining. These functional readouts validate the physiological relevance of phenotypic and signaling profiles, confirming that molecular alterations correspond to actual immune functional changes. Notably, immunometabolic analyses of glycolytic flux and mitochondrial activity have become integral to B cell activation research, as metabolic reprogramming sustains the increased biosynthetic and energetic demands of B cell proliferation and antibody production[7,8].
Taken together, these distinct but complementary methodological approaches constitute a complete analytical system for B cell activation research. In summary, comprehensive profiling of B cell activation requires a multimodal framework integrating high-dimensional immunophenotyping, intracellular signaling analysis, kinetic functional assays, and metabolic profiling. High-parameter flow cytometry resolves heterogeneous B cell subsets and activation states, while phospho-flow and calcium flux assays capture dynamic BCR signaling activities. Complementary functional assays verify the biological outputs of B cell activation, linking molecular signaling changes to immune function. Collectively, this integrated toolkit enables systematic dissection of B cell activation mechanisms under physiological and pathological conditions, supporting the development of targeted therapies for autoimmune diseases and B cell malignancies[6,14].
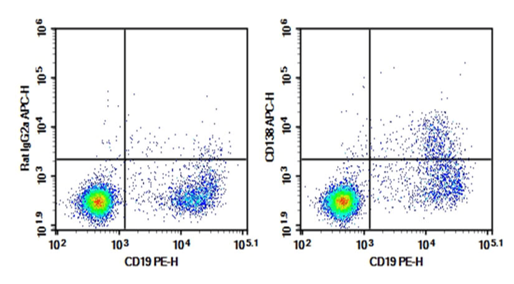
Fig. 9 Detection of plasma cells in C57BL/6 mouse bone marrow. Bone marrow lymphocytes were stained with 0.2 μg Purified Anti-Mouse CD138 Antibody[281-2] (Right) and 0.2 μg Rat IgG2a, κ Isotype Control (Left), followed by APC-conjugated Goat Anti-Rat IgG Secondary Antibody, then anti-Mouse CD19 PE-conjugated Monoclonal Antibody. (The data are provided by Elabscience.)
Elabscience® Quick Overview of Popular Products:
Table 14. Reagents for plasma cell research
|
Product Name |
Cat. No. |
|
Purified Anti-Mouse CD138 Antibody[281-2] |
E-AB-F1394A |
|
FITC Anti-Human CD138/Syndecan-1 Antibody[B-B4] |
E-AB-F1411C |
|
APC Anti-Human CD138/Syndecan-1 Antibody[DL-101] |
E-AB-F1154E |
|
PE/Cyanine7 Anti-Human CD19 Antibody[HI19a] |
E-AB-F1304H |
|
PerCP/Cyanine5.5 Anti-Human/Monkey CD27 Antibody[O323] |
E-AB-F1140J |
|
Purified Anti-Human CD27 Antibody[O323] |
E-AB-F11400P |
|
PE/Elab Fluor® 594 Anti-Human/Monkey CD19 Antibody[CB19] |
E-AB-F1004P |
|
PE Anti-Mouse CD19 Antibody[1D3] |
E-AB-F0986D |
|
APC Anti-Mouse CD38 Antibody[NIMR5] |
E-AB-F1193E |
|
PE Anti-Mouse CD27 Antibody[LG.3A10] |
AN00322D |
|
Cell Staining Buffer |
E-CK-A107 |
|
Cell Stimulation and Protein Transport Inhibitor Kit |
E-CK-A091 |
|
Intracellular Fixation/Permeabilization Buffer Kit |
E-CK-A109 |
References:
[1] Cerutti A , Puga I , Cols M .New helping friends for B cells[J].European Journal of Immunology, 2012, 42(8):1956-1968.
[2] Chorny A , Puga I , Cerutti A .Regulation of frontline antibody responses by innate immune signals[J].Immunologic Research, 2012, 54(1-3):4-13.
[3] Eisenbarth S C , Ashby K M , Ojo O A ,et al.Extrafollicular and other non-germinal center B cell responses[J].The Journal of Immunology, 2026(2):215.
[4] TKACHENKO A, KUPCOVA K, HAVRANEK O. B-Cell Receptor Signaling and Beyond: The Role of Igα (CD79a)/Igβ (CD79b) in Normal and Malignant B Cells[J]. International Journal of Molecular Sciences, 2023, 25(1): 10.
[5] GULDENPFENNIG C, TEIXEIRO E, DANIELS M. NF-kB’s contribution to B cell fate decisions[J]. Frontiers in Immunology, 2023, 14. http://dx.doi.org/10.3389/fimmu.2023.1214095.
[6] CORNETH O B J, NEYS S F H, HENDRIKS R W. Aberrant B Cell Signaling in Autoimmune Diseases[J]. Cells, 2022, 11(21): 3391.
[7] MARSMAN C, JORRITSMA T, TEN BRINKE A, et al. Flow Cytometric Methods for the Detection of Intracellular Signaling Proteins and Transcription Factors Reveal Heterogeneity in Differentiating Human B Cell Subsets[J]. Cells, 2020, 9(12): 2633.
[8] IWATA S, HAJIME SUMIKAWA M, TANAKA Y. B cell activation via immunometabolism in systemic lupus erythematosus[J]. Frontiers in Immunology, 2023, 14.
[9] ZURBUCHEN Y, MICHLER J, TAESCHLER P, et al. Human memory B cells show plasticity and adopt multiple fates upon recall response to SARS-CoV-2[J]. Nature Immunology, 2023, 24(6): 955-965.
[10] WANG J, JU B, ZHU L, et al. The rapid inhibition of B-cell activation markers by belimumab was associated with disease control in systemic lupus erythematosus patients[J]. Frontiers in Pharmacology, 2023, 14. http://dx.doi.org/10.3389/fphar.2023.1080730.
[11] IBORRA-PERNICHI M, RUIZ GARCÍA J, VELASCO DE LA ESPERANZA M, et al. Defective mitochondria remodelling in B cells leads to an aged immune response[J]. Nature Communications, 2024, 15(1). http://dx.doi.org/10.1038/s41467-024-46763-1.
[12] Geisler C H , Larsen J K , Hansen N E ,et al.Prognostic importance of flow cytometric immunophenotyping of 540 consecutive patients with B-cell chronic lymphocytic leukemia.[J].Blood, 1991, 78(7):1795-1802.
[13] Camilleri-Brot S ,Emmanuelle Crinière, Brot P ,et al.Auniform activated B-cell-like immunophenotype might explain the poor prognosis of primary central nervous system lymphomas: Analysis of 83 cases[J].Blood, 2006, 107(1):190-196.
[14] [1]SUN W, ZHU C, LI Y, et al. B cell activation and autoantibody production in autoimmune diseases[J]. Best Practice & Research Clinical Rheumatology, 2024, 38(2): 101936.
[15] KANG S, WU Q, SHEN J, et al. CD27 is not an ideal marker for human memory B cells and can be modulated by IL-21 upon stimulated by Anti-CD40[J]. Scientific Reports, 2024, 14(1).
[16] MOHD JAYA F N, GARCIA S G, BORRAS F E, et al. In Vitro Characterization of Human CD24hiCD38hi Regulatory B Cells Shows CD9 Is Not a Stable Breg Cell Marker[J]. International Journal of Molecular Sciences, 2021, 22(9): 4583.
[17] KOLACHALA V L, WEI C, VENKATESWARAN S, et al. Increased IgD and CD27 Double Negative (DN) B cell population in pediatric onset autoimmune hepatitis[J]. Autoimmunity, 2024, 57(1).
[18] HEUBECK A, SAVAGE A, HENDERSON K, et al. Cross‐platform immunophenotyping of human peripheral blood mononuclear cells with four high‐dimensional flow cytometry panels[J]. Cytometry Part A, 2023, 103(6): 500-517.
[19] [1]KONECNY A J, MAGE P L, TYZNIK A J, et al. OMIP‐102: 50‐color phenotyping of the human immune system with in‐depth assessment of T cells and dendritic cells[J]. Cytometry Part A, 2024, 105(6): 430-436.

