

Cancer immunotherapy has revolutionized the landscape of cancer treatment. Deciphering the interplay between tumor immunology and metabolic reprogramming has become a critical priority for identifying novel targets and sensitizing immunotherapeutic responses. In this article, we review the underlying theoretical mechanisms, present empirical metabolic data from T cells and macrophages, and introduce practical, implementable assay protocols for metabolic detection.
Table of Contents
1. The Impact of Metabolic Reprogramming on the Tumor Immune Landscape
2. Examples of Metabolic Assays for T Cells and Macrophages
3. Frontiers in Research: Immunotherapeutic Approaches Targeting Metabolic Reprogramming
4. Research Toolbox: A Three-Tiered Protocol for Metabo-Immunological Profiling
01 The Impact of Metabolic Reprogramming on the Tumor Immune Landscape
Tumor cells, driven by oncogene activation and tumor suppressor gene inactivation, exhibit aberrantly enhanced flux through three major metabolic pathways (aerobic glycolysis, glutaminolysis, and lipid metabolic remodeling) which synergistically sustain proliferative demands and profoundly reshape the metabolic composition of the tumor microenvironment[1]. This remodeling directly disrupts the immuno-metabolic equilibrium within the microenvironment: upon antigen stimulation, effector T cells (CD8⁺ CTLs) must undergo a drastic metabolic switch from resting-state fatty acid oxidation to aerobic glycolysis to support the rapid synthesis of effector molecules such as IFN-γ and perforin; once glycolysis is compromised, their cytotoxic function is abrogated[2]. In contrast, regulatory T cells (Tregs) and M2-type macrophages preferentially utilize fatty acid oxidation and glutamine metabolism, thereby gaining a survival advantage in glucose-depleted environments, whereas M1-type macrophages rely on glycolysis to execute rapid bactericidal functions[3]. These divergent metabolic preferences dictate the functional polarization of distinct immune subsets.
Meanwhile, tumor cells and immune cells constantly compete for nutrients and release inhibitory metabolic signals[4,5]: lactate (10-30 mM) suppresses the proliferation and cytotoxicity of CD8⁺ T cells and NK cells, promotes Treg differentiation and M2 polarization, and drives pro-repair gene expression through histone lactylation[5]; kynurenine promotes Treg differentiation and induces CD8⁺ T cell anergy via the AhR pathway; adenosine activates the A2A receptor to elevate cAMP levels, potently inhibiting T and NK cells; and ROS induces T cell apoptosis or ferroptosis[4]. Thus, metabolic reprogramming has evolved from a mere issue of nutrient availability into a central hub of multidimensional immunosuppression within the tumor microenvironment.
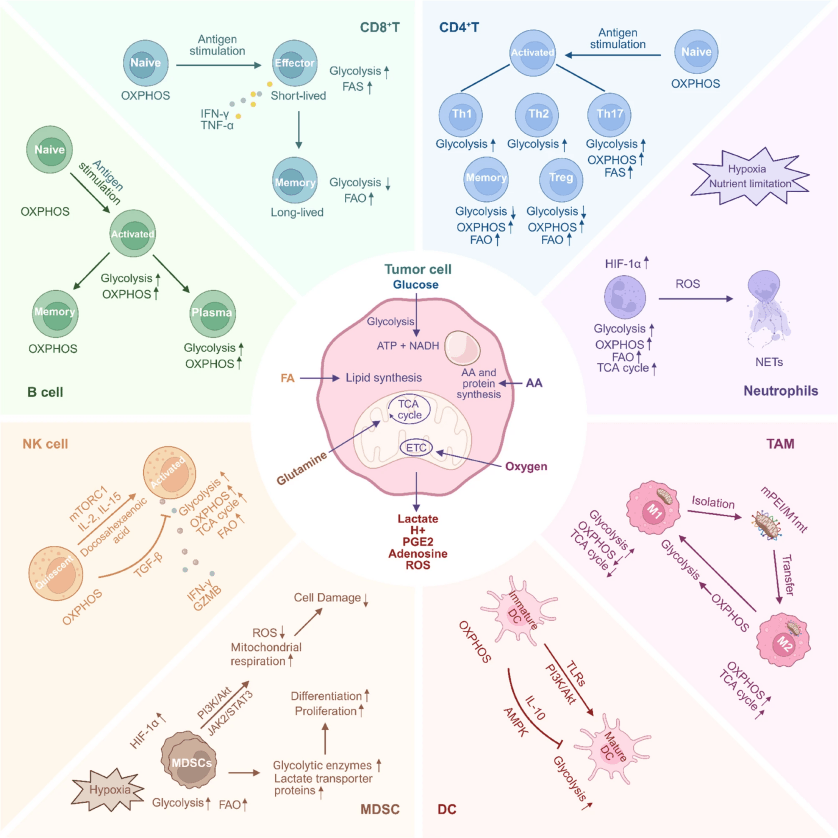
Fig. 1 Metabolic reprogramming within the tumor microenvironment[1].
02 Examples of Metabolic Assays for T Cells and Macrophages
2.1 Metabolic Detection of T Cells Before and After Activation
Human CD3⁺ T cells were negatively selected from peripheral blood mononuclear cells (PBMCs) using an EasySort™ Human CD3+T Cell Isolation Kit (MIH001N). Glucose uptake in naïve (CD45RA⁺) and memory (CD45RO⁺) CD4⁺ T cell subsets was assessed by flow cytometry using the fluorescent glucose analogue 2-NBDG in combination with antibodies against CD3, CD45RA, and CD45RO. The results demonstrated that memory CD4⁺ T cells exhibited significantly higher glucose uptake compared to their naïve counterparts.
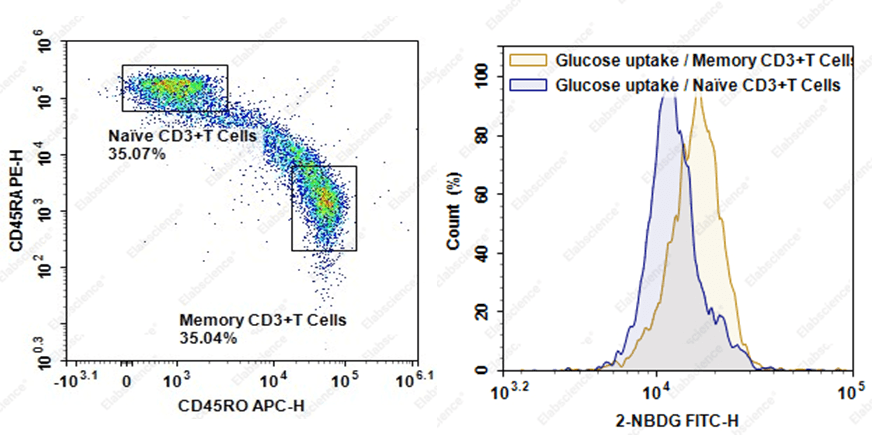
Fig. 2 Glucose uptake detection results.
Human CD3⁺ T cells were negatively selected from peripheral blood mononuclear cells (PBMCs) using an EasySort™ Human CD3+T Cell Isolation Kit (MIH001N). The purified cells were cultured in vitro, with the experimental group stimulated using CD3/CD28 activation beads and the control group left unstimulated. After several days of culture, intracellular ATP levels were quantified. The results demonstrated that ATP production was markedly elevated in the activated T cell group relative to the control group.
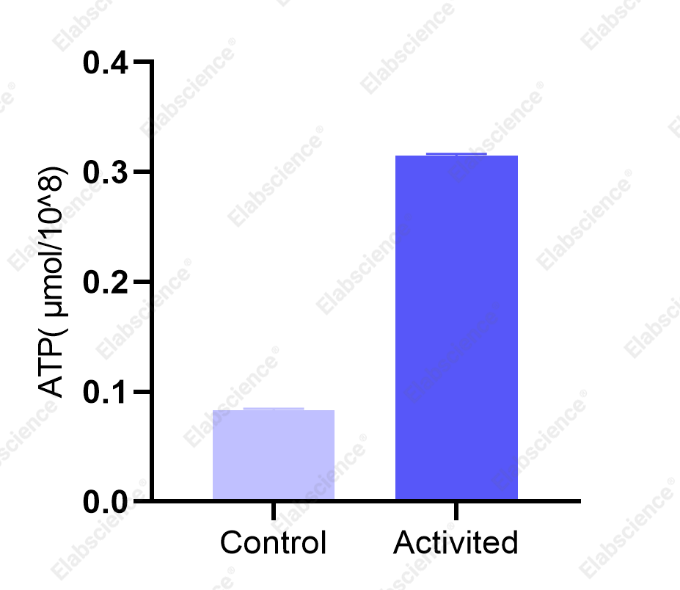
Fig. 3 Assessment of intracellular ATP levels in human CD3⁺ T cells.
Murine CD4⁺ T cells were negatively selected using an EasySort™ Mouse CD4+T Cell Isolation Kit (MIM002N). The isolated cells were then activated with CD3/CD28 stimulation beads and incubated at 37°C for 3 days. Following culture, cellular ATP content, extracellular acidification rate (ECAR), and oxygen consumption rate (OCR) were assessed to further characterize the metabolic reprogramming associated with T cell activation.
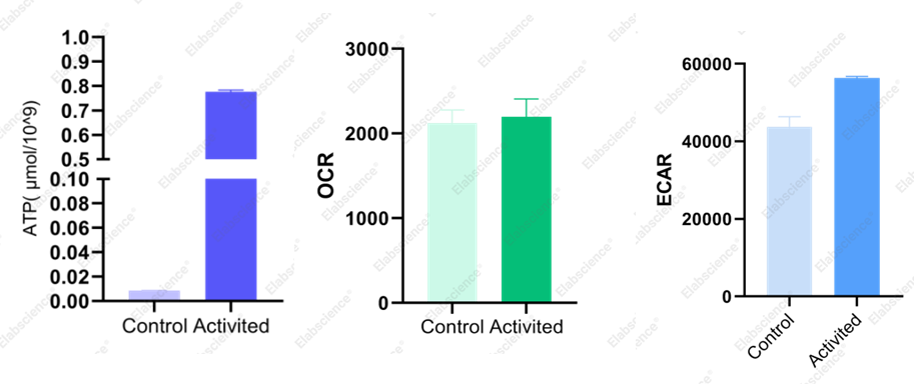
Fig. 4 Assessment of ATP levels, OCR, and ECAR in mouse CD4⁺ T cells.
2.2 Assessment of Metabolic Changes in Macrophages Following Polarization
Bone marrow-derived macrophages (BMDMs) were polarized into M1 and M2 phenotypes in vitro, following which intracellular ATP and succinate levels were measured. The results showed that ATP content increased in both polarized subsets compared to unpolarized controls. Notably, succinate levels were significantly elevated in M1 macrophages but remained unchanged in M2 macrophages. Further assessment of arginase activity revealed a marked increase in M2 macrophages, with no significant change observed in M1 macrophages, which is consistent with the established functional and metabolic signatures of these two macrophage polarization states.
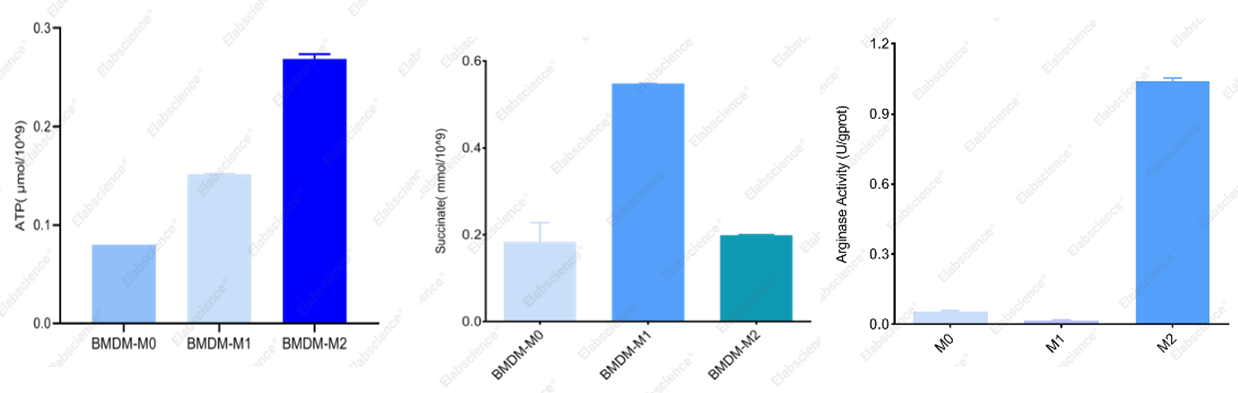
Fig. 5 Measurement of ATP, succinate, and arginase activity in BMDMs before and after polarization.
03 Frontiers in Research: Immunotherapeutic Approaches Targeting Metabolic Reprogramming
Based on the profound interplay between metabolism and immunity, multiple novel strategies are now accelerating clinical translation[2,4]:
● Blocking the lactate axis: Inhibition of LDHA or MCT4 reduces lactate burden, restores T/NK cell function, and sensitizes anti-PD-1 therapy[5].
● Intervening in glutamine metabolism: GLS inhibitors combined with immune checkpoint inhibitors attenuate the Treg/M2 advantage.
● Targeting the adenosine pathway: CD73 antibodies or A2A receptor antagonists have entered Phase II/III clinical trials in solid tumors.
● Metabolic engineering of immune cells: Enhancing mitochondrial metabolism in CAR-T cells or using metabolic modulators ex vivo to delay exhaustion and improve persistence[2].
● Dietary interventions: Ketogenic diets, serine/glycine restriction, and other nutritional approaches may synergize with immunotherapy.
The validation of these strategies relies on precise metabolite quantification, cytokine profiling, and single-cell metabolic phenotyping assays.
04 Research Toolbox: A Three-Tiered Protocol for Metabo-Immunological Profiling
To reliably capture both metabolic and immunological parameters, we have established a three-tiered detection framework utilizing metabolic assay kits, ELISA, and flow cytometry–based reagents:
Table 1. Three-tiered metabo-immunological profiling detection system
|
Level |
Detection Content |
Core Indicator |
Application |
|
Tier 1: Metabolite Quantification |
Colorimetric / Fluorometric Assay Kits |
OCR, ECAR, FAO, Glucose, Lactate, Fatty Acids, Glutamine, ATP, NAD⁺/NADH |
High-Throughput Screening and Phenotypic Confirmation |
|
Tier 2: Single‑Cell Metabolic Phenotyping |
Flow Cytometry Probes + Immuno‑Antibodies |
2-NBDG, BODIPY, JC-1, DCFH-DA, MitoSOX; CD3/CD8, CD86 / CD206, PD-1 |
Pinpointing Metabolic Signatures of Specific Immune Subsets in Complex Samples |
|
Tier 3: Functional Readouts |
ELISA |
IFN-γ, TNF-α, Granzyme B, IL-2, IL-10, TGF-β1, VEGF |
Completing the “Metabolism → Function” Evidence Loop |
The three-tiered framework features reciprocal validation and stepwise escalation, thereby providing a comprehensive platform for investigations into metabolic target identification, elucidation of sensitization mechanisms in immunotherapy, and high-throughput screening of drug candidates.
Products for Tumor and Immune Metabolism Research
Table 2. Elabscience® research products for tumor and immune metabolism assays
|
Cat. No. |
Product Name |
|
E-BC-F201 |
Enhanced ATP Chemiluminescence Assay Kit |
|
E-BC-F069 |
Extracellular Acidification Rate (ECAR) Fluorometric Assay Kit |
|
E-BC-K784-M |
Fatty Acid Oxidation (FAO) Colorimetric Assay Kit |
|
E-BC-K853-M |
Glutamine (Gln) Colorimetric Assay Kit |
|
E-BC-F037 |
Glucose (GLU) Fluorometric Assay Kit |
|
E-BC-K044-M |
L-Lactic Acid (LA) Colorimetric Assay Kit |
|
E-BC-K850-M |
L-Arginine (L-Arg) Colorimetric Assay Kit |
|
E-BC-F070 |
Enhanced Oxygen Consumption Rate (OCR)Fluorometric Assay Kit |
|
E-BC-F091 |
Tryptophan (Trp) Fluorometric Assay Kit |
|
E-BC-K902-M |
Succinic Acid Colorimetric Assay Kit |
|
E-BC-K848-M |
Arginase Activity Colorimetric Assay Kit |
|
MIH001N |
EasySort™ Human CD3+T Cell Isolation Kit |
|
MIM002N |
EasySort™ Mouse CD4+T Cell Isolation Kit |
|
E-CK-A441 |
2-NBDG Glucose Uptake Cell-Based Kit |
|
E-CK-A301 |
Mitochondrial Membrane Potential Assay Kit (with JC-1) |
At the intersection of tumor immunology and metabolic reprogramming, transformative therapeutic opportunities are emerging. From the glycolytic burst accompanying T cell activation, to the lipid metabolic divergence underlying macrophage polarization, and the metabolic "conditioning" of immune cells by the tumor microenvironment each represent metabolic nodes that may serve as a fulcrum for reshaping the immune landscape[6].
We firmly believe that solid data begin with reliable detection tools. Whether your research focuses on how metabolism suppresses antitumor immunity, or explores novel strategies combining metabolic inhibitors with immunotherapy, a well-validated suite of metabolic assay kits, ELISA, and flow cytometry protocols can provide robust support for your scientific discoveries. We look forward to joining you in exploring the uncharted territories of immuno-metabolism.
References:
[1] Immunometabolism: crosstalk with tumor metabolism and implications for cancer immunotherapy. Molecular Cancer, 2025, 24: 249.DOI: 10.1186/s12943-025-02460-1
[2] Metabolic modulation of immune cell function: mechanisms and therapeutic implications in cancer immunotherapy. Oncogenesis, 2026, 15: 33.DOI: 10.1038/s41389-026-00622-4
[3]Linking macrophage metabolism to function in the tumor microenvironment. Nature Cancer, 2025, 6: 239–252.DOI: 10.1038/s43018-025-00909-2
[4] Decoding the metabolic dialogue in the tumor microenvironment: from immune suppression to precision cancer therapies. Experimental Hematology & Oncology, 2025, 14: 99.DOI: 10.1186/s40164-025-00689-6
[5] Beyond a waste product: lactate as a master metabolite dictating anti-tumor T-cell fate. Cell Death & Disease, 2026.DOI: 10.1038/s41419-026-08976-8
[6] Metabolic interplays between the tumour and the host shape the tumour macroenvironment. Nature Reviews Cancer, 2025, 25: 274–292.DOI: 10.1038/s41568-024-00786-4

