Dendritic cells (DCs) are crucial in mediating T cell responses in type 2 diabetes (T2D), a chronic metabolic disorder characterized by insulin resistance and chronic low-grade inflammation. T2D involves complex immune dysregulation, with DCs acting as professional antigen-presenting cells (APCs) that bridge innate and adaptive immunity, thereby influencing the activation and differentiation of T cells. The pathogenesis of T2D is intricately linked to immune cell infiltration and activation within metabolic tissues, particularly adipose tissue, contributing to insulin resistance and beta-cell dysfunction.
This review systematically delineates the phenotypic characteristics of dendritic cells in type 2 diabetes patients, the regulatory effects of metabolic stress (e.g., high glucose and free fatty acids) on their function, the temporal dynamics of dendritic cell-mediated T cell responses during disease progression, their dependent modulation of Th1/Th17 responses in pancreatic islets, and the application of dendritic cell-T cell co-culture assays for investigating antigen presentation.
Table of Contents
1. Phenotypic characterization of dendritic cells in type 2 diabetes patients
2. Effect of metabolic stress (high glucose, FFAs) on DC function
3. Temporal dynamics of DC-mediated T cell responses during diabetes progression
4. DC-mediated modulation of Th1/Th17 responses in pancreatic islets
5. DC-T cell co-culture assays to study antigen presentation
01 Phenotypic characterization of dendritic cells in type 2 diabetes patients
Dendritic cells (DCs) in patients with type 2 diabetes (T2D) display distinct phenotypic features that contribute to chronic low-grade inflammation and immune dysregulation. Specifically, these alterations, including changes in DC frequency, dendritic cells function, activation status, surface molecule expression, and cytokine secretion, collectively drive pathogenic T cell responses and disease progression[1].
A notable phenotypic hallmark of T2D is the dysregulated frequency and functional impairment of various DC subsets. For instance, plasmacytoid DCs (pDCs) in T2D patients contribute to vascular endothelial dysfunction, a prevalent disease complication, thereby indicating a direct link between specific DC phenotypes and T2D-associated comorbidities. Additionally, adipose tissue-resident DCs are critical for T cell homeostasis; their role in obese adipose inflammation further promotes insulin resistance and pancreatic beta-cell dysfunction, which are core T2D pathologies[2].
The metabolic microenvironment of T2D, characterized by persistent hyperglycemia, elevated free fatty acids, and oxidative stress, directly modulates DC phenotype and function[3]. Specifically, these stressors induce pro-inflammatory DC maturation, which is marked by increased MHC-II expression (essential for antigen presentation) and upregulated co-stimulatory molecules (CD80/CD86); these changes, in turn, skew T cell differentiation toward Th1/Th17 cells, suppress regulatory T cells (Tregs), and ultimately exacerbate metabolic dysfunction[4,5].
Furthermore, DCs from T2D patients exhibit an altered cytokine profile: elevated pro-inflammatory cytokines (IL-6, IL-12, IL-23) and reduced anti-inflammatory cytokines (IL-10, TGF-β), which reinforces systemic inflammation. For example, altered corneal DC densities in T2D patients with chronic kidney disease (CKD) and DC-related SGLT2 inhibitor studies highlight DCs as measurable biomarkers. Collectively, targeting these DC phenotypic alterations holds promise for the development of novel T2D therapeutic interventions[6].
In summary, DCs in T2D exhibit a pro-inflammatory phenotype characterized by altered frequencies, enhanced expression of MHC-II and co-stimulatory molecules, and a skewed cytokine production profile. These phenotypic changes drive aberrant T cell responses, contributing significantly to the chronic inflammation and metabolic dysfunction that define T2D. Targeting these specific DC characteristics offers potential avenues for novel therapeutic interventions.
%20from%20C57BL%206%20mice_.png)
Fig. 1 Morphological observation of bone marrow‑derived dendritic cells (BMDCs) from C57BL/6 mice. Bone marrow cells were cultured and induced to generate mature dendritic cells using a BMDC induction and identification kit (XJM003). Immature DCs (left) exhibited sparse dendritic protrusions with minimal cell clustering. In contrast, mature DCs (right) displayed prominent dendritic projections and formed distinct cell aggregates. (The data are provided by Elabscience.)
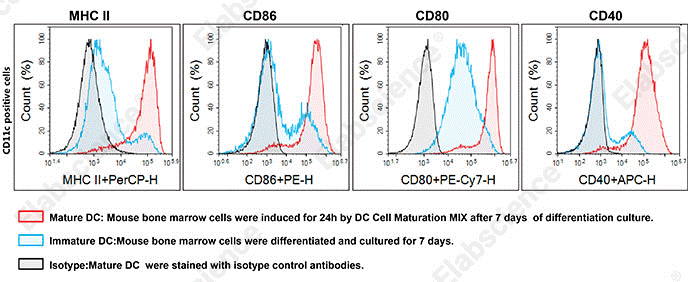
Fig. 2 Phenotypic characterization of BMDCs. Flow cytometric analysis of bone marrow cells from 7‑week‑old male C57BL/6 mice following 7 days of differentiation culture and 1 day of subsequent maturation induction. (The data are provided by Elabscience.)
02 Effect of metabolic stress (high glucose, FFAs) on DC function
Metabolic stress, characterized by conditions such as high glucose, elevated free fatty acids (FFAs), and oxidative stress, significantly impacts dendritic cell (DC) phenotype and function in the context of T2D. These metabolic perturbations drive DCs towards a pro-inflammatory state, exacerbating the chronic low-grade inflammation central to T2D pathogenesis.
2.1 Effects of Hyperglycemia on Dendritic Cell Function
High glucose exerts multiple regulatory effects on dendritic cells (DCs), which can be analyzed by glucose uptake assays (Glucose (GLU) Fluorometric Assay Kit). Specifically, it significantly activates the NF-κB pathway in DCs, thereby promoting their maturation, enhancing antigen presentation, stimulating T lymphocyte proliferation, and inducing the secretion of pro-inflammatory cytokines (e.g., IL-12, IFN‑γ, TNF‑α). Additionally, high glucose markedly elevates reactive oxygen species levels in human monocyte-derived DCs, which further potentiates their maturation and capacity to activate T lymphocytes. Moreover, it alters the metabolism of pulmonary DCs, downregulates antigen presentation-related genes, and impairs their ability to induce T cell immune activation, consequently increasing the susceptibility of diabetic patients to viral respiratory infections. Mechanistically, hyperglycemia enhances the glucose-acetyl-CoA shunt, leading to histone hyperacetylation and chromatin remodeling, which in turn compromises DC function[7].
2.2 Effects of Free Fatty Acids on Dendritic Cell Function
Free fatty acids (FFAs), particularly saturated fatty acids, activate Toll-like receptors (TLR2 and TLR4) to trigger inflammatory signaling, modulate inflammasome activation, and induce the secretion of pro-inflammatory cytokines (e.g., IL-1β), as demonstrated in psoriasis, which can be analyzed by free fatty acids assays (Free Fatty Acids Fluorometric Assay Kit). Specifically, in bone marrow-derived dendritic cells, FFAs such as palmitic acid and oleic acid enhance the production of IL-23 and IL-1β; for instance, in acne, these FFAs act as danger signals that sensitize DCs and promote the release of Th1/Th17-related cytokines. Furthermore, the lipid metabolic status of DCs regulates their antigen-presenting capacity and cytokine production, and dysregulated lipid metabolism is associated with aberrant DC function and the pathogenesis of autoimmune diseases[8].
2.3 Integrated Metabolic Stress and Dendritic Cell Dysfunction
Dendritic cell (DC) function is closely associated with the plasticity of their metabolic profiles (e.g., glycolysis versus oxidative phosphorylation), where metabolic reprogramming serves as a key switch governing their pro-inflammatory or tolerogenic differentiation[9]. Metabolic stress within the tumor microenvironment, such as hypoxia or nutrient deprivation, induces endoplasmic reticulum (ER) stress in DCs and impairs antitumor immunity through X-box binding protein 1 (XBP1) activation, suggesting that analogous mechanisms may compromise DC function under other stress conditions. Furthermore, while reactive oxygen species (ROS) can enhance stimulator of interferon genes (STING) signaling and antitumor functions in specific contexts, chronic and excessive ROS, which are induced by high glucose or free fatty acids, typically induce oxidative stress and subsequent DC dysfunction[10].
Overall, metabolic stress in T2D, primarily through high glucose and FFAs, drives DCs into an activated, pro-inflammatory state. These alterations orchestrate aberrant T cell responses, contributing significantly to the chronic inflammation and metabolic dysfunction that define T2D. Understanding these intricate interactions is crucial for developing targeted immunotherapies that can modulate DC function and mitigate the inflammatory burden in T2D.
%20concentrations%20in%20different%20samples_.png)
Fig. 3 Measurement of free fatty acid (NEFA/FFA) concentrations in different samples. Concentrations were determined using the Free Fatty Acids (NEFA/FFA) Colorimetric Assay Kit (Cat. No. E-BC-K792-M) in human plasma, mouse serum, 10% rat liver tissue homogenate (protein concentration: 11.56 g protein/L, diluted 2‑fold), and Jurkat cells (protein concentration: 2.38 g protein/L). (The data are provided by Elabscience.)
Elabscience® Quick Overview of Popular Products:
Table 1. Reagents for Glucose and Fatty Acid Metabolism
|
Product Name |
Cat. No. |
|
2-NBDG Glucose Uptake Cell-Based Kit |
E-CK-A441 |
|
Glucose (GLU) Fluorometric Assay Kit |
E-BC-F037 |
|
Fatty Acid Uptake Fluorometric Assay Kit |
E-BC-F067 |
|
Extracellular Acidification Rate (ECAR) Fluorometric Assay Kit |
E-BC-F069 |
|
Glycolysis Stress Fluorometric Assay Kit |
E-BC-F084 |
|
Free Fatty Acids (NEFA/FFA) Fluorometric Assay Kit |
E-BC-F039 |
|
Adipogenesis Fluorometric Assay Kit |
E-BC-F065 |
|
Glyceraldehyde-3-Phosphate Dehydrogenase (GAPDH) Activity Assay Kit |
E-BC-K790-M |
|
Fatty Acid Oxidation (FAO) Colorimetric Assay Kit |
E-BC-K784-M |
03 Temporal dynamics of DC-mediated T cell responses during diabetes progression
The temporal dynamics of dendritic cell (DC)-mediated T cell responses during diabetes progression are complex and vary depending on the type of diabetes, exhibiting distinct phases of immune activation and regulation. DCs, as professional antigen-presenting cells (APCs), play a pivotal role in initiating and shaping T cell responses, which are critical in both type 1 diabetes (T1D) and type 2 diabetes (T2D) pathogenesis.
The temporal progression of DC-mediated T cell responses in diabetes can be summarized as follows:
Early Phase (Prediabetes/Early Diabetes): DCs become activated due to metabolic stressors, leading to increased antigen presentation and co-stimulation, primarily promoting pro-inflammatory T cell responses. There is an imbalance in cytokine production, favoring inflammation[11].
Established Disease (Chronic Phase): Sustained activation of adaptive immunity, with elevated frequencies of activated T cells and persistent pro-inflammatory cytokine production. T cell exhaustion may emerge as a consequence of chronic stimulation, although its exact contribution to inflammation in T2D is still being elucidated. Tissue-specific DC populations, such as those in adipose tissue, continuously drive local inflammation[12].
Complications Phase: Continued DC and T cell dysregulation contributes to macro- and microvascular complications, exemplified by pDC involvement in endothelial dysfunction and changes in corneal DC density in patients with chronic kidney disease[13].
Understanding these temporal dynamics is crucial for identifying therapeutic windows and developing targeted interventions. Strategies aiming to modulate DC function, such as promoting tolerogenic DCs (tDCs) that express inhibitory signals like PD-L1 and release anti-inflammatory cytokines, hold potential to restore immune balance and mitigate disease progression[14].
04 DC-mediated modulation of Th1/Th17 responses in pancreatic islets
In type 2 diabetes (T2D), chronic low-grade inflammation within the pancreatic islets is a central hallmark of disease progression. Dendritic cells (DCs), acting as key immune sentinels, regulate pro-inflammatory Th1 and Th17 cell responses in the local islet microenvironment through multiple mechanisms, thereby exacerbating insulin resistance and β-cell dysfunction[15].
Under metabolic stress conditions in T2D (e.g., hyperglycemia, lipotoxicity), pancreatic β-cells undergo dysfunction, endoplasmic reticulum stress, or apoptosis, releasing autoantigens or damage-associated molecular patterns (DAMPs)[15]. Dendritic cells (DCs), primarily conventional DC type 1 (cDC1), within the islets and surrounding adipose tissue capture these antigens. Stimulated by metabolic inflammatory factors (e.g., TNF-α, IL-1β, free fatty acids), DCs undergo a metabolic shift driven by mTOR signaling, enhancing glycolysis and activating STAT3, which promotes their migration to lymph nodes and T‑cell activation capacity. Subsequently, DCs mature, upregulate MHC‑II (analyzed using anti MHC II antibody) and costimulatory molecules (e.g., CD80, CD86), and migrate to pancreatic draining lymph nodes. In the lymph nodes, activated DCs present antigens to naïve CD4⁺ T cells. The specific cytokine profile secreted by DCs dictates the differentiation direction of T cells: IL‑12 secretion by DCs is a key signal driving Th1 differentiation, and Th1 cells in turn secrete IFN‑γ, activating macrophages and exacerbating islet inflammation. The combination of IL‑6, IL‑1β, and TGF‑β secreted by DCs drives naïve T cells toward Th17 differentiation. Th17 cells secrete IL‑17A, IL‑17F, and IL‑22, recruiting neutrophils and cooperating with other inflammatory cells to disrupt islet homeostasis. Moreover, DCs infiltrating the islets act as amplifiers of the cytokine network, continuously producing pro‑inflammatory factors (e.g., IL‑1β, IL‑6, TNF‑α) that directly impair β‑cell function and enhance the local inflammatory milieu, further promoting the survival and effector functions of differentiated Th1/Th17 cells. Concurrently, activated DCs in the islets interact with resident or infiltrating macrophages (M1 type), forming a positive feedback loop that collectively amplifies inflammatory signals and sustains the Th1/Th17 response[16,17].
In conclusion, under T2D conditions, metabolic abnormalities (e.g., hyperglycemia, elevated free fatty acids) activate dendritic cells (DCs), leading to alterations in their metabolism and function. Activated DCs directly drive the differentiation of naive CD4+ T cells into pro-inflammatory Th1 and Th17 cells by migrating to lymphoid tissues and secreting a specific cytokine profile (e.g., IL-12, IL-6, IL-23). Meanwhile, the accumulation and sustained activation of DCs in metabolic sites such as pancreatic islets and adipose tissue shape and maintain an inflammatory microenvironment that favors the persistence of Th1/Th17 responses, thereby disrupting immune homeostasis and exacerbating islet β-cell dysfunction and insulin resistance. Targeting DCs or their downstream cytokine pathways offers a potential therapeutic strategy to intervene in the immuno-inflammatory axis of T2D[17,18].
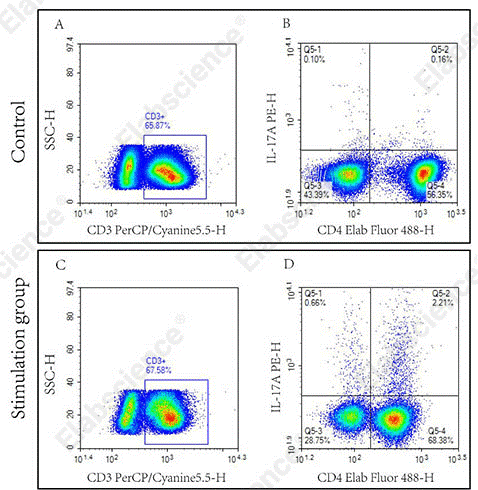
Fig. 4 Detection of Th17 cells in human PBMCs. The assay was performed using the Human Th17 Flow Cytometry Staining Kit (Cat. No. XJH002). Normal PBMCs (Control) and PBMCs stimulated with Cell Stimulation MIX (Stimulation group) were analyzed. Th17 cells were identified as CD3⁺CD4⁺IL‑17A⁺ cells (quadrant Q5‑2). (The data are provided by Elabscience.)
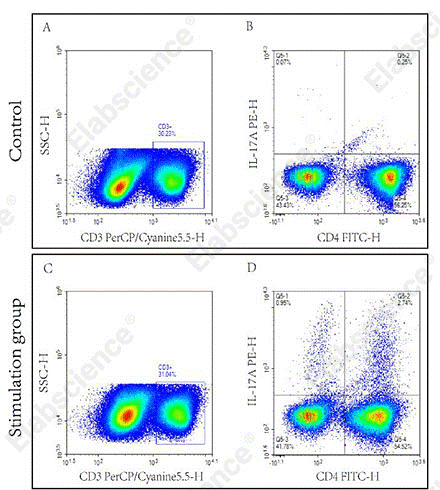
Fig. 5 Detection of Th17 cells in C57BL/6 mouse splenocytes. The assay was performed using the Mouse Th17 Flow Cytometry Staining Kit (Cat. No. XJM002). Splenocytes were either stimulated with Cell Stimulation Mix (Stimulation group) or unstimulated (Control). Th17 cells were identified by gating on CD3⁺CD4⁺IL‑17A⁺ cells (quadrant Q5‑2). (The data are provided by Elabscience.)
05 DC-T cell co-culture assays to study antigen presentation
DC-T cell co-culture is a classic in vitro experimental system for investigating dendritic cell (DC) antigen presentation, T cell activation, and immune synapse formation. This system allows precise regulation of the type of stimulating antigen, cell ratio, and culture conditions, thereby facilitating quantitative analysis of antigen presentation efficiency and its subsequent effects[19,20]. The following section will detail the protocol for the isolation, in vitro culture, and maturation induction of mouse DCs, as well as the specific experimental procedures for co-culture with T cells and representative examples of DC-mediated antigen presentation to T cells for target cell killing.
5.1 In vitro culture and maturation of DCs (dendritic cell differentiation)
C57BL/6 mouse bone marrow cells were obtained from mice and cultured in differentiation medium for 6 days, followed by incubation in maturation medium for 24 h to obtain mature dendritic cells (DCs). Detailed procedures and culture medium preparation please refer to the “Mouse Bone Marrow-derived Dendritic Cells (BMDC) Induction and Identification Kit” (Cat. No. XJM003).
5.2 CD8⁺ T cell isolation, antigen presentation, and activation culture (dendritic cell T cell activation)
Firstly, Splenocytes from C57BL/6 mouse were collected, ground, and CD8+ T cells were isolated using a CD8+ cell isolation kit. The purity of the isolated CD8+ T cells was examined. Detailed isolation procedures please refer to the “EasySort™ Mouse CD8⁺ T Cell Isolation Kit” (Cat. No. MIM003N).
Secondly, Isolated T cells were labeled with CFSE staining solution at 37 ℃ for 5 min, then the staining was terminated. The cells were centrifuged, washed, resuspended in complete RPMI‑1640 medium, and counted. Detailed CFSE staining procedures please refer to the CFSE Cell Division Tracker Kit (Cat. No. E-CK-A345).
Thirdly, RAW264.7 cells were inactivated by heating in an 80 ℃ water bath for 4 h, then centrifuged, washed, resuspended in complete RPMI‑1640 medium, and counted. (The preparation of complete RPMI‑1640 medium is described in the manual of Mouse Bone Marrow-derived Dendritic Cells (BMDC) Induction and Identification Kit.). Then, inactivated RAW264.7 cells and mature BMDCs were co‑cultured at a 1:1 ratio for 24 h. Cells were collected by centrifugation at 100×g for 3 min, the supernatant was discarded, and the cell pellet was resuspended in complete RPMI-1640 medium and counted to obtain BMDC cells that have been loaded with the antigens of the target cells.
Fourthly, CFSE‑labeled T cells and BMDCs (loaded with the antigens of the target cells) were mixed at a 10:1 ratio, seeded into 6‑well plates, and cultured for 72 h. Besides, another CFSE‑labeled T cells alone were used as the control group. (Half the volume of complete RPMI‑1640 medium was replenished every 24 h during co‑culture.)
Moreover, microscopic observation was used during co‑culture to estimate the status of T cell proliferation and clustering. Cells were collected by centrifugation at 150×g for 3 min after 72 h, resuspended in fresh complete RPMI‑1640 medium, and counted. The data analysis of CFSE serves as one of the indicators for measuring the proliferation status of T cells. These activated and proliferating T cells are used for the subsequent experiments of killing target cells.
5.3 Apoptosis detection of target cells killed by CD8⁺ T cells
Activated and proliferating T cells and target RAW264.7 cells were mixed at a 2:1 ratio and incubated in a 37 ℃ CO₂ incubator for 24 h. Besides, another RAW264.7 cells alone were used as the control group. The cell pellet was collected (culture supernatant was also collected simultaneously and stored at -20 ℃ for later use), then washed with PBS, and stained with a caspase‑3/7 flow cytometry substrate and Elab Fluor® Violet 450 Anti‑Mouse CD8a antibody. Caspase‑3/7 activity in the CD8-negative cell population (RAW264.7 cells) was analyzed by flow cytometry. (Detailed caspase‑3 detection procedures please refer to the manual of the Caspase 3/7 Activity Detection Substrate for Flow Cytometry (Cat. No. E-CK-A483))
Frozen cell culture supernatants were thawed at room temperature and centrifuged at 10,000×g for 5 min. The supernatants were collected, and the levels of IFN‑γ, IL‑2, and TNF‑α were measured by ELISA. (Detailed detection procedures refer to the manuals of ELISA kits CQM002, CQM005, and CQM006, respectively.)
%20maturation_.jpg)
Fig. 6 Flow cytometric analysis of dendritic cell (DC) maturation. DCs were induced from C57BL/6 mouse bone marrow cells and cultured with maturation stimuli. The expression levels of MHC II, CD80, CD40, and CD86 were significantly upregulated after stimulation. (The data are provided by Elabscience.)
_.png)
Fig. 7 Interaction between T cells and bone marrow-derived dendritic cells (BMDCs). CD8+ T cells were isolated from the splenocytes of C57BL/6 mice using EasySort™ Mouse CD8+T Cell Isolation Kit (Cat. No. MIM003N). The purity of the isolated CD8+ T cells was verified by flow cytometry. Following CFSE labeling, CD8+ T cells were co‑cultured with mature BMDCs for 72 h in vitro, and the proliferation of CD8+ T cells was subsequently assessed. (The data are provided by Elabscience.)
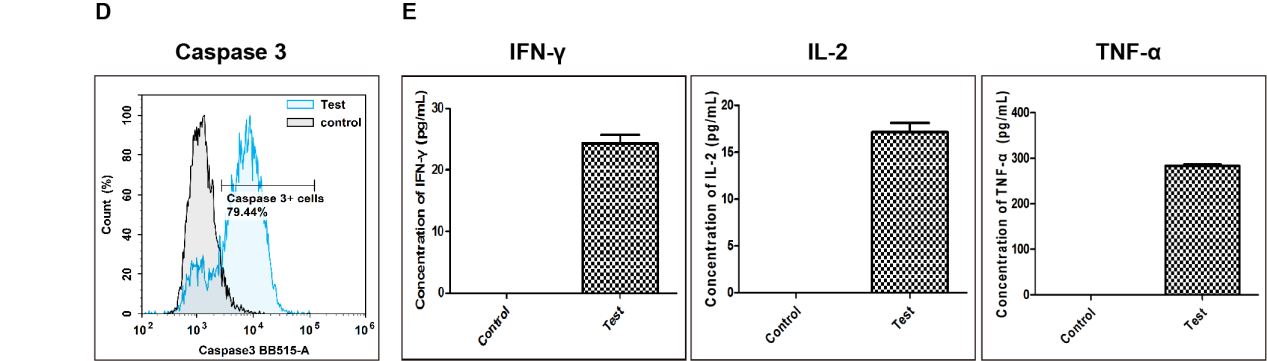
Fig. 8 Detection of apoptosis in target cells killed by CD8+ T cells. (D) After co‑culture of activated T cells with RAW264.7 target cells at a ratio of 1:10 for 24 h, caspase‑3 activity in target cells was measured by flow cytometry. Compared with the Control group (target cells cultured without activated T cells), the proportion of RAW264.7 cells with activated caspase‑3 increased to 79.44% in the co‑culture group (Test). (E) Cytokine levels in cell culture supernatants were measured by ELISA. Compared with the Control group, the levels of IFN‑γ, IL‑2, and TNF‑α were markedly increased in the co‑culture group (Test). (The data are provided by Elabscience.)
Elabscience® Quick Overview of Popular Products:
Table 2. Reagents for DC-T cell co-culture
|
Product Name |
Cat. No. |
|
EasySort™ Mouse CD8+T Cell Isolation Kit |
MIM003N |
|
EasySort™ Mouse CD3+T Cell Isolation Kit |
MIM001N |
|
EasySort™ Mouse CD4+T Cell Isolation Kit |
MIM002N |
|
EasySort™ Human CD3+T Cell Isolation Kit |
MIH001N |
|
EasySort™ Human CD4+ T Cell Isolation Kit |
MIH002N |
|
EasySort™ Human CD8+ T Cell Isolation Kit |
MIH003N |
|
EasySort™ Human Naïve Pan T Cell Isolation Kit |
MIH006N |
|
EasySort™ Human Naïve CD4+T Cell Isolation Kit |
MIH007N |
|
EasySort™ Human Naïve CD8+T Cell Isolation Kit |
MIH008N |
|
EasySort™ Mouse Pan-Naïve T Cell Isolation Kit |
MIM006N |
|
EasySort™ Mouse Naïve CD4+T Cell Isolation Kit |
MIM007N |
|
EasySort™ Mouse Naïve CD8+T Cell Isolation Kit |
MIM008N |
|
EasySort™-5 Magnet |
EC001 |
|
Mouse Bone Marrow-derived Dendritic Cells (BMDC) Induction and Identification Kit |
XJM003 |
|
FITC Anti-Mouse CD3 Antibody[17A2] |
E-AB-F1013C |
|
Elab Fluor® Violet 450 Anti-Mouse CD8a Antibody[53-6.7] |
E-AB-F1104Q |
|
Caspase 3/7 Activity Detection Substrate for Flow Cytometry |
E-CK-A483 |
|
Caspase 3/7 and Annexin V Double Staining Apoptosis Kit |
E-CK-A831 |
|
Caspase 1 Activity Detection Substrate for Flow Cytometry |
E-CK-A481 |
|
Reactive Oxygen Species (ROS) Fluorometric Assay Kit (Red) |
E-BC-F005 |
|
Lactate Dehydrogenase (LDH) Cytotoxicity Colorimetric Assay Kit |
E-BC-K771-M |
|
CellaQuant™ Mouse TNF-α (Tumor Necrosis Factor Alpha) ELISA Kit |
CQM002 |
|
CellaQuant™ Mouse IL-2 (Interleukin 2) ELISA Kit |
CQM006 |
|
CellaQuant™ Mouse IFN-γ (Interferon Gamma) ELISA Kit |
CQM005 |
Table 3. Multicolor Panel for Flow Cytometric Analysis of T Cells
|
Marker |
Clone |
Fluorochrome |
Cat. No. |
Species Reactivity |
|
CD45 |
30-F11 |
PerCP/Cyanine5.5 |
E-AB-F1136J |
Mouse |
|
CD3 |
17A2 |
FITC |
E-AB-F1013C |
Mouse |
|
CD4 |
GK1.5 |
PE |
E-AB-F1097D |
Mouse |
|
CD8a |
53-6.7 |
APC |
E-AB-F1104E |
Mouse |
|
CD45 |
HI30 |
Elab Fluor® Violet 450 |
E-AB-F1137Q |
Human |
|
CD3 |
OKT-3 |
APC |
E-AB-F1001E |
Human |
|
TCR γ/δ |
B1 |
FITC |
E-AB-F1145C |
Human |
|
CD45 |
HI30 |
Elab Fluor® Violet 450 |
E-AB-F1137Q |
Human |
|
CD3 |
UCHT1 |
Elab Fluor® Red 780 |
E-AB-F1230S |
Human |
|
CD4 |
SK3 |
FITC |
E-AB-F1352C |
Human |
|
CD8 |
OKT-8 |
PerCP/Cyanine5.5 |
E-AB-F1110J |
Human |
|
CD25 |
BC96 |
PE |
E-AB-F1194D |
Human |
|
CD127 |
A019D5 |
APC |
E-AB-F1152E |
Human |
References:
[1] Seifarth C C, Hinkmann C, Hahn E G, et al. Reduced frequency of peripheral dendritic cells in type 2 diabetes[J]. Experimental and clinical endocrinology & diabetes, 2008, 116(03): 162-166.
[2] Yun T J, Lee J S, Machmach K, et al. Indoleamine 2, 3-dioxygenase-expressing aortic plasmacytoid dendritic cells protect against atherosclerosis by induction of regulatory T cells[J]. Cell metabolism, 2016, 23(5): 852-866.
[3] Chen J, Liu J, Cao X. Functional and Metabolic Heterogeneity of Dendritic Cells in Self‐Tolerance and Autoimmunity[J]. Immunological Reviews, 2025, 336(1): e70068.
[4] Brombacher E C, Everts B. Shaping of dendritic cell function by the metabolic micro-environment[J]. Frontiers in endocrinology, 2020, 11: 555.
[5] Nicholas D A, Proctor E A, Agrawal M, et al. Fatty acid metabolites combine with reduced β oxidation to activate Th17 inflammation in human type 2 diabetes[J]. Cell metabolism, 2019, 30(3): 447-461. e5.
[6] Garg S S, Kushwaha K, Dubey R, et al. Association between obesity, inflammation and insulin resistance: Insights into signaling pathways and therapeutic interventions[J]. Diabetes research and clinical practice, 2023, 200: 110691.
[7] Thomas A M, Dong Y, Beskid N M, et al. Brief exposure to hyperglycemia activates dendritic cells in vitro and in vivo[J]. Journal of cellular physiology, 2020, 235(6): 5120-5129.
[8] Guo Z, Yang Y, Liao Y, et al. Emerging roles of adipose tissue in the pathogenesis of psoriasis and atopic dermatitis in obesity[J]. JID Innovations, 2022, 2(1): 100064.
[9] Domblides C, Lartigue L, Faustin B. Metabolic stress in the immune function of T cells, macrophages and dendritic cells[J]. Cells, 2018, 7(7): 68.
[10] Jiang Y, Tao Z, Chen H, et al. Endoplasmic reticulum quality control in immune cells[J]. Frontiers in Cell and Developmental Biology, 2021, 9: 740653.
[11] Wang R. Anterior Segment Changes in Prediabetes and Diabetes[D]. University of Houston, 2022.
[12] Nam H W, Cho Y J, Lim J A, et al. Functional status of immune cells in patients with long-lasting type 2 diabetes mellitus[J]. Clinical & Experimental Immunology, 2018, 194(1): 125-136.
[13] Nam H W, Cho Y J, Lim J A, et al. Functional status of immune cells in patients with long-lasting type 2 diabetes mellitus[J]. Clinical & Experimental Immunology, 2018, 194(1): 125-136.
[14] Sun P, Jin Q, Nie S, et al. Unlike PD‐L1, PD‐1 is downregulated on partial immune cells in type 2 diabetes[J]. Journal of diabetes research, 2019, 2019(1): 5035261.
[15] Clark A L, Urano F. Endoplasmic reticulum stress in beta cells and autoimmune diabetes[J]. Current opinion in immunology, 2016, 43: 60-66.
[16] Soedono S, Cho K W. Adipose tissue dendritic cells: critical regulators of obesity-induced inflammation and insulin resistance[J]. International Journal of Molecular Sciences, 2021, 22(16): 8666.
[17] Jin F, Xie L, Zhang H, et al. Dendritic Cells: Origin, Classification, Development, Biological Functions, and Therapeutic Potential[J]. MedComm, 2025, 6(11): e70455.
[18] Sun L, Ding F, Zhou L, et al. Apoptosis of dendritic cells and autoimmune disease[J]. Frontiers in Bioscience-Landmark, 2024, 29(4): 157.
[19] Khan F U, Khongorzul P, Raki A A, et al. Dendritic cells and their immunotherapeutic potential for treating type 1 diabetes[J]. International journal of molecular sciences, 2022, 23(9): 4885.
[20] Coillard A, Tang-Huau T L, Segura E. Assessing the Ability of Human Dendritic Cells to Stimulate Naive CD4+ and CD8+ T Cells[M]//Dendritic Cells: Methods and Protocols. New York, NY: Springer US, 2023: 265-278.

