

Table of Contents
1. How antibody clone consistency affects in vivo PD-1 blockade
2. Endotoxin levels as a variable in in vivo immune studies
3. Antibody aggregation and its impact on functional activity
4. Purity as a critical quality attribute for functional anti-PD-1
5. Batch-to-batch consistency in PD-1 functional antibodies
6. Selecting functional anti-PD-1 for reproducible in vivo studies
7. Key takeaways
8. Related resources
Introduction
You ordered the anti-PD-1[1] clone used in a landmark study, ran it in the same model, and got a tumour growth curve that does not match the paper, sometimes weaker, sometimes stronger.
A clone number identifies the B-cell lineage and the epitope. It says nothing about antibody aggregation, endotoxin levels, antibody purity, or whether the lot you hold behaves like the one characterised last year. This article walks through those four attributes and ends with questions worth putting to a supplier.
01 How antibody clone consistency affects in vivo PD-1 blockade
1.1 What a clone number certifies
Two suppliers may offer antibodies derived from the same hybridoma or encoded by the same variable-region sequence, but this does not guarantee identical product characteristics. Everything else belongs to the manufacturer: expression host, culture conditions, purification resin, and QC release criteria. Glycosylation moves with host and culture, so the same clone can engage Fc receptors differently in vivo.
1.2 Four attributes that separate same-clone products
● Aggregate content shifts Fc engagement and tumour exposure.
● Endotoxin levels set the innate background PD-1 blockade is measured against.
● Purity decides how much of the dose is intact IgG.
● Batch consistency decides whether the second vial behaves like the first.
Table 1. Quality attributes beyond clone identity
|
Attribute |
Why it matters |
Typical consequence |
|
Aggregate content |
Aggregated IgG engages FcγR and clears faster |
Less antibody at the tumour |
|
Endotoxin level |
Residual LPS activates TLR4 on innate cells |
Confounded microenvironment |
|
Purity |
HCP, Protein A, and fragments travel with the dose |
Immunogenicity risk |
|
Batch consistency |
Attributes above can move between runs |
Protocols stop reproducing |
Key point: Two antibodies with the same clone can give statistically different tumour growth curves. Treat the clone as a starting point, not a specification.
02 Endotoxin levels as a variable in in vivo immune studies
2.1 How little LPS it takes
Endotoxin is a carryover from the E. coli expression host and from purification buffers and columns. Once injected, LPS binds TLR4 on dendritic cells, macrophages, and monocytes, the same cells that carry the response you are measuring, and raises IL-12, IFN-α, and TNF-α along a route unrelated to the PD-1 axis[2].
Table 2. Endotoxin levels and in vivo suitability
|
Endotoxin level |
Grade |
In vivo suitability |
|
< 0.01 EU/µg |
Low-endotoxin grade |
Preferred for checkpoint studies |
|
0.01 – 0.1 EU/µg |
Standard research grade |
Acceptable once documented |
|
> 0.1 EU/µg |
Uncontrolled |
TLR4 activation likely; avoid |
2.2 Why it is hard to spot
Above roughly 0.1 EU/µg, tumour inhibition can no longer be attributed to PD-1 blockade alone. Below that the effect becomes small and erratic rather than absent, and recruited MDSCs can mask a real blockade effect. If your curves swing between experiments, read the endotoxin value on both lots before blaming the model.
03 Antibody aggregation and its impact on functional activity
Why the gel looks clean
Antibodies aggregate during expression, purification, shipping, and freeze-thaw, without changing what you see on a Coomassie gel[3]. That is why "purity above 95 percent by SDS-PAGE" says nothing about aggregate content. SEC-HPLC separates species by size; SDS-PAGE does not.
Table 3. Consequences of antibody aggregation
|
Effect |
Mechanism |
Consequence |
|
Faster clearance |
Cleared by spleen and liver |
Less antibody at the tumour |
|
FcγR cross-linking |
Clusters myeloid Fc receptors |
PD-1⁺ cells depleted rather than blocked |
|
Lower specific activity |
Poor PD-1 binding |
Higher dose needed |
|
Anti-drug antibodies |
More immunogenic |
Efficacy fades over long dosing |
Key point: Five percent aggregate reads as a rounding error. In a 200 µg dose it is 10 µg of multivalent IgG doing something other than blocking PD-1.
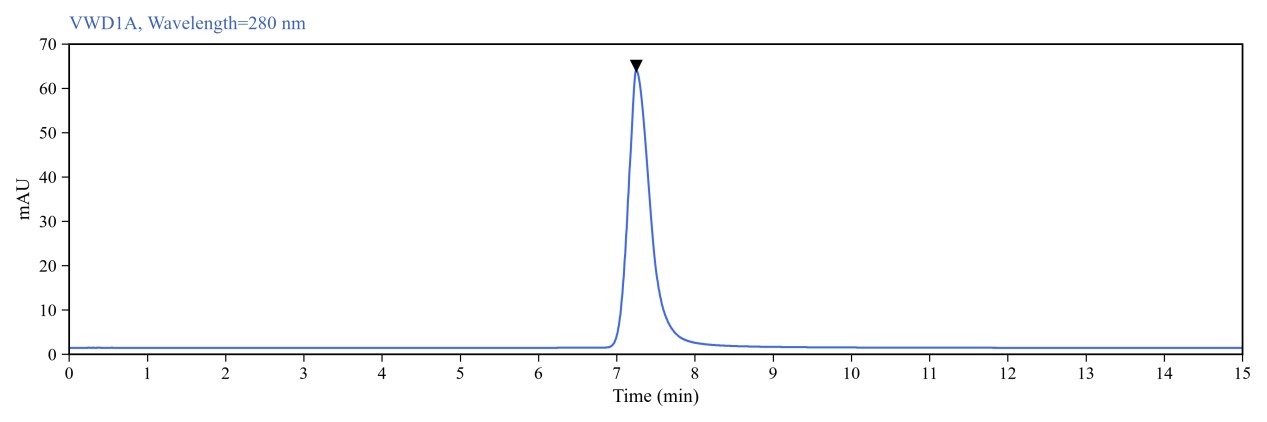
Fig. 1 Monomer purity ≥ 95% as determined by analytical size-exclusion chromatography (SEC).
04 Purity as a critical quality attribute for functional anti-PD-1
What travels with the dose
Purity is the fraction of the dose that is intact, correctly folded, monospecific IgG. Everything else competes, interferes, or triggers something unintended.
Table 4. Common impurities in antibody preparations
|
Impurity |
Source |
Consequence |
|
Host cell proteins |
Culture supernatant |
Immunogenic; anti-drug antibodies |
|
Leached Protein A |
Affinity capture |
Fc receptor engagement |
|
Degraded fragments |
Shear, heat, storage |
Fab competes for PD-1 |
|
Aggregates |
See section 3 |
Altered biodistribution |
Key point: "Purity above 95 percent by SDS-PAGE" describes one clean band, not monomer percentage, endotoxin, or whether the lot blocks PD-1 in cells.
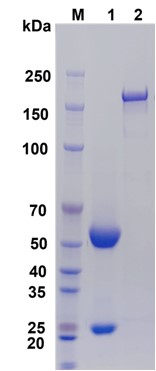
Fig. 2 SDS-PAGE analysis of antibody purity.
M: Protein molecular weight marker; Lane 1: reducing conditions; Lane 2: non-reducing conditions.
05 Batch-to-batch consistency in PD-1 functional antibodies
You fix tumour volume, dose, route, and frequency using Lot A. Eight months later the same catalog number arrives and the survival curve moves. It looks like a mouse problem; more often it is the vial.
Table 5. Parameters that move between lots
|
Parameter |
Source of variation |
Functional result |
|
Aggregate level |
Runs, storage, freeze-thaw |
Changed PK/PD and Fc engagement[4] |
|
Endotoxin level |
Raw materials, column cleaning |
Changed innate background |
|
Glycosylation |
Culture conditions across runs |
Altered FcRn and FcγR binding |
|
Concentration |
Fill and dilution tolerances |
Delivered dose drifts |
|
Potency |
All of the above combined |
Works less well despite identical sequence |
Request before the study starts:
● Recent multi-lot QC covering aggregate, endotoxin, and concentration.
● A cell-based blockade bioassay, not binding ELISA alone.
● A cross-lot comparison against the lot being shipped.
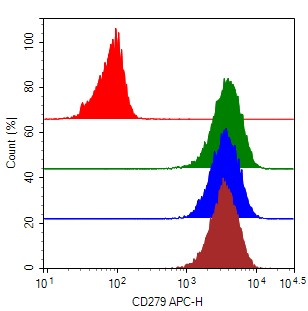
Fig. 3 Batch consistency validation.
Assay Used for This Experiment:
Purified Anti-Mouse CD279 Antibody [RMP1-14], Functional Grade
Cat. No.: AN007850
Clone: RMP1-14
Application: FCM; Block
Isotype: Purified Rat IgG2a, κ Isotype Control [2A3], Functional Grade
Explore the Purified Anti-Mouse CD279 Antibody [RMP1-14] →
06 Selecting functional anti-PD-1 for reproducible in vivo studies
These attributes become purchasing criteria. Whether you need an anti PD-1 antibody or an anti PD-L1 antibody, functional antibody selection comes down to which specifications a supplier will put in writing.
Table 6. Checklist for functional anti-PD-1 and anti-PD-L1 antibodies
|
Criterion |
Ask |
Minimum |
Preferred |
|
Clone identity |
Which clone? |
Confirmed for mouse/human |
Published in vivo use |
|
Endotoxin |
EU/µg? |
Reported, ≤ 0.1 EU/µg |
Low-endotoxin, lot-specific |
|
Monomer content |
SEC-HPLC? |
≥ 95% |
≥ 98% |
|
Purity |
How measured? |
≥ 95% SDS-PAGE |
≥ 98% SEC-HPLC |
|
Functional validation |
Blockade data? |
Bioassay performed |
Data released per lot |
|
Batch consistency |
Multi-lot? |
Same spec across lots |
Recent multi-lot data |
|
In vivo reference |
Animal models? |
Basic characterization |
Published blockade data |
Elabscience® supplies functional anti-PD-1 and anti-PD-L1 reagents for mouse and human research, along with matched isotype controls.
07 Key takeaways
● A clone identifies an epitope; aggregation, endotoxin, purity, and batch drift drive the real differences.
● Endotoxin shifts the microenvironment even below 0.1 EU/µg and rarely appears on datasheets.
● Aggregation matters more in vivo; 95% monomer is the floor, 98% the working target.
● Purity shapes specific activity and immunogenicity through HCP, Protein A, and fragments.
● Batch drift is the most common reason an optimised protocol stops working.
● Compare lots on quality attributes, not clone numbers.
08 Related Resources
● Discover antibody solutions for studying CD3/CD28 co-stimulation, PD-1, TIM-3, CD137 and TIGIT in immuno-oncology research.
Read Functional Antibodies for T Cell Activation and Immune Cell Exhaustion Research →
● Understand the role of isotype controls in flow cytometry, including their applications, how to select appropriate controls, and key considerations for reliable background assessment.
Read Isotype Controls in Flow Cytometry | Purpose, Applications, and Key Considerations →
References:
[1] Pardoll D M. The blockade of immune checkpoints in cancer immunotherapy. Nature Reviews Cancer, 2012. 12(4):252-264.
[2] Muhammed Favas K T, et al. Critical evaluation of endotoxin contamination in intravenous solutions: A call for enhanced regulatory oversight and quality control. Clinical Infection in Practice, 2024. 24:100385.
[3] Vazquez-Rey M, et al. Aggregates in monoclonal antibody manufacturing processes. Biotechnology and Bioengineering, 2011. 108(7):1494-1508.
[4] Desnoyer A, et al. Pharmacokinetic/pharmacodynamic relationship of therapeutic monoclonal antibodies used in oncology: Part 2, immune checkpoint inhibitor antibodies. European Journal of Cancer, 2020. 128:119-128.

