

Reactive oxygen species (ROS) have long been implicated in the aging process, yet their dual role as both damaging agents and essential signaling molecules presents a persistent challenge for experimental design in aging research. This text examines how mitochondrial ROS production increases during aging, how oxidative stress biomarkers can be validated, and how ROS signaling regulates the senescence-associated secretory phenotype (SASP) and T cell dysfunction. We focus on method selection and optimization for ROS assay, oxidative stress assay, lipid peroxidation assay, and cellular senescence assay, providing practical guidance for improving rigor in aging research models.
Table of Contents
1. How does mitochondrial ROS increase during cellular aging?
2. Which ROS biomarkers best reflect age-related oxidative stress?
3. How does ROS signaling regulate the senescence-associated secretory phenotype?
4. How does ROS alter T cell function during aging?
5. How can ROS and oxidative stress assays improve aging research models?
01 How does mitochondrial ROS increase during cellular aging?
Declining mitochondrial quality control (MQC) is a hallmark of aging. With age, oxidative phosphorylation becomes less efficient, altering ATP output and raising ROS generation at respiratory chain complexes I and III. The resulting ROS oxidize mitochondrial DNA, proteins, and lipids, impairing mitochondrial dynamics and mitophagy and accelerating senescence[1]. The change is not linear: midlife elevations act as a protective hormetic signal, whereas persistent ROS in old age drives oxidative damage[1]. Detection requires compartment-specific probes. MitoSOX Red selectively targets matrix superoxide, while HyPer2 biosensors allow real-time ratiometric H₂O₂ measurement in distinct compartments[2]. Conventional DCFH-DA assays of total cellular ROS lack specificity and are prone to autoxidation artifacts[2], so findings need parallel validation by enzymatic assays and EPR spectroscopy. For superoxide, MitoSOX staining combined with flow cytometry in isolated mitochondria or permeabilized cells yields quantitative data, but membrane potential must be controlled because MitoSOX uptake is potential-dependent.
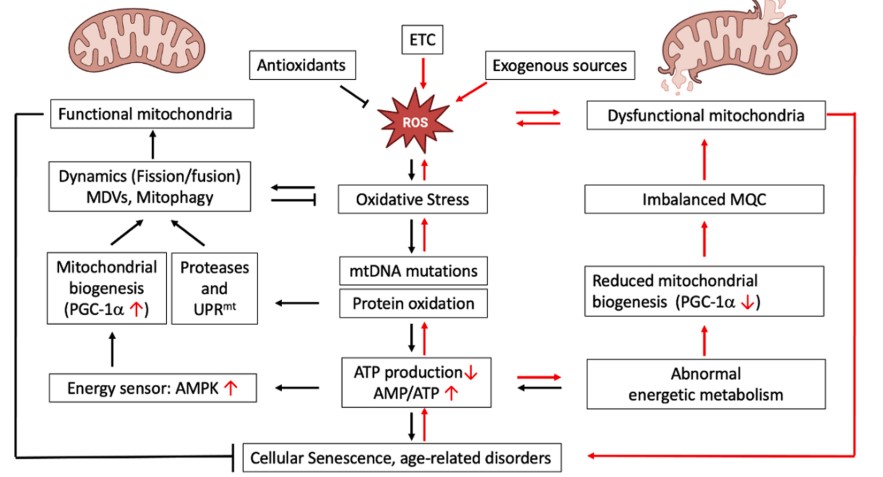
Fig. 1 Mitochondrial dysfunction in aging[1]. ROS from mitochondrial electron transport chain (ETC) and exogenous sources are balanced by antioxidants. Excess ROS causes oxidative stress, mtDNA mutations, and protein oxidation, lowering ATP and activating AMPK. Persistent ATP depletion impairs mitochondrial quality control, causing dysfunction, senescence, and age-related disorders.
02 Which ROS biomarkers best reflect age-related oxidative stress?
Identifying which ROS and aging biomarkers best reflect biological age remains a challenge. A systematic review found blood-based composite biomarkers are mostly validated by cross-sectional association with chronological age, not prospective prediction of health outcomes, and proposed a consensus framework requiring predictive validation across independent cohorts with standardized hazard ratio reporting[3,4]. In oxidative stress assay selection, distinct biomarkers reflect different aspects of oxidative damage. Malondialdehyde (MDA) and 4-hydroxynonenal (4-HNE), measured by TBARS or LC-MS/MS, are widely validated lipid peroxidation assay endpoints[5]. Thiobarbituric acid-reactive substances (TBARS) lack MDA specificity; LC-MS/MS quantification of isoprostanes (e.g., F₂-isoprostanes) is now the gold standard[5]. Protein carbonyls, measured by DNPH derivatization or ELISA, reflect cumulative protein oxidation. For DNA oxidation, urinary or serum 8-OHdG (8-Hydroxydeoxyguanosine) is a non-invasive readout, though artifactual oxidation during processing raises specificity concerns[2]. Multi-marker panels combining lipid, protein and nucleic acid oxidation products are preferred for capturing the complexity of oxidative stress and aging.
03 How does ROS signaling regulate the senescence-associated secretory phenotype?
The SASP is a hallmark of cellular senescence: senescent cells secrete pro-inflammatory cytokines, chemokines and matrix metalloproteinases, with ROS acting as upstream regulators. Persistent mitochondrial ROS activate the DNA damage response (DDR), stabilizing p53 and upregulating p21 while driving NF-κB-mediated transcription of IL-6, IL-8 and other SASP factors[1,2]. mitochondrial-derived vesicles(MDVs) and mitophagy also regulate SASP context-dependently: MDVs exceeding lysosomal capacity are released extracellularly, propagating senescence to neighboring cells[1]. ROS-dependent SASP regulation is best assessed by measuring intracellular ROS and SASP secretion in parallel: induce senescence in primary fibroblasts or epithelial cells with etoposide, ionizing radiation or replicative exhaustion; confirm arrest by EdU incorporation and SA-β-gal staining; quantify IL-6, IL-8 and CXCL1 by ELISA or multiplex arrays; and manipulate ROS with MitoTEMPO or N-acetylcysteine. Notably, tissue-resident immune cells dominate SASP production in vivo, as macrophages secrete IL-1β, IL-6 and TNF at levels orders of magnitude above rare senescent cells[6]. SASP data must therefore distinguish cell-autonomous senescence from immune-driven inflammation.
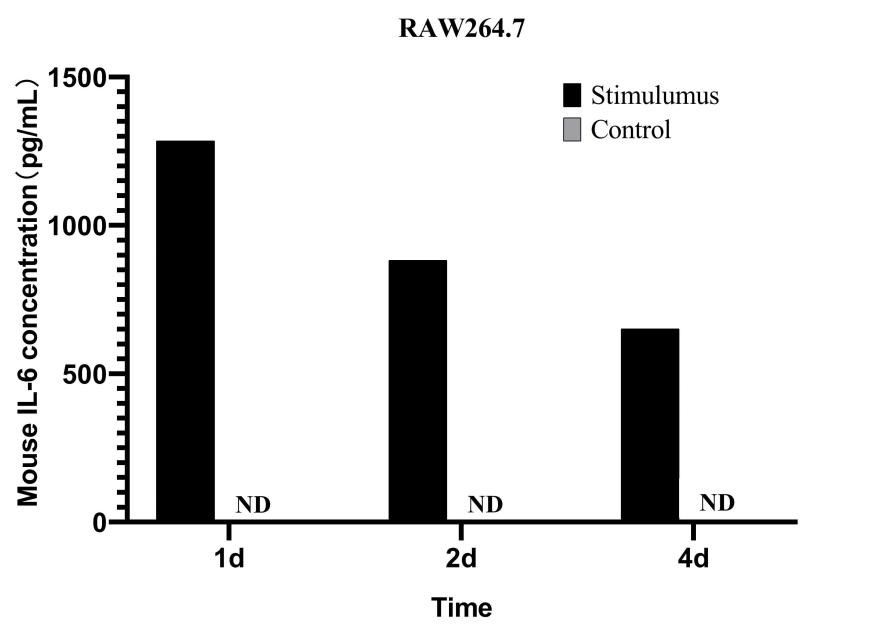
Fig. 2 IL-6 levels in the culture supernatants of RAW264.7 cells stimulated with 1 μg/mL LPS and 20 ng/mL GM-CSF for 1, 2, and 4 days were measured and compared with those in unstimulated cells. (The data are provided by Elabscience®)
04 How does ROS alter T cell function during aging?
T cell aging features thymic involution, reduced naïve T cell output and oxidative stress-prone metabolic reprogramming. Aged CD4⁺ T cells fail to switch from oxidative phosphorylation to glycolysis upon activation, a defect linked to lower GLUT1 expression and altered redox homeostasis[7]. Mitochondrial ROS also accumulates as cytochrome c oxidase efficiency declines, creating an oxidizing environment that suppresses IL-2 production and proliferation[6,7]. TCR signaling intersects with ROS in nuanced ways: TCR engagement activates NADPH oxidase 2(NOX2) to generate extracellular superoxide required for Th2 differentiation, whereas mitochondrial ROS from complex III drives nuclear factor of activated T cells (NFAT) activation and IL-2 induction[7]. With age, this balance shifts toward mitochondrial ROS overproduction, causing sustained p38 MAPK activation and premature exhaustion. Key assays include intracellular thiol measurement with monochlorobimane or ThiolTracker probes, surface thioredoxin-1 (Trx1) quantification, which is reduced on T cells from older adults and tracks with impaired activation[4], and Seahorse extracellular flux analysis of basal and ATP-linked respiration and glycolytic reserve. Methionine restriction or caloric restriction preserves naïve T cell diversity and limits CD8⁺ memory accumulation by lowering oxidative stress and enhancing autophagy[6], positioning ROS metabolism as a therapeutic target in immunosenescence.
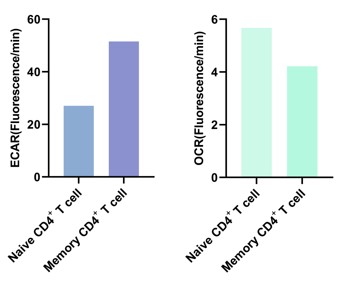
Fig. 3 ECAR (extracellular acidification rate; glycolysis) and OCR (oxygen consumption rate; mitochondrial oxidative phosphorylation) in human peripheral blood Naive and Memory CD4+ T cells. Memory CD4+ T cells show higher ECAR and lower OCR than Naive CD4+ T cells, indicating enhanced glycolysis. (The data are provided by Elabscience®)
05 How can ROS and oxidative stress assays improve aging research models?
In ROS and aging research, assay choice depends on cell type, model and question. MitoSOX Red is most used for mitochondrial ROS, but other sources oxidize it and fluorescence tracks membrane potential; run MitoTracker Green in parallel; resolve H₂O₂ with HyPer2 or roGFP2-Orp1 sensors[2,4]. In the lipid peroxidation assay landscape, TBARS persists, but LC-MS/MS quantification of F₂-isoprostanes is now standard[5]; under "ferro-aging", MDA and 4-HNE induce senescence via protein modification and p38/JNK signaling[4,5], while OxyBlot (DNPH plus immunodetection) detects carbonyls if electrophoresis avoids artifacts. DCFH-DA, the commonest general reactive oxygen species assay, suits screening only given poor H₂O₂ specificity, photooxidation and Fe²⁺/Cu⁺ reactivity; use Amplex Red, dihydroethidium or singlet oxygen sensor green to confirm. SA-β-gal at pH 6.0 remains the gold standard cellular senescence assay, though it appears in non-senescent macrophages[5]; GL13 staining enables detection of senescence-associated lipofuscin in fixed tissues, whereas p16INK4a-CreERT2 mouse models can be used for genetic labeling or manipulation of senescent cell populations[3,7], and p16INK4a immunohistochemistry with p21/IL-6 qPCR is best in human samples.
Practical guidance: match ROS assay choice to compartment and species, using MitoSOX, encoded sensors or LC-MS/MS; prefer multi-marker oxidative stress assay panels, as protein carbonyls, MDA and 8-OHdG together capture oxidative stress and aging[4,5]; in T cell aging studies, pair ROS measurement with extracellular flux and GLUT1, since CD28 loss on CD8⁺ T cells tracks high ROS[7]; attribute in vivo SASP to tissue-resident immune cells, not senescent cells, using single-cell RNA sequencing; validate senescence orthogonally with p21, p16, IL-6, IL-8, MMP3 and SA-β-gal[3,4]. Composite biomarkers require prospective validation against functional decline and multimorbidity.

Fig. 4 HeLa cells were cultured with or without (Control) 5 μM antimycin A for 1 h, and then changes in mitochondrial ROS were detected by mitochondrial superoxide fluorometric assay kit. (The data are provided by Elabscience®)
Elabscience® Quick Overview of Popular Products:
Table 1. Assay kits for oxidative stress and senescence
|
Cat. No. |
Product Name |
|
E-BC-F086 |
Cellular Senescence Fluorometric Assay Kit |
|
E-BC-K025-M |
Malondialdehyde (MDA) Colorimetric Assay Kit (TBA Method) |
|
E-BC-F001 |
Hydrogen Peroxide (H₂O₂) Fluorometric Assay Kit |
|
E-BC-F008 |
Mitochondrial Superoxide Fluorometric Assay Kit |
|
E-BC-K837-M |
Cell Mitochondrial Complex IV Activity Assay Kit |
|
E-EL-0128 |
4-HNE4-Hydroxynonenal ELISA Kit |
|
E-EL-0028 |
8-OHdG(8-Hydroxydeoxyguanosine) ELISA Kit |
|
E-EL-H0149 |
Human IL-1β(Interleukin 1 Beta) ELISA Kit |
|
E-EL-M0044 |
Mouse IL-6 ELISA Kit |
|
E-EL-M0046 |
Mouse IL-10(Interleukin 10) ELISA Kit |
|
E-BC-F003 |
Lipid Peroxide LPO Fluorometric Assay Kit |
|
E-BC-F070 |
Enhanced Oxygen Consumption Rate (OCR)Fluorometric Assay Kit |
|
E-BC-K138-F |
Reactive Oxygen Species (ROS) Fluorometric Assay Kit (Green) |
References:
[1] Guo, Y., Sun, Y., Guo, L., et al., Mitochondrial Dysfunction in Aging. Ageing Research Reviews, 2023. 88:101955 DOI: 10.1016/j.arr.2023.101955
[2] Amorim, J.A., Coppotelli, G., Rolo, A.P., Palmeira, C.M., Ross, J.M., Sinclair, D.A., Mitochondrial and Metabolic Dysfunction in Ageing and Age-Related Diseases. Nature Reviews Endocrinology, 2022. 18(4):243-258 DOI: 10.1038/s41574-021-00626-7
[3] Herman, A.B., Gorospe, M., Molecular Tools for Analysing In Vivo Senescence. Nature Reviews Molecular Cell Biology, 2024. 25(12):954 DOI: 10.1038/s41580-024-00790-4
[4] Moqri, M., Herzog, C., Poganik, J.R., et al., Validation of Biomarkers of Aging. Nature Medicine, 2024. 30(2):360-372 DOI: 10.1038/s41591-023-02784-9
[5] Gao, S., Wang, L., Liu, T., et al., Ferro-Aging: A Novel Paradigm Linking Iron Overload, Lipid Peroxidation and Cellular Senescence. Free Radical Biology and Medicine, 2026. 253:817-829 DOI: 10.1016/j.freeradbiomed.2026.06.012
[6] Kim, H.-H., Dixit, V.D., Metabolic Regulation of Immunological Aging. Nature Aging, 2025. 5(8):1425-1440 DOI: 10.1038/s43587-025-00921-2
[7] Torrão, R.C., Bennett, S.J., Brown, J.E., Griffiths, H.R., Does Metabolic Reprogramming Underpin Age-Associated Changes in T Cell Phenotype and Function? Free Radical Biology and Medicine, 2014. 71:26-35 DOI: 10.1016/j.freeradbiomed.2014.03.002

