Mitochondria, the "powerhouse of the cell," not only serves as the central site of cellular energy production but are also involved in key cell processes such as metabolite metabolism and signal transduction. Dysfunction of mitochondria is closely associated with a range of diseases, including neurodegenerative disorders, cardiovascular conditions, and metabolic syndromes. Consequently, accurate assessment of mitochondrial morphology and function is significant for disease diagnosis, drug development, and health management.
In this issue, we outline the metabolic pathways related to mitochondrial function, discuss key detection indicators and methodologies, and highlight their applications in disease contexts.
Table of Contents
1. Mitochondria's role in energy metabolism
2. Measuring mitochondrial respiration rates
3. Factors affecting mitochondrial membrane potential
4. Techniques for measuring ATP production in cells
5. Mitochondrial dysfunction in disease
6. Application fields of mitochondrial function assays
01 Mitochondria's role in energy metabolism
Mitochondria is the central hub for cellular energy metabolism and signal transduction [1]. The energy conversion process mediated by mitochondria consists of three key stages, forming a complete "glucose-ATP" conversion chain:
Glycolysis: Glucose is broken down into pyruvate in cytoplasm. Then pyruvate is transported into mitochondrial matrix. This pyruvate serves as the primary substrate for further oxidation.
Tricarboxylic Acid (TCA) Cycle: Within the mitochondrial matrix, pyruvate is converted to acetyl-CoA, which then enters the TCA cycle. TCA cycle finally generates NADH, FADH₂, and GTP (which is readily converted to ATP). NADH and FADH₂ function as high-energy electron carriers.
Oxidative Phosphorylation: Electrons derived from NADH and FADH₂ are transferred through a series of protein complexes (the ETC) embedded in the inner mitochondrial membrane. The energy released during this electron transfer is used to pump protons (H⁺) from the matrix into the intermembrane space, generating an electrochemical proton gradient. ATP synthase harnesses the energy from the backflow of protons down this gradient to phosphorylate ADP, thereby producing ATP.
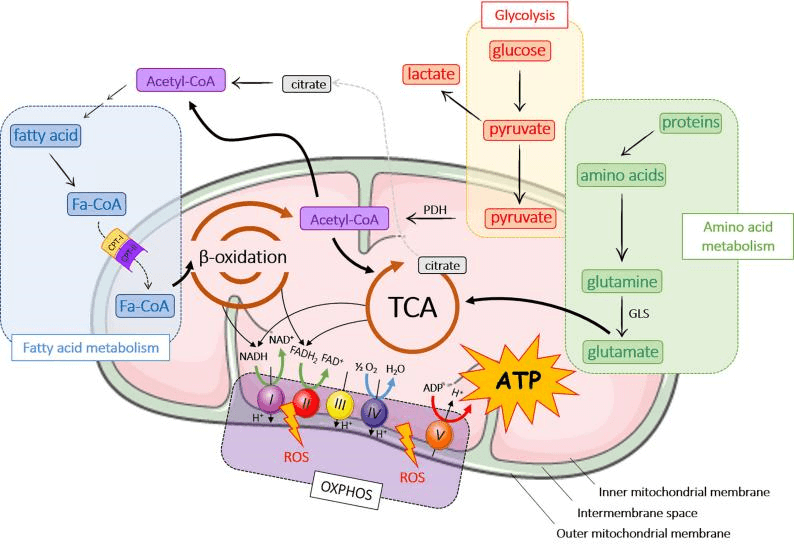
Fig. 1 Major energy metabolic pathways in mitochondria [2].
02 Measuring mitochondrial respiration rates
Mitochondrial respiration rate is a central indicator of mitochondrial function and cellular energy and metabolism status, directly reflecting the activity of oxidative phosphorylation. Its key parameter is the oxygen consumption rate (OCR). A decreased OCR often suggests reduced mitochondrial function and impaired adenosine triphosphate energy production while an increased OCR points to elevated cellular metabolic activity. Detection methods for respiration rate fall into two main categories:
Direct OCR Measurement:
While traditional oxygen electrode methods are complex and automated analyzers can be costly, newer fluorescence-based assays compatible with standard microplate readers. Thus, it offers a simpler and more affordable alternative for assessing energy and metabolism.
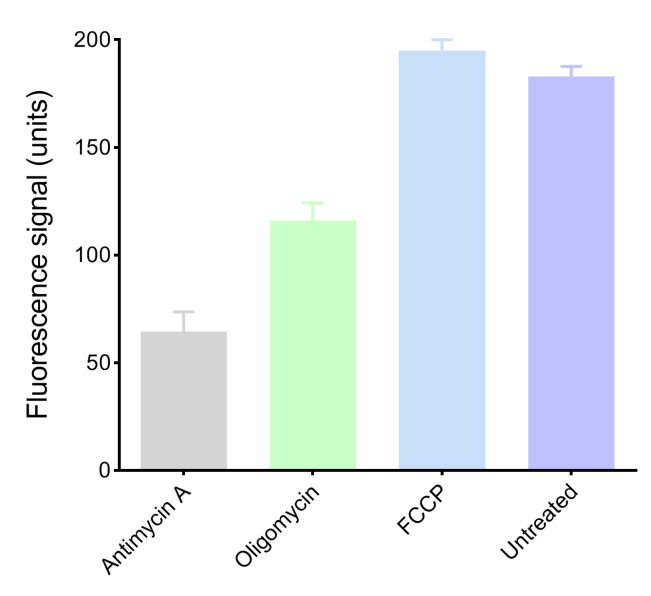
Fig. 2 Cells are treated with mitochondrial respiratory chain inhibitors (Oligomycin, Antimycin A) or uncoupling agents (FCCP), followed by monitoring changes of OCR.
Activity Assays of Respiratory Chain Complexes:
As a complement to OCR, these tests evaluate the efficiency of electron transfer through the five complexes (I-V) of the respiratory chain, which drives adenosine triphosphate energy synthesis. This approach helps assessing electron flow efficiency within the oxidative phosphorylation system.
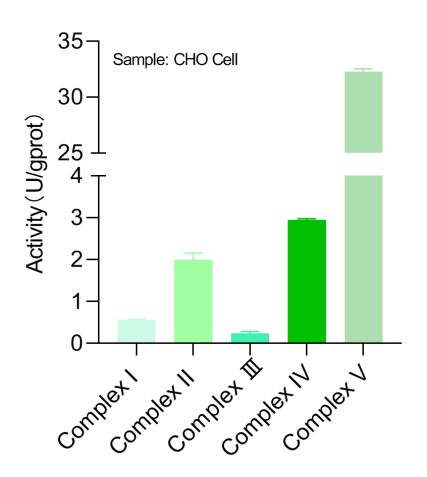
Fig. 3 Detection Results of Mitochondrial Complexes in CHO Cells.
03 Factors affecting mitochondrial membrane potential
The mitochondrial membrane potential (ΔΨm) is a key indicator of functional status, reflecting the efficiency of energy and metabolism. Its stability is governed by three core regulatory factors:
Cellular Energy Metabolism Status: ΔΨm is maintained by active proton pumping via the electron transport chain. The ADP/ATP ratio reflects energy demand: high ADP levels stimulate proton reflux through ATP synthase, transiently reducing ΔΨm to boost ATP production. Metabolic dysfunction impairs the proton gradient [4].
Inner Membrane Integrity and Oxidative Stress: Oxidative stress disrupts the proton gradient by damaging respiratory complexes and increasing membrane permeability, leading to ΔΨm loss. Chemical uncouplers also collapse the gradient artificially [5].
Mitochondrial Dynamics and Quality Control: Balance between fission, fusion, autophagy, and mitochondrial biogenesis regulates ΔΨm. Fission often decreases potential, whereas fusion stabilizes it. Damaged mitochondria with low ΔΨm are removed via mitophagy and replaced through biogenesis.
Mitochondrial membrane potential is commonly detected using lipophilic cationic fluorescent dyes. Key dyes and their features include:
Rhodamine 123 (Rhod123): An early and sensitive dye whose mitochondrial accumulation correlates with ΔΨm.
TMRM/TMRE: Similar with Rhod123, it suitable for quantitative measurement of ΔΨm.
JC-1: A sensitive and widely used probe that exhibits potential-dependent fluorescence emission, forming red fluorescent aggregates at high ΔΨm and green fluorescent monomers at low ΔΨm, enabling both qualitative and quantitative analysis.
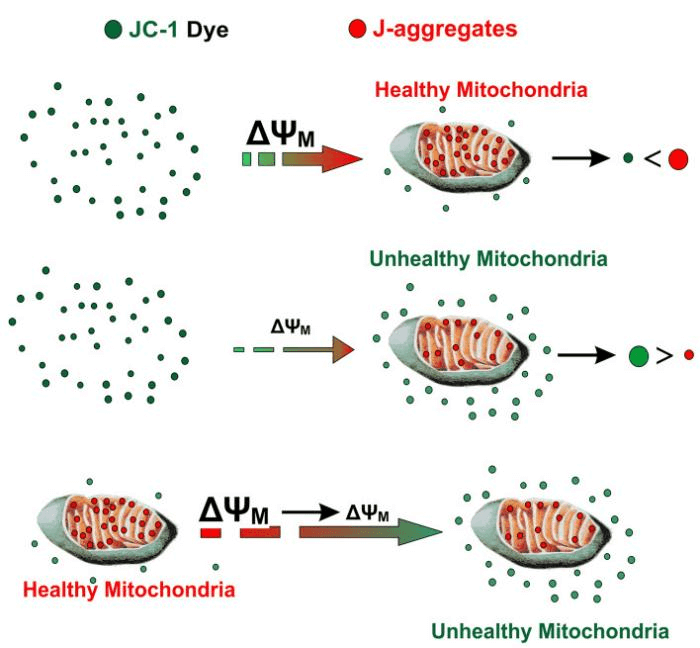
Fig. 4 Analysis of the Mitochondrial Membrane Potential Using the Cationic JC-1 Dyeas a Sensitive Fluorescent Probe [6].
04 Techniques for measuring ATP production in cells
Cellular ATP content is a direct indicator reflecting the energy synthesis function of mitochondria. Current detection techniques can be divided into two major categories, each with distinct characteristics and applicable scenarios. Among them, the luciferin-luciferase bioluminescence assay is widely used due to its excellent performance. Its core advantages include extremely high detection sensitivity, enabling the measurement of ATP production in trace mitochondrial samples, and high-throughput capability, making it suitable for large-scale research scenarios such as mitochondrial respiratory chain function evaluation and metabolic inhibitor efficacy screening.
Table 1. Comparison of Different ATP Detection Methods
|
Detection Method |
Core Principle |
Key Characteristics |
Applicable Scenarios |
|
Bioluminescence Assay |
Luciferase-catalyzed ATP-luciferin reaction; photon intensity ∝ ATP concentration |
Fast (5-15 min), high sensitivity (10-¹² mol/L), easy operation; prone to fluorescent interference |
Lab analysis, on-site rapid detection |
|
Chemiluminescence Assay |
Chemical reaction (e.g., luminol system) with ATP; signal intensity ∝ ATP content |
Fast (10-20 min); lower sensitivity than bioluminescence, oxidant interference |
Routine lab and emergency detection |
|
HPLC |
Column-based ATP separation + UV and fluorescence quantification |
High accuracy and specificity ); slow (30-60 min), costly and professional |
Precise lab analysis (metabolism, drug screening) |
|
ELISA |
ATP-antibody binding + enzyme-labeled colorimetry |
High specificity; tedious (1-2 h), moderate sensitivity |
Complex matrices (blood, tissue extracts) |
|
Colorimetric Assay |
ATP-reagent reaction; absorbance ∝ ATP concentration |
Simple, low-cost (only spectrophotometer); sample color interference |
Primary labs, low-precision needs |
05 Mitochondrial dysfunction in disease
As the center of cellular energy metabolism, mitochondrial dysfunction is closely associated with the occurrence and progression of various diseases, with specific mechanisms variation by disease type:
Cardiovascular Diseases (CVDs)
Mitochondrial dysfunction is a key pathogenic factor in CVDs. The p53 protein exacerbates this dysfunction by disrupting energy metabolism, promoting oxidative stress, apoptosis, and impairing mitophagy and dynamics [7]. In chronic Chagas heart disease, for example, decreased expression of mitochondrial metabolic and β-oxidation proteins leads to myocardial energy deficiency, accelerating disease progression [8].
Neurodegenerative Diseases
Mitochondrial impairment contributes significantly to neurodegenerative disorders such as alzheimer’s and parkinson’s disease [9]. Neuronal energy deficiency and ROS accumulation resulting from mitochondrial dysfunction lead to cell damage and death. Current research focuses on how mitochondrial energy metabolism influences glucose-lipid homeostasis in these conditions [9].
Cancer
Mitochondrial dysfunction acts as a "driver of metabolic reprogramming" in the occurrence and progression of cancer. Mutations in mitochondrial DNA (mtDNA) and the accumulation of misfolded proteins are common in cancer cells [10]. These dysfunctional mitochondria can reprogram cellular metabolic pathways, enabling cancer cells to adapt to the harsh microenvironment of hypoxia and nutrient deficiency, and achieve sustained proliferation [10].
Altered mitochondrial function is a core trigger for metabolic diseases such as obesity, insulin resistance, steatohepatitis, and atherosclerosis [11]. Abnormal mitochondrial energy metabolism leads to fat accumulation and glucose metabolism disorders, which in turn trigger a series of metabolic complications. For example, in the adipose tissue of obese patients, the number of mitochondria decreases and β-oxidation function declines, further exacerbating fat accumulation and insulin resistance.
06 Application fields of mitochondrial function assays
Since mitochondrial plays central role in cell metabolism and closely associated with diseases, accurate evaluation of mitochondrial function is essential for three major fields.
1. Disease Diagnosis and Mechanistic Research. Analysis of mitochondrial dysfunction helps explore the pathogenesis of conditions like cardiovascular and neurodegenerative diseases, offering potential biomarkers for early diagnosis.
2. Basic Biological Research. This work clarifies the involvement of mitochondria in processes such as cellular metabolism, aging, and apoptosis, advancing our understanding of mitochondrial regulation.
3. Drug Development and Safety Evaluation. Since some drugs can impair mitochondrial function, leading to adverse effects like liver or heart injury. Early mitochondrial safety assays ensure patient safety, reduce costs, and improve R&D efficiency.
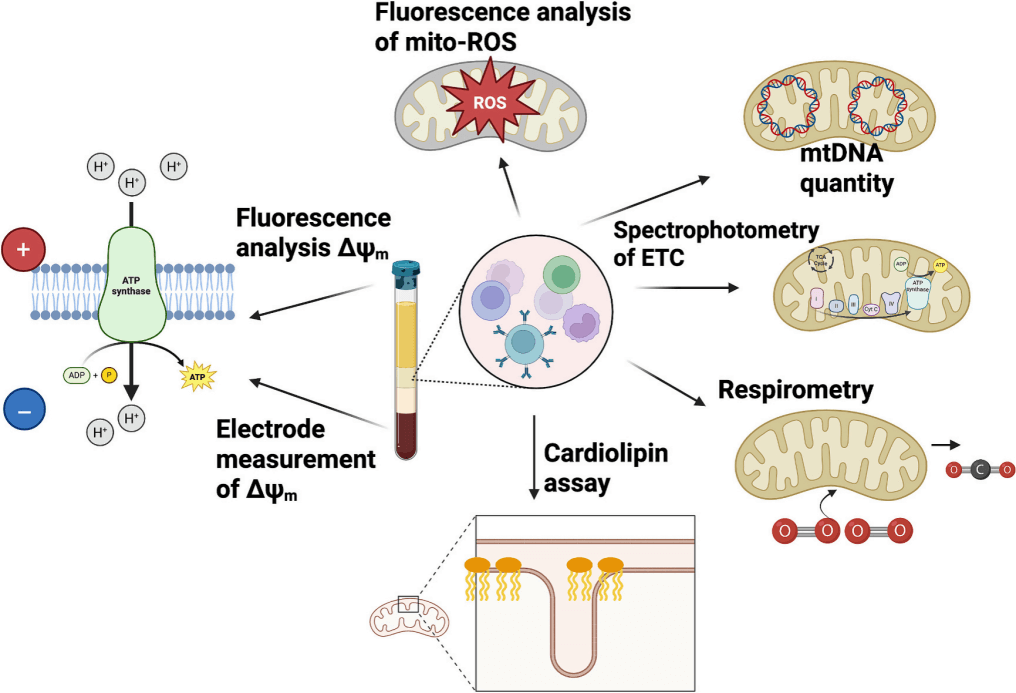
Fig. 5 Common Indicators and Methods for Assessing Mitochondochondrial Function in Cells [3].
In summary, mitochondrial functional status is closely linked to a variety of physiological and pathological processes. Developing more accurate methods for evaluating mitochondrial function and in-depth analysis of the molecular mechanisms of mitochondrial dysfunction will provide new biomarkers for the diagnosis of related diseases and new targets for treatment.
Elabscience® Quick Overview of Popular Products
Table 2. Assay kit for mitochondrial functional Research
|
Cat. No. |
Product Name |
|
E-BC-F002 |
ATP Chemiluminescence Assay Kit |
|
E-BC-F004 |
ATP/ADP Ratio Chemiluminescence Assay kit |
|
E-BC-F005 |
Reactive Oxygen Species (ROS) Fluorometric Assay Kit (Red) |
|
E-BC-K138-F |
Reactive Oxygen Species (ROS) Fluorometric Assay Kit (Green) |
|
E-CK-A301 |
Mitochondrial Membrane Potential Assay Kit (with JC-1) |
|
E-BC-K835-M |
Cell Mitochondrial Complex II Activity Assay Kit |
|
E-BC-K836-M |
Cell Mitochondrial Complex Ⅲ (Coenzyme Q-Cytochrome C Reductase) Activity Assay Kit |
|
E-BC-K837-M |
Cell Mitochondrial Complex IV (Cytochrome C Oxidase ) Activity Assay Kit |
|
E-BC-K838-M |
Cell Mitochondrial Complex Ⅴ (F0F1-ATPase/ATP Synthase) Activity Assay Kit |
|
E-BC-K774-M |
ATP Colorimetric Assay Kit (Enzyme Method) |
|
E-BC-K784-M |
Fatty Acid Oxidation (FAO) Colorimetric Assay Kit |
|
E-BC-F058 |
Pyruvate Fluorometric Assay Kit |
|
E-BC-F046 |
Acetyl Coenzyme A (Acetyl-CoA) Fluorometric Assay Kit |
|
E-BC-K178-M |
Citrate Synthase (CS) Activity Assay Kit |
|
E-BC-F047 |
α-Ketoglutarate (α-KG) Fluorometric Assay Kit |
|
E-CK-A401 |
MitoBright Green Probe Assay Kit |
|
E-CK-A402 |
MitoBright Red Probe Assay Kit |
|
E-BC-E005 |
Plant Mitochondrial Extraction Assay Kit(Enzyme Method) |
|
E-BC-E006 |
Cell Mitochondrial Extraction Assay Kit |
|
E-BC-F064 |
Mitochondrial Permeability Transition Pore (mPTP) Fluorometric Assay Kit |
|
E-BC-F070 |
Enhanced Oxygen Consumption Rate (OCR) Fluorometric Assay Kit |
References:
[1] Park, H. K., & Kang, B. H. (2025). Analysis of mitochondrial membrane potential, ROS, and calcium. Molecules and cells, 48(8), 100238. https://doi.org/10.1016/j.mocell.2025.100238
[2] Loussouarn, C., Pers, Y. M., Bony, C., Jorgensen, C., & Noël, D. (2021). Mesenchymal Stromal Cell-Derived Extracellular Vesicles Regulate the Mitochondrial Metabolism via Transfer of miRNAs. Frontiers in immunology, 12, 623973. https://doi.org/10.3389/fimmu.2021.623973
[3] Sharma, E., Fotooh Abadi, L., Kombe Kombe, J. A., Kandala, M., Parker, J., Winicki, N., & Kelesidis, T. (2025). Overview of methods that determine mitochondrial function in human disease. Metabolism: clinical and experimental, 170, 156300. https://doi.org/10.1016/j.metabol.2025.156300
[4] Ahmed Selim, N., & Wojtovich, A. P. (2025). Mitochondrial membrane potential and compartmentalized signaling: Calcium, ROS, and beyond. Redox biology, 86, 103859. https://doi.org/10.1016/j.redox.2025.103859
[5] Murphy M. P. (2009). How mitochondria produce reactive oxygen species. The Biochemical journal, 417(1), 1–13. https://doi.org/10.1042/BJ20081386
[6] Sivandzade, F., Bhalerao, A., & Cucullo, L. (2019). Analysis of the Mitochondrial Membrane Potential Using the Cationic JC-1 Dye as a Sensitive Fluorescent Probe. Bio-protocol, 9(1), e3128. https://doi.org/10.21769/BioProtoc.3128
[7] Wang, H., Yu, W., Wang, Y., Wu, R., Dai, Y., Deng, Y., Wang, S., Yuan, J., & Tan, R. (2023). p53 contributes to cardiovascular diseases via mitochondria dysfunction: A new paradigm. Free radical biology & medicine, 208, 846–858. https://doi.org/10.1016/j.freeradbiomed.2023.09.036
[8] Teixeira, P. C., Ducret, A., Langen, H., Nogoceke, E., Santos, R. H. B., Silva Nunes, J. P., Benvenuti, L., Levy, D., Bydlowski, S. P., Bocchi, E. A., Kuramoto Takara, A., Fiorelli, A. I., Stolf, N. A., Pomeranzeff, P., Chevillard, C., Kalil, J., & Cunha-Neto, E. (2021). Impairment of Multiple Mitochondrial Energy Metabolism Pathways in the Heart of Chagas Disease Cardiomyopathy Patients. Frontiers in immunology, 12, 755782. https://doi.org/10.3389/fimmu.2021.755782
[9] Huang, J., Zhang, C., Huang, C., Deng, K., Xiao, Y., Gao, W., Wu, M., & Lei, M. (2025). Mitochondria Metabolism Regulates Glucose-Lipid Homeostasis in Neurodegenerative Diseases. Research (Washington, D.C.), 8, 0912.https://doi.org/10.34133/research.0912
[10] Keerthiga, R., Pei, D. S., & Fu, A. (2021). Mitochondrial dysfunction, UPRmt signaling, and targeted therapy in metastasis tumor. Cell & bioscience, 11(1), 186. https://doi.org/10.1186/s13578-021-00696-0
[11] Mackert, O., Wirth, E. K., Sun, R., Winkler, J., Liu, A., Renko, K., Kunz, S., Spranger, J., & Brachs, S. (2022). Impact of metabolic stress induced by diets, aging and fasting on tissue oxygen consumption. Molecular metabolism, 64, 101563. https://doi.org/10.1016/j.molmet.2022.101563

