

The accuracy of quantitative ELISA results relies heavily on the quality of standard curve fitting. In ELISA assays, the analyte concentration exhibits a typical sigmoidal dose response relationship with optical density (OD) values. Simple linear regression often cannot adequately model this relationship. Four Parameter Logistic (4 PL) regression is the mainstream approach for ELISA standard curve fitting.
The ELISA data calculation workflow is as follows:
1. Elabscience® recommends testing standards and samples in duplicates or triplicates, and calculating the average OD value for each standard and sample.
2. For sandwich ELISA, subtract the OD value of blank well from the average OD value to obtain corrected OD value. Blank subtraction is not required for competitive ELISA.
3. Plot standard concentrations on the X-axis and corrected OD values on the Y-axis, then fit the standard curve with the 4-PL model.
4. Calculate concentrations of test samples against the standard curve using corrected sample OD values. Substitute the corrected OD value of each sample into the fitted curve to get the calculated concentration. If samples are diluted before testing, the final concentration equals the calculated concentration multiplied by the dilution factor.
Following Elabscience® previous tutorial on ELISA data analysis using Origin software, this article demonstrates how to process ELISA data in GraphPad Prism. It further presents the workflow of the free Elabscience® ELISA Curve Fitting Calculation Tool, which offers a simpler alternative for 4 PL curve fitting and result computation.
Table of Contents
1. How to calculate ELISA results with GraphPad Prism
2. How to calculate ELISA results using the Elabscience® ELISA Curve Fitting Calculation Tool
3. Advantages of the Elabscience® ELISA Curve Fitting Calculation Tool
01 How to calculate ELISA results with GraphPad Prism
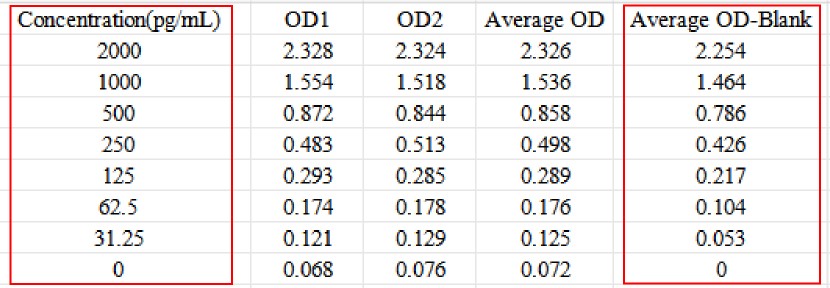
Step 1: Use Excel to calculate the average OD value for each concentration standard, subtract the OD value of the blank well, and obtain the corrected OD value. Please note that GraphPad Prism cannot automatically subtract the background. If you use data from duplicate wells for calculation, you need to subtract the background in advance to correct the values.
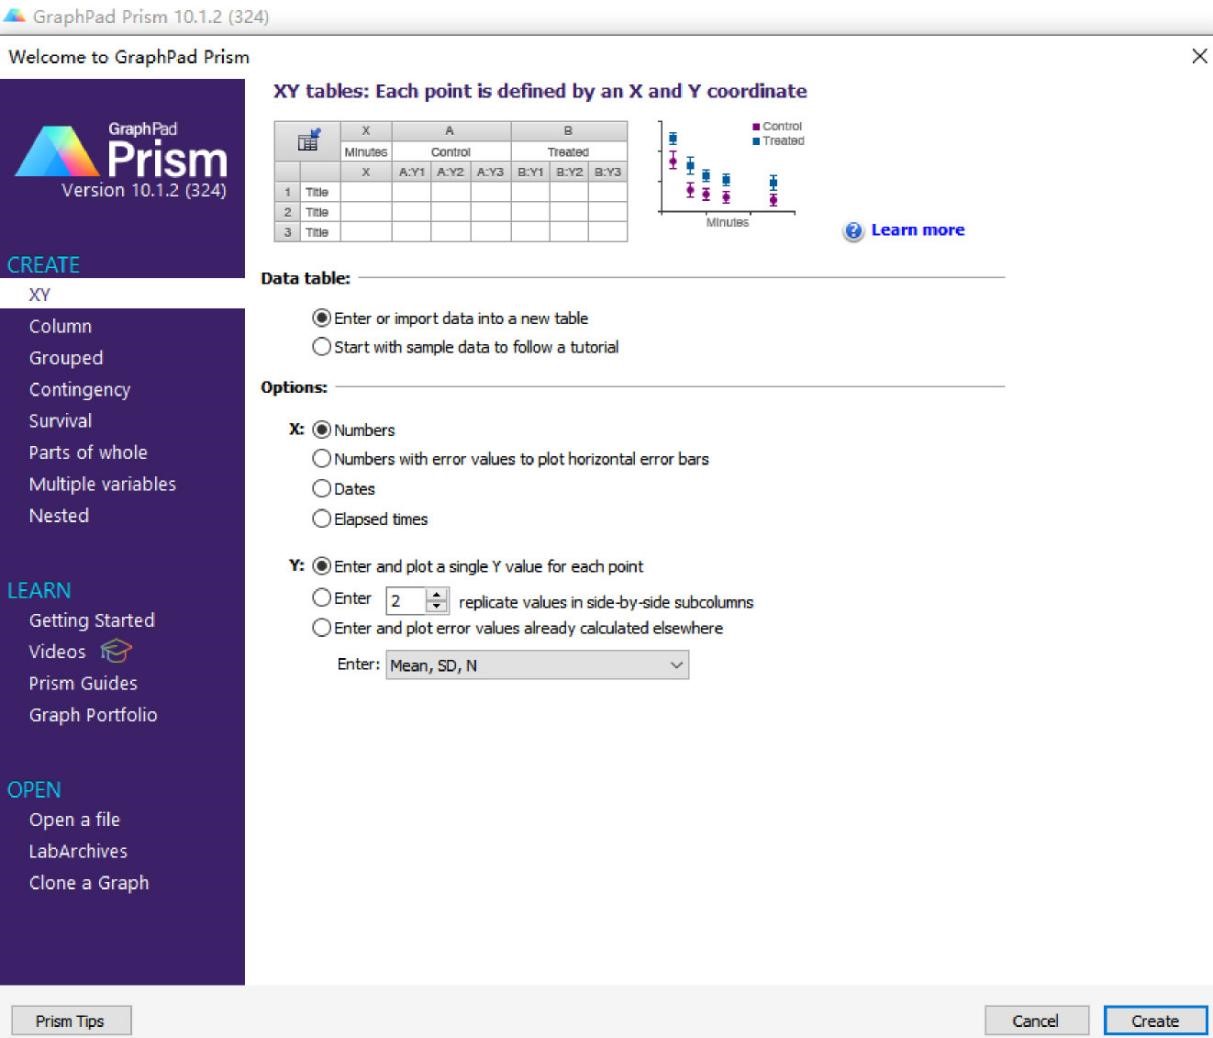
Step 2: Open GraphPad Prism, create a new XY data table, select the Y-value option based on the number of wells, and the click Create button.
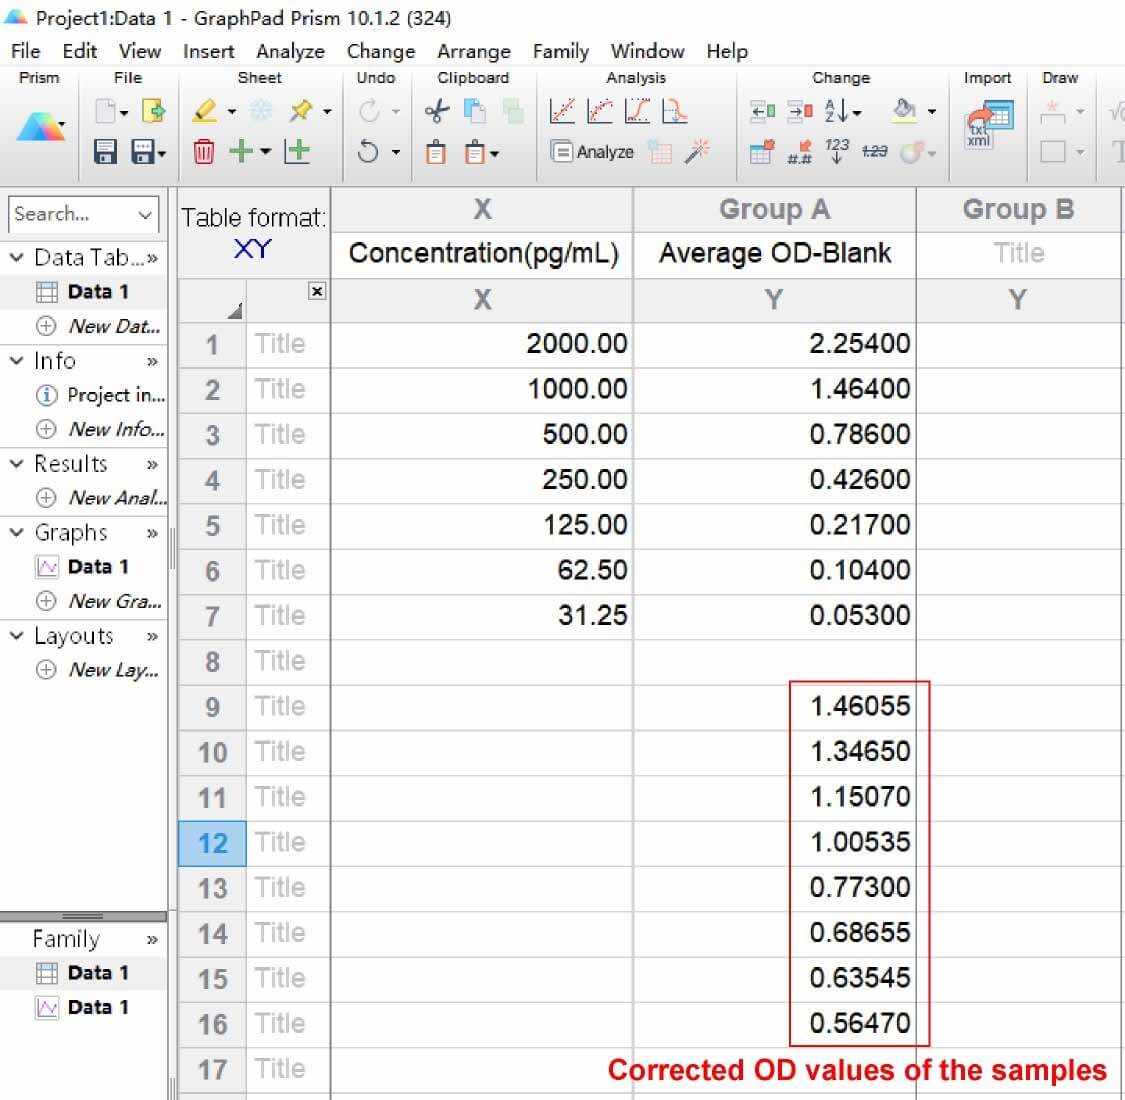
Step 3: Enter the concentrations of the standards in column X and the corresponding corrected OD values in column Y. Paste the corrected OD values for the samples below the standard data. Alternatively, you could first complete the standard curve fitting and then enter the corrected OD values for the samples. GraphPad Prism will automatically recalculate the sample concentrations.
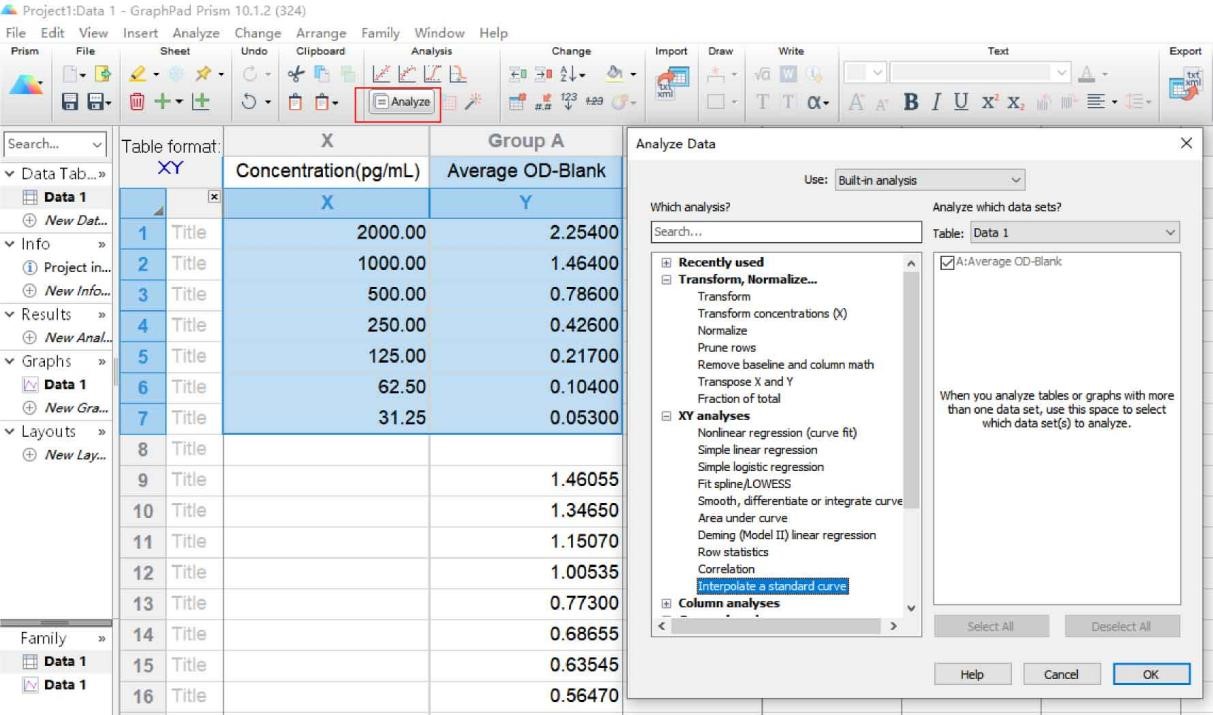
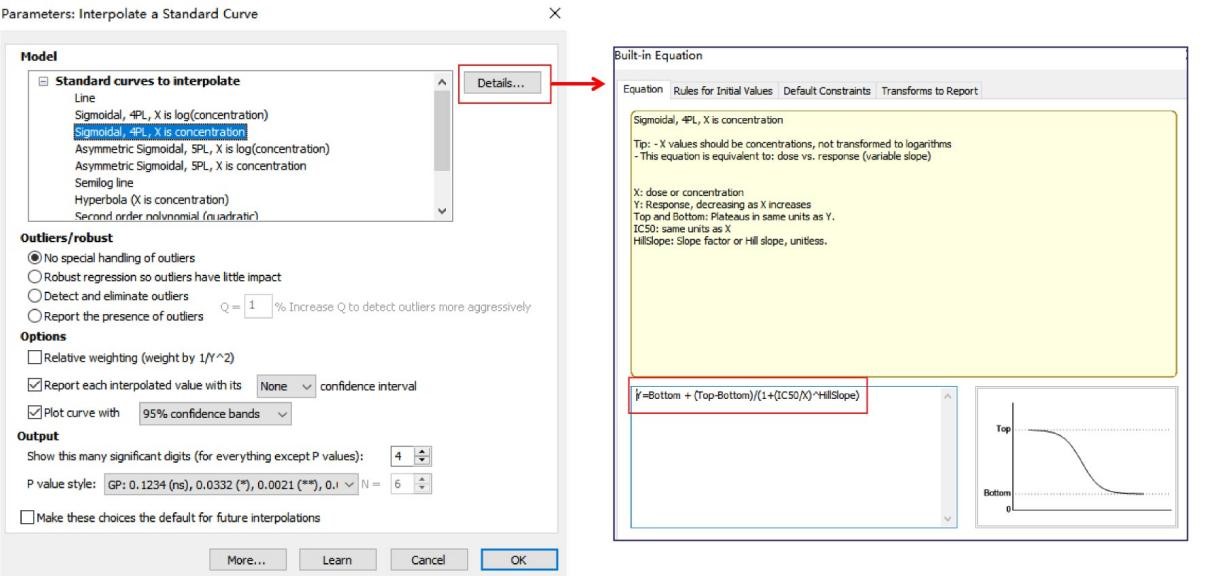
Step 4: Select the standard curve data, click Analysis, select Interpolate a standard curve, choose Sigmoidal, 4PL, X is concentration as the fitting model, and click the OK button. Click Model Details to view the 4-PL equation.
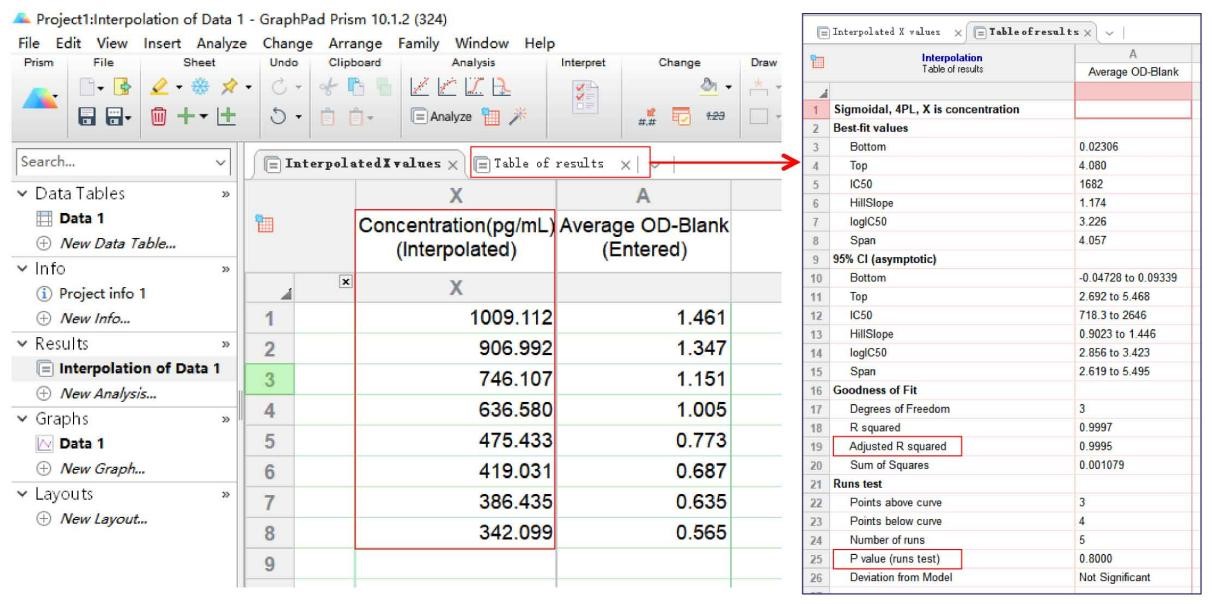
Step 5: Navigate to the fitting results. There are two tabs on the right: Interpolated X values and Table of Results. View the Table of Results and note the four key parameters: Bottom, Top, IC50, and HillSlope. Evaluate the fit quality using the adjusted R² and P-value (runs test). An adjusted R² ≥ 0.995 and a P-value > 0.05 from the runs test indicate that there is no significant deviation between the experimental data and the fitted model.
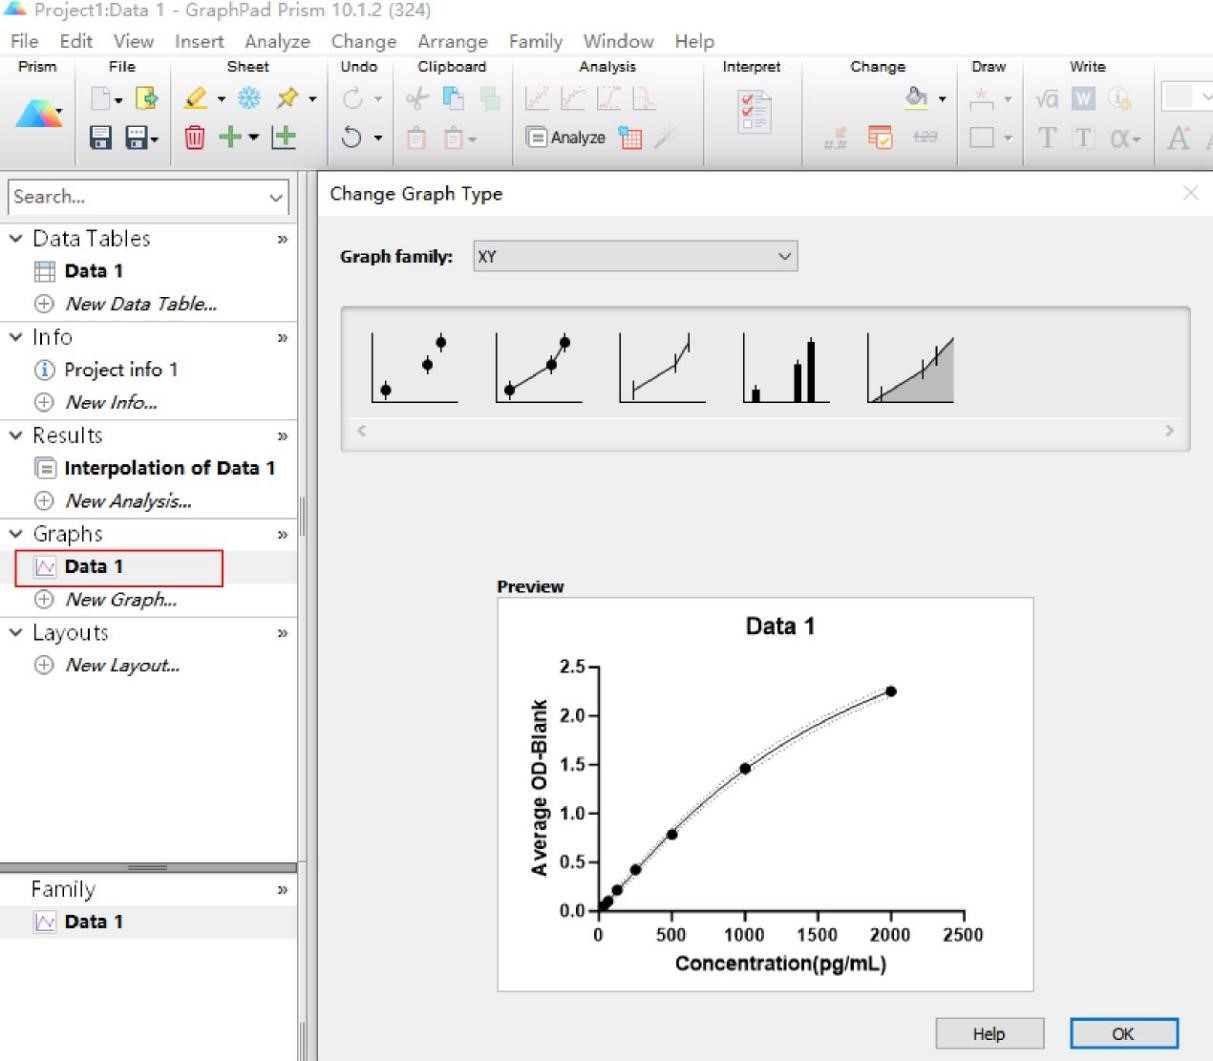
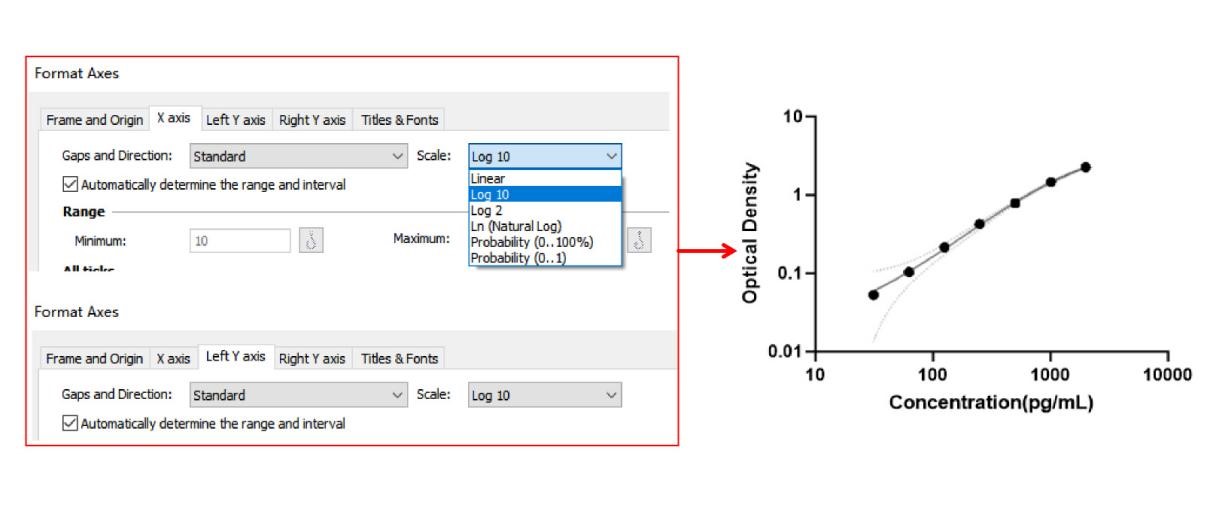
Step 6: Click the Graphs button on the left. Click OK to accept the default settings. Double-click the axes to set the X and Y axes to log 10, which provides a visual representation of the ELISA sigmoidal dose-response curve.
02 How to calculate ELISA results using the Elabscience® ELISA Curve Fitting Calculation Tool
Both Origin and GraphPad Prism deliver high-quality fitting results, but desktop software shares common drawbacks, including client installation requirements, licensing costs, and operational complexity.
To streamline your ELISA calculation workflows, you may utilize the free online Elabscience® ELISA Curve Fitting Calculation Tool. It employs the 4-PL fitting, which is identical to that used in Origin and GraphPad Prism.
Here are the quick steps:
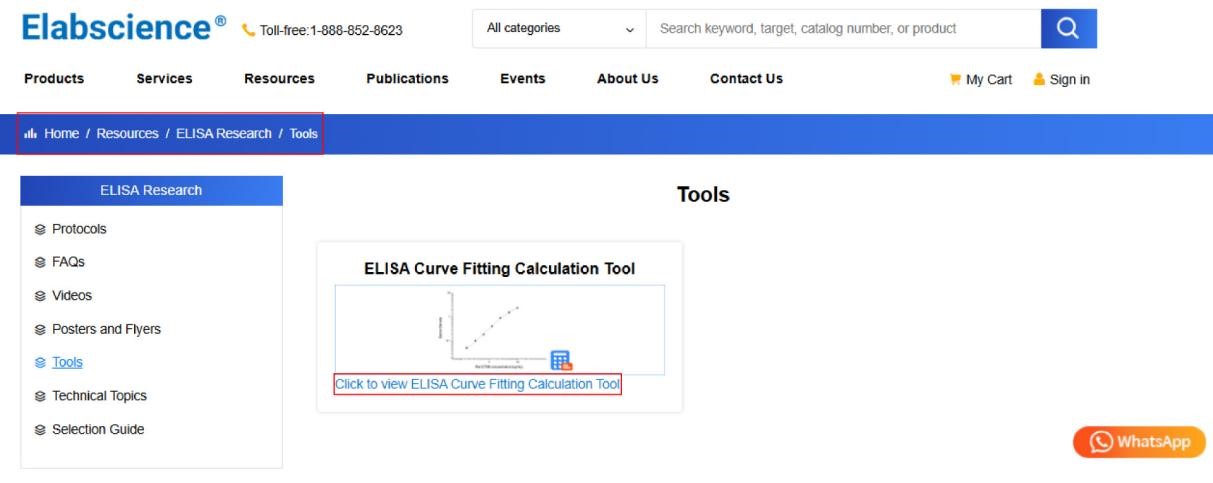
Step 1: Enter the Elabscience® website, find the ELISA Research button under Resources, click the Tools button, and then click the ELISA Curve Fitting Calculation Tool. Or access the Elabscience® ELISA Curve Fitting Calculation Tool instantly.
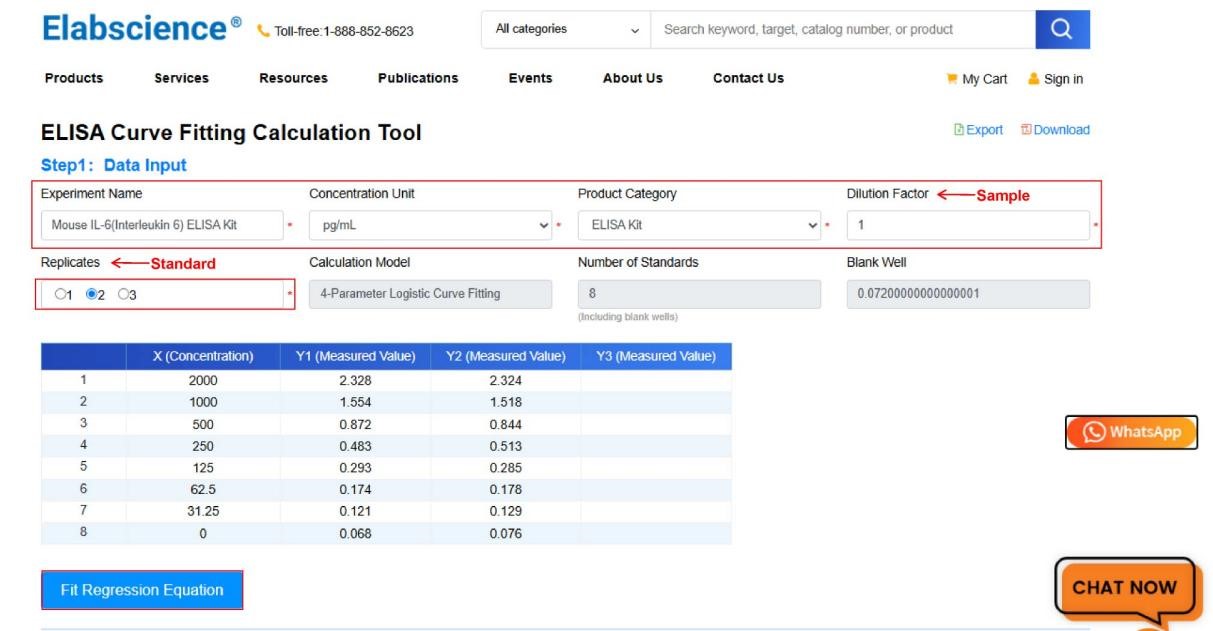
Step 2: Data Input: Enter the Experiment Name, Concentration Unit, Product Category, Dilution Factor (for samples), and Replicates (for standards). Paste the standard concentrations and OD values. This tool supports data entry for single-well, duplicate, and triplicate standards. It automatically calculates the Number of Standards and the Blank Well OD value. Click Fit Regression Equation button.
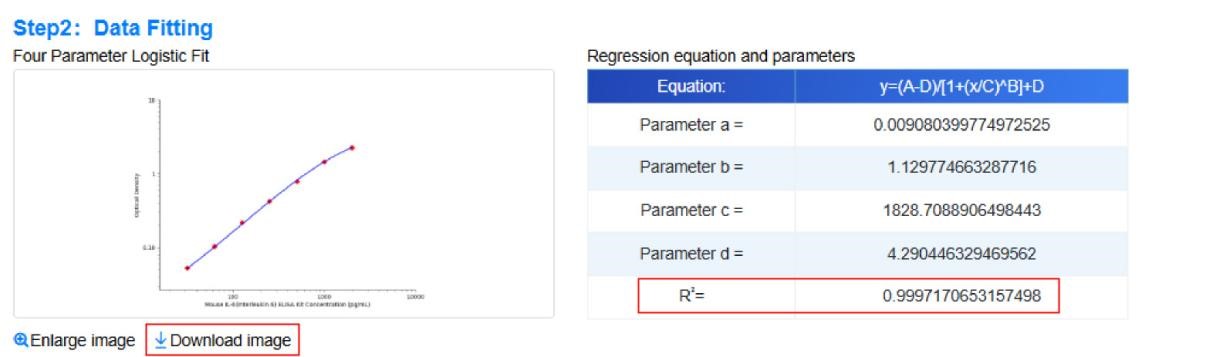
Step 3: Data Fitting: The tool automatically generates the standard curve and outputs the 4-PL equation, parameters, and R². The standard curve image can be exported with one click.
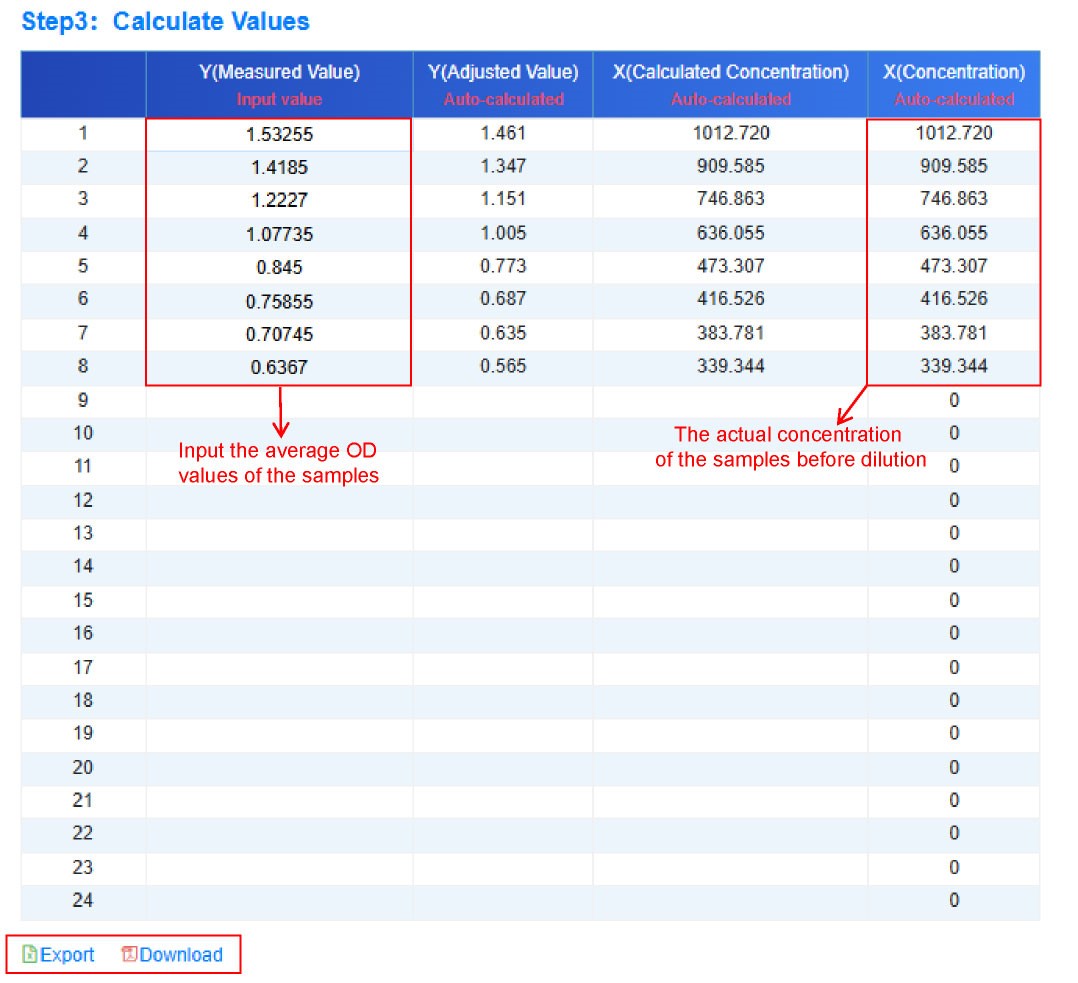
Step 4: Value Calculation: Input the average OD values of the samples to automatically perform blank correction. The system outputs the calculated concentration and the actual concentration of the samples before dilution. Complete calculation files can be downloaded directly.
03 Core advantages of the Elabscience® ELISA Curve Fitting Calculation Tool
(1) No client side download or software license is required. The tool is accessible via any web browser.
(2) Easy to operate. It includes blank correction and automatic dilution factor conversion, with no manual recalculation needed.
(3) Compatible with raw OD data processing for single-well, duplicate-well and triplicate-well standards.
(4) Standard curve plots, full fitting parameters and calculation files can be downloaded for experimental record keeping.
(5) The 4-PL fitting and parameters are aligned with professional desktop software Origin and GraphPad Prism.
Summary
The 4 PL standard curve fitting underpins reliable ELISA quantification. This article compares practical workflows for 4 PL fitting and result calculation using GraphPad Prism desktop software and the free Elabscience® ELISA Curve Fitting Calculation Tool. GraphPad Prism offers powerful functions yet requires a software license and involves complicated operations. Adopting the identical 4 PL algorithm, the Elabscience® ELISA Curve Fitting Calculation Tool is accessible directly via a web browser. It features automatic blank correction and dilution factor conversion, with one click export of plots and reports to streamline ELISA result calculation.
Further Reading
For step by step visual guidance on operating ELISA Curve Fitting Calculation Tool, please watch the Elabscience® tutorial video.

