Enzyme-linked immunosorbent assay (ELISA) is still among the most prevalent methods for quantifying protein biomarkers in serum, attributed to its high sensitivity, favorable specificity, and suitability for routine laboratory workflows. Nevertheless, the quality of ELISA measurements depends not only on commercial assay kits and operational proficiency but also heavily on the pre-analytical integrity and stability of serum specimens. ELISA sample preparation covers the full workflow from blood collection to specimen preservation, and a variety of confounding factors can alter the intrinsic levels of target analytes from blood collection to final detection, thereby generating inaccurate results and impairing assay reproducibility. Hemolysis, lipemia, biomarker degradation during prolonged storage, and complement activation arising from improper sample handling represent common yet often overlooked sources of experimental error. Such issues pose substantial challenges to translational research, large-scale biobanking initiatives and longitudinal cohort studies, where consistent sample quality across different time points and processing conditions is indispensable.
This article reviews the optimal centrifugation protocols for preventing hemolysis in serum collection, compares the impact of storage at −20°C versus −80°C on ELISA detection of cytokines, explains the mechanistic pathways by which hemolysis interferes with ELISA signal accuracy, evaluates whether lipemia or high fat content compromises ELISA readouts, examines how long-term storage conditions contribute to biomarker drift in biobanked serum, and addresses whether complement activation during sample handling can affect ELISA accuracy.
Table of Contents
1. What is the optimal centrifugation protocol to prevent hemolysis in serum collection?
2. Does storage at −20°C vs −80°C impact ELISA detection of cytokines?
3. How does hemolysis interfere with ELISA signal accuracy?
4. Does lipemia or high fat content interfere with ELISA readouts?
5. How do long-term storage conditions affect biomarker drift in biobanked serum?
6. Can serum complement activation during handling affect ELISA accuracy?
01 What is the optimal centrifugation protocol to prevent hemolysis in serum collection?
Systematic investigations specifically exploring the impacts of centrifugation conditions on hemolysis occurrence during serum isolation remain scarce in laboratory research. In practical labs, serum elisa relies heavily on standardized pre-treatment steps, and centrifugation serum is regarded as the core step to obtain qualified specimens. Nevertheless, existing evidence strongly supports that non-standard centrifugation protocols constitute a major cause of in vitro hemolysis. In particular, extended centrifugation duration, excessive centrifugal force-induced shear stress, repeated centrifugation operations, and incomplete formation of gel separator barriers can all trigger or aggravate serum hemolysis[1,2]. To standardize centrifugation workflows and mitigate hemolysis risks, the following operational strategies are proposed. First, centrifugation should be performed in accordance with the manufacturer’s guidelines, with a conventional speed of 1500–2000 g and duration of 10–15 min, and ultra-high speed or overlong centrifugation procedures should be avoided. Second, sufficient blood clot formation must be ensured prior to the centrifugation of serum tubes. This step is particularly critical for specimens from patients receiving anticoagulant therapy, as incomplete clotting can lead to cellular damage[1]. Third, re-centrifugation of gel-barrier serum tubes is prohibited, given that this operation may disrupt the gel isolation layer and cause red blood cell contamination of serum supernatants[1]. Fourth, for samples delivered via pneumatic tube systems, mechanical trauma before centrifugation should be minimized, and stable temperature conditions during centrifugation should be strictly maintained[2]. Additionally, previous studies have highlighted that each laboratory should independently validate the applicability of centrifugation parameters based on its specific instrumental conditions and study population, and conduct regular sample monitoring to identify potential hemolysis events. In conclusion, standardized control of centrifugation speed and duration, prohibition of repeated centrifugation, and standardized manipulation of gel-barrier tubes are the core prerequisites for optimizing serum centrifugation protocols and effectively reducing hemolysis risk.
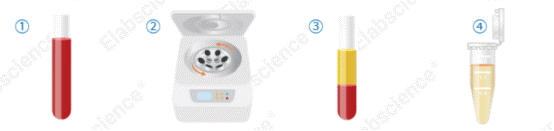
Fig. 1 Elabscience® serum sample processing procedure.
① Allow blood to clot at room temperature for 1 h or at 2–8°C overnight. ② Centrifuge at 1000 × g for 20 min at 2–8°C. ③ Serum separates into distinct layers after centrifugation. ④ Carefully collect the upper clear supernatant (serum).
02 Does storage at −20°C vs −80°C impact ELISA detection of cytokines?
Accumulating evidence has demonstrated that storage temperature is a critical determinant of cytokine stability during ELISA quantification. After specimen separation, serum sample storage becomes the key link to maintain analyte activity, and serum sample storage temperature directly decides the duration of valid preservation. Consensus from existing studies on long-term frozen sample preservation recommends −80 °C as the optimal standard condition for cytokine retention. For instance, researchers established reference ranges for 27 cytokines in healthy populations using EDTA plasma specimens stored at −80 °C post centrifugation, and validated robust stability of these cytokines under such storage condition[3]. Their findings also confirmed that plasma samples tolerate a maximum of three freeze–thaw cycles without substantial alterations to the levels of most cytokines. Further research corroborated that the majority of cytokines remain stable for up to two years at −80 °C. Nevertheless, partial cytokine degradation can occur as early as after one year of storage, with an annual concentration loss of approximately 10%–20%[4]. Notably, repeated freeze–thaw cycles, even at −80 °C, markedly reduce the recovery efficiency of specific cytokines.In comparison, limited data are available regarding the long-term stability of cytokines stored at −20 °C. It is widely acknowledged that −20 °C storage fails to effectively inhibit persistent protein degradation and residual enzymatic activity. In a related study, it preserved isolated serum and plasma samples at −70 °C for subsequent cytokine analysis and proposed that unseparated whole blood should be temporarily stored at 4 °C rather than frozen when sample processing is delayed[5]. This observation indirectly supports the inadequacy of relatively high freezing temperatures (e.g., −20 °C) for long-term sample preservation. In the absence of head-to-head comparative experiments, current empirical evidence strongly suggests that −80 °C is the preferred temperature for the long-term storage of specimens intended for ELISA-based cytokine detection. By contrast, −20 °C storage accelerates signal attenuation and increases experimental variability, making it unsuitable for the long-term preservation of key experimental samples.
03 How does hemolysis interfere with ELISA signal accuracy?
Hemolysis impairs the accuracy of ELISA measurements via multiple distinct mechanisms. Researchers must pay close attention to hemolysis serum samples since they will produce unreliable test results. First, hemoglobin (Hb) induces direct spectrophotometric interference owing to its broad absorbance spectrum ranging from 340 to 570 nm, which overlaps with the detection wavelengths of widely used ELISA chromogenic substrates, including OPD and TMB[6]. Second, Hb exhibits inherent peroxidase-like catalytic activity. In the presence of hydrogen peroxide, Hb can functionally substitute for horseradish peroxidase (HRP), oxidizing chromogenic substrates to generate false-positive signals independent of target analytes. Notably, significant interference can be triggered by Hb concentrations as low as 1 mg/mL[7]. Third, hemolysis may lead to false-negative outcomes by promoting Hb-mediated analyte degradation. A typical example is the dissociation of TNF trimers into monomers with substantially reduced immunoreactivity[7]. Fourth, Hb can elicit non-specific cross-reactivity with capture and detection antibodies, acting as a pseudo-analyte to disrupt specific antigen–antibody binding. Of note, although prominent analytical interference generally occurs at Hb concentrations of 1 mg/mL or higher, mild hemolysis with free Hb levels as low as 20 mg/L can also introduce measurable biases. Collectively, hemolysis compromises ELISA performance through concentration-dependent spectrophotometric distortion, aberrant enzymatic catalysis, analyte degradation, and non-specific antibody cross-reactivity. Therefore, even mildly hemolyzed samples should be treated with caution in ELISA-based quantitative analysis.
04 Does lipemia or high fat content interfere with ELISA readouts?
Lipemic interference on ELISA readouts is predominantly driven by light scattering induced by chylomicrons and very-low-density lipoprotein (VLDL) particles. Laboratories need to screen out lipemic serum sample before conducting formal detection, as this phenomenon elevates background absorbance and may produce spuriously increased or decreased measurements, with outcomes varying substantially across assay platforms[8,9]. Notably, synthetic lipid emulsions (e.g., Intralipid) fail to fully recapitulate the characteristics of naturally lipemic specimens due to discrepancies in particle size and refractive index. Accordingly, studies relying exclusively on artificial lipid models may underestimate the true magnitude of lipemic interference[8,10].
The disruptive effects of lipemia on antigen–antibody binding are highly assay- and matrix-dependent. It demonstrated that triglyceride concentrations up to 1000 mg/dL did not markedly interfere with equine insulin detection via fluorescence enzyme immunoassay (FEIA) or lateral flow assay (LFA)[10]. However, the same triglyceride level induced substantial negative bias in insulin ELISA when applied to plasma rather than serum samples, indicating that fibrinogen–lipid interactions may hinder specific antibody binding. In contrast, it reported that lipemia can generate falsely elevated signals through non-specific bridging effects in two-site immunoassays[9]. Consistent with this finding, Saracevic et al. (cited in Caruso et al., 2020) observed pronounced quantification biases of 33.8% for resistin and 12.2% for myeloperoxidase at a triglyceride concentration of approximately 413 mg/dL. Beyond light scattering, modified sample viscosity, altered particle distribution, and physical blockade of antigen–antibody interactions also constitute critical contributors to lipemic assay distortion[8,9]. Several practical strategies are recommended to mitigate lipemic interference. These include conducting validation experiments using naturally lipemic samples, eliminating lipid contaminants via sample dilution or ultracentrifugation, and adopting alternative detection platforms (e.g., FEIA, LFA, mass spectrometry) with higher resistance to lipid-induced bias. For ELISA applications specifically, plasma specimens from lipemic individuals should be used cautiously or avoided if matrix-specific interference is confirmed. In conclusion, lipemia impairs ELISA accuracy in a concentration-, assay-, and matrix-dependent manner. These findings highlight the necessity of rigorous analytical validation using authentic lipemic samples to ensure reliable immunoassay results.
05 How do long-term storage conditions affect biomarker drift in biobanked serum?
Long-term cryogenic storage of serum at ultra-low temperatures (−80°C to ≤ −70°C) can trigger systematic, time-dependent alterations in a subset of circulating biomarkers, whereas other analytes remain biochemically stable over years or even decades. Empirical evidence has demonstrated that prolonged storage at −70°C to −80°C for 6–15 years leads to significant reductions in the levels of aspartate aminotransferase (AST), total cholesterol, estradiol, glucose, high-density lipoprotein (HDL) cholesterol, luteinizing hormone (LH), total protein, triglycerides, alanine aminotransferase (ALT), creatinine, magnesium, potassium, sodium, total bilirubin, and urate. whereas lactate dehydrogenase (LDH) and sex hormone-binding globulin (SHBG) were markedly elevated[11,12]. Storage duration alone accounted for up to 35% of the variance in specific proteins, with an effect magnitude equivalent to that of chronological age[13]. In contrast, analytes including C-reactive protein (CRP), carcinoembryonic antigen (CEA), prostate-specific antigen (PSA), free thyroxine (free T4), as well as cerebrospinal fluid Aβ₁₋₄₂, total tau (T-tau) and phosphorylated tau (P-tau) remained stable with no statistically significant alterations after 12 to 15 years of storage at −80°C when all samples were tested in a single analytical batch[12,14].This drift arises from storage-related preanalytical variation rather than analytical imprecision. Thus, the storage-derived preanalytical coefficient (CVₚ) is suggested for reference change value calculations when comparing fresh and frozen samples. Temperatures of 4°C or −20°C cause substantial biomarker alterations within 90 days, whereas −80°C and below is optimal for long-term preservation[15]. Repeated temperature fluctuations also produce no extra variability relative to stable storage below −75°C[16].To reduce confounding, researchers using biobanked serum should assess storage-induced drift of target analytes, perform batch remeasurement to exclude assay bias, and adjust for storage time as a covariate in statistical analyses.
06 Can serum complement activation during handling affect ELISA accuracy?
Serum complement activation during sample handling severely impairs ELISA performance, as suboptimal preanalytical conditions yield artificial activation products and bias detection results. Complement is readily activated ex vivo during coagulation and prolonged sample processing, generating fragments including C3a, C5a, Bb and sC5b-9 that deviate from physiological in vivo levels[17,18]. Serum is not ideal for quantifying individual complement proteins, given persistent uncontrolled activation during clotting and storage. In contrast, EDTA plasma (≥10 mM) chelates Ca²⁺ and Mg²⁺ to efficiently inhibit complement activation[18,19]. Experimental data show that C3c levels in serum rise over twofold after 2 hours of room-temperature incubation, whereas EDTA plasma maintains stable C3c concentrations. Ex vivo complement activation is further aggravated by improper operations, such as delayed centrifugation, storage at −20°C (instead of −80°C) and repeated freeze-thaw cycles. A systematic review reported that 27% of relevant studies adopted inappropriate specimens (mostly serum) for complement quantification, and another 24% failed to clarify sample types, suggesting a high risk of artifactual findings. For reliable ELISA measurements, blood samples should be collected using EDTA anticoagulant tubes, processed within 60 minutes at 4°C and stored at −80°C. Serum is only recommended for functional assays targeting complement activation, rather than quantitative analysis of separate complement components.
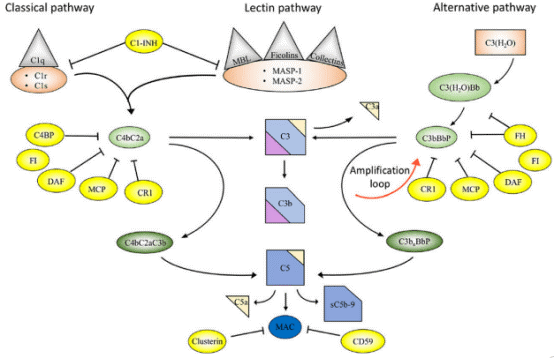
Fig. 2 Overview of the complement system. Activation and regulation of the complement system. The complement system can be activated by three different pathways: the classical (CP), lectin (LP), and alternative pathways (AP). Recognition molecules within the three pathways bind to structures present on pathogens, and then activate the serine proteases C1r and C1s of the CP and MASP-1, MASP-2 of the LP, respectively. These proteases initiate the assembly of the CP/LP C3 convertase (C4bC2a) while formation of the AP C3 convertase (C3bBbP) is initiated either by hydrolysis of C3 to C3(H2O) or by other mechanisms. The convertases cleave C3 to the opsonin C3b and the anaphylatoxin C3a. Subsequent action of the C5 convertases generates the anaphylatoxin C5a and initiates the assembly of the C5b-9 complex. Complement activation is under strict control of a number of membrane-bound and fluid phase inhibitors, the majority of which control the activity of the convertases. These include (but are not restricted to) C4b-binding protein (C4BP), decay acceleration factor (DAF), membrane cofactor protein (MCP), and complement receptor 1 (CR1), factor H (FH), and factor I (FI). In addition, formation of the C5b-9 complex is under control of CD59 and clusterin, while the CP and LP serine proteases are inhibited by C1 - inhibitor (C1-INH). Color coding: recognition molecules: gray triangles; initiators serine proteases and C3(H2O): orange symbols; convertases: green ovals; inhibitors: bright yellow ovals; anaphylatoxins: dim yellow triangles[17].
In summary, ELISA is a widely adopted technique for detecting protein biomarkers in serum, yet its measurements are profoundly influenced by multiple preanalytical variables, namely hemolysis, lipemia, storage-related biomarker drift and ex vivo complement activation. Hemolysis can be effectively prevented by using centrifugation at 1500–2000 g for 10–15 min, ensuring complete clot formation and avoiding repeated centrifugation. It interferes with ELISA performance through spectral interference, pseudo-enzymatic activity, analyte degradation and non-specific antibody cross-reactivity. Lipemia elevates assay background and distorts results via light scattering and physical obstruction of antigen–antibody interactions, with its effects differing across assay platforms and sample matrices. For long-term preservation of cytokines and other biomarkers, −80°C is the optimal storage temperature, whereas storage at −20°C accelerates analyte degradation and signal fluctuations. Notably, prolonged ultra-low temperature storage also induces time-dependent concentration shifts in numerous biomarkers. Furthermore, ex vivo complement activation in serum during handling compromises detection accuracy. To ensure reliable ELISA results, EDTA plasma instead of serum is recommended for quantifying complement components, combined with timely sample processing and standard low-temperature storage protocols.
Elabscience® Quick Overview of Popular Products:
Table 1. Research Tools for biomarkers
|
Cat. No. |
Product Name |
|
E-EL-H0043 |
Human CRP(C-Reactive Protein) ELISA Kit |
|
E-EL-0122 |
fT4(Free Thyroxine) ELISA Kit |
|
E-EL-H0109 |
Human TNF-α(Tumor Necrosis Factor Alpha) ELISA Kit |
|
E-EL-H0415 |
Human HB(Hemoglobin) ELISA Kit |
|
E-EL-H1213 |
Human RETN(Resistin) ELISA Kit |
|
E-EL-H2455 |
Human VLDL(Very Low Density Lipoprotein) ELISA Kit |
|
E-EL-H2665 |
Human INS(Insulin) ELISA Kit |
|
E-EL-H6019 |
Human LH(Luteinizing Hormone) ELISA Kit |
|
E-EL-H6244 |
Human MPO(Myeloperoxidase) ELISA Kit |
|
E-OSEL-H0016 |
QuicKey Pro Human CEA(Carcinoembryonic Antigen) ELISA Kit |
References:
[1] Lippi, G., Blanckaert, N., Bonini, P., Green, S., Kitchen, S., Palicka, V., Vassault, A. J., & Plebani, M. (2008). Haemolysis: an overview of the leading cause of unsuitable specimens in clinical laboratories. Clinical chemistry and laboratory medicine, 46(6), 764–772. https://doi.org/10.1515/CCLM.2008.170
[2] Heireman, L., Van Geel, P., Musger, L., Heylen, E., Uyttenbroeck, W., & Mahieu, B. (2017). Causes, consequences and management of sample hemolysis in the clinical laboratory. Clinical biochemistry, 50(18), 1317–1322. https://doi.org/10.1016/j.clinbiochem.2017.09.013.
[3] Hennø, L. T., Storjord, E., Christiansen, D., Bergseth, G., Ludviksen, J. K., Fure, H., Barene, S., Nielsen, E. W., Mollnes, T. E., & Brekke, O. L. (2017). Effect of the anticoagulant, storage time and temperature of blood samples on the concentrations of 27 multiplex assayed cytokines - Consequences for defining reference values in healthy humans. Cytokine, 97, 86–95. https://doi.org/10.1016/j.cyto.2017.05.014
[4] Keustermans, G. C., Hoeks, S. B., Meerding, J. M., Prakken, B. J., & de Jager, W. (2013). Cytokine assays: an assessment of the preparation and treatment of blood and tissue. samples. Methods (San Diego, Calif.), 61(1), 10–17. https://doi.org/10.1016/j.ymeth.2013.04.005
[5] Aziz, N., Detels, R., Quint, J. J., Li, Q., Gjertson, D., & Butch, A. W. (2016). Stability of cytokines, chemokines and soluble activation markers in unprocessed blood stored under different conditions. Cytokine, 84, 17–24. https://doi.org/10.1016/j.cyto.2016.05.010
[6] Datta, Pradip. "Effect of Hemolysis, High Bilirubin, Lipemia, Paraproteins, and System Factors on Therapeutic Drug Monitoring." Handbook of Drug Monitoring Methods: Therapeutics and Drugs of Abuse. Totowa, NJ: Humana Press, 2008. 97-109.
[7] Simoni, J., Simoni, G., Lox, C. D., Prien, S. D., & Shires, G. T. (1995). Hemoglobin interference with an enzyme-linked immunosorbent assay for the detection of tumor necrosis factor-alpha. Analytica chimica acta, 313(1-2), 1-14.
[8] Kroll M. H. (2004). Evaluating interference caused by lipemia. Clinical chemistry, 50(11), 1968–1969. https://doi.org/10.1373/clinchem.2004.038075
[9] Caruso, B., Bovo, C., & Guidi, G. C. (2020). Causes of Preanalytical Interferences on Laboratory Immunoassays - A Critical Review. EJIFCC, 31(1), 70–84.
[10] Hallowell, K. L., van Eps, A. W., Kulp, J. C., & Schnabel, L. V. (2026). The Effect of Lipemia on Insulin and Adiponectin Measurement in Equine Blood Samples. Veterinary clinical pathology, 10.1111/vcp.70100. Advance online publication. https://doi.org/10.1111/vcp.70100
[11] Kleeberger, C., Shore, D., Gunter, E., Sandler, D. P., & Weinberg, C. R. (2018). The Effects of Long-term Storage on Commonly Measured Serum Analyte Levels. Epidemiology (Cambridge, Mass.), 29(3), 448–452. https://doi.org/10.1097/EDE.0000000000000810
[12] Alegre, E., Varo, N., Fernández-Calle, P., Calleja, S., & González, Á. (2022). Impact of ultra-low temperature long-term storage on the preanalytical variability of twenty-one common biochemical analytes. Clinical chemistry and laboratory medicine, 60(7), 1003–1010. https://doi.org/10.1515/cclm-2022-0063
[13] Enroth, S., Hallmans, G., Grankvist, K., & Gyllensten, U. (2016). Effects of Long-Term Storage Time and Original Sampling Month on Biobank Plasma Protein Concentrations. EBioMedicine, 12, 309–314. https://doi.org/10.1016/j.ebiom.2016.08.038
[14] Willemse, E. A. J., van Uffelen, K. W. J., van der Flier, W. M., & Teunissen, C. E. (2017). Effect of long-term storage in biobanks on cerebrospinal fluid biomarker Aβ1-42, T-tau, and P-tau values. Alzheimer's & dementia (Amsterdam, Netherlands), 8, 45–50. https://doi.org/10.1016/j.dadm.2017.03.005
[15] Zander, J., Bruegel, M., Kleinhempel, A., Becker, S., Petros, S., Kortz, L., Dorow, J., Kratzsch, J., Baber, R., Ceglarek, U., Thiery, J., & Teupser, D. (2014). Effect of biobanking conditions on short-term stability of biomarkers in human serum and plasma. Clinical chemistry and laboratory medicine, 52(5), 629–639. https://doi.org/10.1515/cclm-2013-0705
[16] Haslacher, H., Szekeres, T., Gerner, M., Ponweiser, E., Repl, M., Wagner, O. F., & Perkmann, T. (2017). The effect of storage temperature fluctuations on the stability of biochemical analytes in blood serum. Clinical chemistry and laboratory medicine, 55(7), 974–983. https://doi.org/10.1515/cclm-2016-0608
[17] Ekdahl, K. N., Persson, B., Mohlin, C., Sandholm, K., Skattum, L., & Nilsson, B. (2018). Interpretation of Serological Complement Biomarkers in Disease. Frontiers in immunology, 9, 2237. https://doi.org/10.3389/fimmu.2018.02237
[18] Brandwijk, R. J. M. G. E., Michels, M. A. H. M., van Rossum, M., de Nooijer, A. H., Nilsson, P. H., de Bruin, W. C. C., & Toonen, E. J. M. (2022). Pitfalls in complement analysis: A systematic literature review of assessing complement activation. Frontiers in immunology, 13, 1007102. https://doi.org/10.3389/fimmu.2022.1007102
[19] Thurman, J. M., & Fremeaux-Bacchi, V. (2023). Alternative pathway diagnostics. Immunological reviews, 313(1), 225–238. https://doi.org/10.1111/imr.13156

