

Cytokines orchestrate every phase of the immune response, from innate activation through adaptive memory, and their measurement underpins vaccine evaluation, immunotherapy monitoring and diagnostic development. Two immunoassay families dominate this space: the enzyme-linked immunospot (ELISpot) assay, which enumerates individual secreting cells as countable spots, and the enzyme-linked immunosorbent assay (ELISA), which quantifies soluble mediator concentrations in bulk samples. Although both rely on antibody capture, they answer different biological questions, differ markedly in sensitivity for rare responders, and diverge in throughput, sample requirements and multiplexing capacity, so selecting the wrong platform can obscure exactly the response a study was designed to detect.
This review article compares ELISpot and ELISA across five practical dimensions: their measurement principles for cytokine detection, single-cell secretion analysis, sensitivity for low-frequency responses, paired readouts for antigen-specific T cells, and multiplex extensions. Each section draws on peer-reviewed method comparisons and application studies to give actionable guidance on when to count cells, when to measure concentrations, and when to combine both.
Table of Contents
1. ELISpot versus ELISA for cytokine detection
2. Single-cell cytokine secretion measured by ELISpot
3. ELISpot sensitivity for low-frequency immune responses
4. ELISpot and ELISA readouts for antigen-specific T cells
5. Multiplex cytokine detection with ELISpot and ELISA platforms
6. Key takeaways
7. Related Resources
01 ELISpot versus ELISA for cytokine detection
The elispot vs elisa comparison starts from a fundamental difference in what each platform measures. In the enzyme-linked immunospot (ELISpot) assay, a 96-well plate fitted with a nitrocellulose or polyvinylidene difluoride (PVDF) membrane is coated with a capture antibody directed against the analyte of interest; cells and stimulants are added, secreted product is captured in the immediate vicinity of each producing cell, and after cell removal a biotinylated secondary antibody, an avidin-enzyme complex and a precipitating substrate reveal one spot per secreting cell[1]. The most frequently studied analytes are cytokines such as interferon gamma (IFN-gamma), interleukin 2 (IL-2), IL-5, IL-10, IL-17, tumor necrosis factor (TNF) and granulocyte-macrophage colony-stimulating factor (GM-CSF), alongside immunoglobulins and chemokines such as C-X-C motif chemokine ligand 8 (CXCL8)[1]. Enzyme-linked immunosorbent assay (ELISA), by contrast, quantifies the accumulated concentration of an analyte in a bulk sample such as a culture supernatant or serum, most rigorously in the sandwich format with matched capture and detection antibodies[2,3]. When the two principles were tested head to head on the same specimens, a panel of nine cytokines (IL-1beta, IL-4, IL-5, IL-6, IL-10, IL-12p70, IL-13, IFN-gamma and TNF-alpha) measured by commercial sandwich ELISA kits and by a multiplex bead platform in 96 clinical culture supernatants showed excellent correlations (Pearson r approximately 0.81 to 0.94) for seven of the nine analytes, whereas IL-12p70 and IL-13 correlated poorly, showing that platform agreement is analyte dependent and must be validated per target rather than assumed[3]. Format choice within ELISA itself matters: sandwich ELISA followed the theoretical 50 percent signal reduction per twofold antigen dilution with a wider regression range (coefficient of determination R2 above 0.99) and better run-to-run reproducibility than antigen-immobilized ELISA[2]. Practically, ELISpot answers "how many cells secrete," while ELISA answers "how much mediator is present," and the two readouts are complementary rather than interchangeable[1,3].
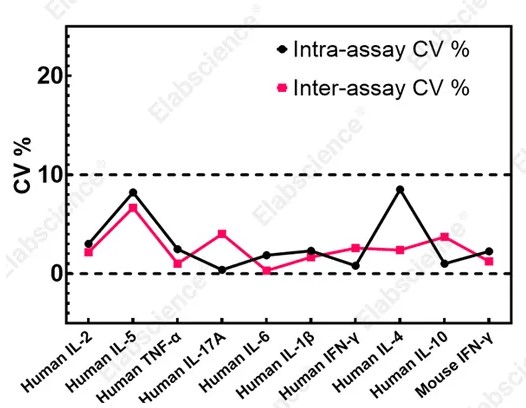
Fig. 1 The Evaluation of intra-assay and inter-assay precision of ELISpot for the detection of various analytes. (The data are provided by Elabscience®)
02 Single-cell cytokine secretion measured by ELISpot
The defining strength of the elispot assay is single-cell resolution: because secreted product is captured around the producing cell before diffusion, each spot corresponds to one cell that actually released the analyte during the incubation, and automated readers report spot counts per number of cells plated, typically per million peripheral blood mononuclear cells (PBMCs)[1]. This design makes the t cell elispot assay uniquely suited to enumerating rare antigen-specific cells, since it registers cells that truly secrete without interference from receptor-bound or protease-degraded mediator that can confound bulk measurements[1]. A direct clinical comparison illustrates the relationship between single-cell and phenotypic readouts: in 30 healthy adults, IFN-gamma-secreting cells enumerated by ELISPOT as spots per million PBMCs correlated strongly with cytokine-producing cells per million CD3-positive T cells measured by intracellular cytokine staining (ICS) flow cytometry after whole cytomegalovirus (CMV) lysate stimulation (r equal to 0.7677, p less than 0.0001) and after immediate-early 1 (IE1) peptide stimulation (r equal to 0.6516, p less than 0.0001), and CMV-specific T cells were detected in all 30 participants, including two seronegative individuals[4]. ELISpot is more effective at detecting weak global immune responses when assayed with low cell numbers and low detection thresholds. In contrast, intracellular cytokine staining (ICS) provides greater sensitivity for identifying cells with low-level secretory activity and permits phenotypic characterization of the responding cell population[4]. Quantitative information is not limited to counts: automated analysis also records spot size and staining intensity, each of which may correlate with the amount secreted per cell, and positivity can be defined by empirical rules such as more than 10 spots per well at threefold above background or by distribution-free resampling (DFR) statistics that accommodate the low replicate numbers typical of the assay[1]. Samples must be single-cell suspensions such as PBMCs or tumor-infiltrating lymphocytes (TILs), tested ex vivo or after validated freeze-thaw recovery, because whole blood is unsuitable and delayed processing impairs T cell functionality[1].
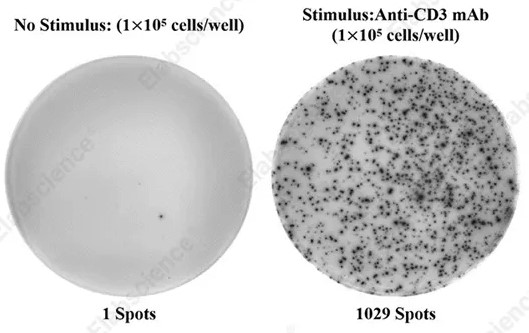
Fig. 2 PBMCs (1 × 10⁵ cells/well) were cultured for 20 h in the absence or presence of Anti-CD3 mAb (500 ng/mL), and the number of spots was enumerated as the number of human IFN-γ-secreting cells. (The data are provided by Elabscience®)
Assay Used for This Experiment:
Human IFN-γ (Interferon Gamma) ELISPOT Kit
Cat. No: ESP-H0002
Sample Type: Suspension cell samples
Detection Instrument: ELISPOT Reader
Explore the Human IFN-γ ELISPOT Kit →
03 ELISpot sensitivity for low-frequency immune responses
Sensitivity for rare responders is the historic hallmark of the ifn gamma elispot, which detects antigen-specific cells at very low frequencies by converting each local secretion event into one countable spot[1]. The elispot protocol therefore underpins diagnostic assays in which missing a low-frequency response has clinical consequences. In a cross-sectional study of 325 adults, including 150 patients with active tuberculosis (TB), an ELISPOT-based interferon-gamma release assay (IGRA), X-DOT-TB, reached 79.5 percent sensitivity, compared with 55.7 percent for the ELISA-based IGRA QuantiFERON-TB Gold Plus (QFT-Plus) and 35.8 percent for the tuberculin skin test (TST), while specificities were comparable at 85.1, 78.1 and 82.2 percent, respectively, supporting IGRA, particularly the ELISPOT format, as an adjunct diagnostic in bacillus Calmette-Guerin (BCG)-vaccinated populations[5]. The same sensitivity advantage appears in immune monitoring: ELISPOT detected CMV-specific T cells in 100 percent of 30 healthy participants, including two seronegative donors, consistent with its ability to reveal low-level IFN-gamma secretion that bulk or phenotypic assays can miss[4]. Reliable calling of such rare events requires disciplined controls: each stimulus is compared against unstimulated or negative-control wells, positivity follows preset empirical thresholds or DFR-based statistical testing, and the only functional immune monitoring assay with an open proficiency panel program is ELISPOT, whose performance can be standardized, qualified and validated under International Council for Harmonisation (ICH) guidelines[1]. Sample handling sets the floor for sensitivity: PBMCs should be isolated within hours since granulocyte activation in stored whole blood suppresses T cell functionality, with overnight resting of thawed cells improving spot recovery[1]. Together, these data position ELISPOT as the preferred format when the biological question involves low-frequency responders, while ELISA-based readouts remain appropriate for quantifying abundant soluble mediator[1,4,5].
04 ELISpot and ELISA readouts for antigen-specific T cells
Antigen-specific T cell studies benefit from pairing a frequency readout with a bulk cytokine assay, because the elispot assay procedure counts responding cells while ELISA reports the total soluble output of the culture. A Crimean-Congo hemorrhagic fever virus (CCHFV) vaccine program exemplifies this dual strategy: four replication-deficient human adenovirus serotype 5 (AdV5) vectors, including a dual-antigen nucleoprotein (NP)-P2A-glycoprotein (Gc) construct, were tested in BALB/c mice with priming on day 0 and boosting on day 28, and immunity was characterized by ELISA, virus neutralization, cytokine profiling, ELISPOT and flow cytometry before a lethal challenge of 1000 median tissue culture infectious doses (TCID50) on day 42[6]. ELISA documented rapid seroconversion in 75% to 100% of animals after a single priming dose. Virus neutralization assays measured neutralizing titers of 80 to 160 arbitrary units in high responders, but these titers did not directly correlate with survival, whereas ELISPOT revealed Th1-polarized cellular immunity with IFN-gamma production more than 30-fold above baseline and flow cytometry showed preferential expansion of CD4-positive helper T cells to 60 to 70 percent of CD3-positive populations; vaccinated groups achieved 100 percent survival with two to four log reductions of viral load in liver and spleen[6]. The same complementarity holds in human monitoring: CMV-specific T cell frequencies by ELISPOT and by ICS each correlated with anti-CMV immunoglobulin G (IgG) levels after IE1 stimulation (r equal to 0.4384 and 0.5070, respectively), linking the cellular frequency readout to the humoral record of prior infection[4]. Hence a complete antigen-specific assessment combines ELISPOT-derived responder frequency, ELISA-derived antibody and soluble mediator titers, and phenotypic confirmation, with each platform covering a blind spot of the others[4,6].
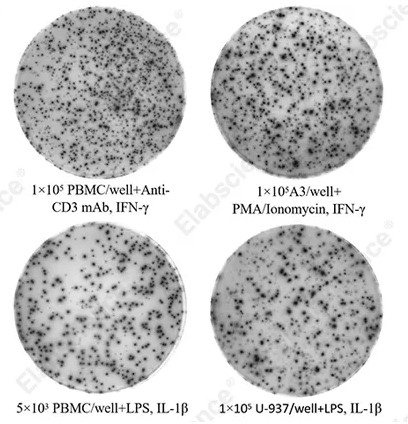
Fig. 3 ELISPOT assessment of human IFN-γ and IL-1β production by distinct cell populations. (The data are provided by Elabscience®)
Assay Used for This Experiment:
Human IL-1β (Interleukin 1β) ELISPOT Kit
Cat. No: ESP-H0005
Sample Type: Suspension cell samples
Detection Instrument: ELISPOT Reader
Explore the Human IL-1β ELISPOT Kit →
05 Multiplex cytokine detection with ELISpot and ELISA platforms
As immune profiling grows multidimensional, multiplex formats extend both platforms: bead-based suspension arrays parallelize the bulk cytokine assay, while Fluorospot parallelizes the single-cell readout. The Luminex multiplex bead system (Luminex MAP) measures many mediators simultaneously with higher throughput, smaller sample volumes and lower per-analyte cost than running one ELISA per target, and a 96-specimen validation against commercial sandwich ELISA kits showed excellent agreement for IL-1beta, IL-4, IL-5, IL-6, IL-10, IFN-gamma and TNF-alpha with correlation coefficients near 0.81 to 0.94, although IL-12p70 and IL-13 agreed poorly, confirming that each analyte in a multiplex panel still requires individual validation[3]. On the single-cell side, FluoroSpot introduces fluorescent detection into the ELISPOT cascade so that two or even three parameters can be assessed in one well, resolving up to seven secreting subsets (three single, three dual and one triple secretor), as demonstrated for IFN-gamma, IL-17A and IL-22 producing cells, with the same ease of performance as single-color enzymatic ELISPOT[1]. In practice the two multiplexing directions are combined with classical readouts: the CCHFV vaccine study profiled soluble mediators alongside ELISA antibody titers and ELISPOT responder frequencies, capturing humoral magnitude, cellular frequency and mediator pattern in one program[6]. Format limits remain asymmetric: ELISPOT-based multiplexing is currently capped at three parameters pending broader Fluorospot kit availability and provides minimal phenotyping, whereas bead multiplexes scale to dozens of analytes but report only bulk concentrations without assigning secretion to individual cells[1,3]. Selecting the platform therefore follows the question: bulk multiplex for mediator patterns across cohorts, FluoroSpot for polyfunctional single cells, and single-analyte ELISA or ELISPOT when validated quantitation of one target is sufficient[1,3,6].
In summary, ELISpot and ELISA are complementary rather than competing technologies for sensitive cytokine detection and immune response analysis. ELISPOT-based formats, including the ifn γ elispot and its fluorescent successor FluoroSpot, excel at enumerating rare antigen-specific cells with single-cell resolution and validated low-frequency sensitivity, while sandwich ELISA and bead-based multiplex panels excel at quantifying soluble mediator concentrations with broad dynamic range and high throughput. Direct comparisons show strong but analyte-dependent agreement between platforms, so each target and matrix should be validated in its intended format, key assay parameters such as cell handling windows, control strategies and statistical calling rules should be standardized, and frequency, concentration and phenotypic readouts should be combined whenever the study question spans humoral and cellular immunity.
Elabscience Quick Overview of Popular Products
Table 1. Research Tools for Biomarker Detection
|
Cat. No. |
Product Name |
|
ESP-H0002 |
Human IFN-γ (Interferon Gamma) ELISPOT Kit |
|
ESP-H0003 |
Human IL-10 (Interleukin 10) ELISPOT Kit |
|
ESP-H0004 |
Human IL-17A (Interleukin 17A) ELISPOT Kit |
|
ESP-H0005 |
Human IL-1β (Interleukin 1β) ELISPOT Kit |
|
ESP-H0006 |
Human IL-2 (Interleukin 2) ELISPOT Kit |
|
ESP-H0007 |
Human IL-4 (Interleukin 4) ELISPOT Kit |
|
ESP-H0008 |
Human IL-5 (Interleukin 5) ELISPOT Kit |
|
ESP-H0009 |
Human IL-6 (Interleukin 6) ELISPOT Kit |
|
ESP-H0010 |
Human TNF-α (Tumor Necrosis Factor Alpha) ELISPOT Kit |
06 Key takeaways
ELISpot and ELISA assays should not be viewed as competing methods. They answer different experimental questions.
● ELISpot enumerates individual cytokine-secreting cells at single-cell resolution and is commonly used to quantify the frequency of antigen-specific immune responders.
● ELISA quantifies the bulk concentration of soluble mediators in culture supernatants or biological fluids.
● ELISpot can detect rare low-frequency secretory cells that may be missed by bulk ELISA measurement.
● ELISA reports total accumulated analyte abundance but cannot assign cytokine secretion to individual cells.
● ELISpot + ELISA provides complementary readouts for comprehensive antigen-specific immune evaluation.
● Analyte-dependent platform agreement and assay validation are required before comparing data across ELISpot and ELISA.
● Multiplex bead arrays (for bulk cytokines) or FluoroSpot (for polyfunctional single cells) should be considered when multidimensional immune profiling is needed.
The most appropriate strategy is therefore:
Define the biological question → Select the primary assay → Add a complementary assay → Interpret the combined cellular and soluble readouts → Perform multiplex or phenotypic characterization when necessary
07 Related Resources
● Learn how ELISpot technology works and how it is used to detect antigen-specific immune responses and cytokine secretion.
Read A Window into the World of Immunity: Detailed Explanation of ELISpot Technology →
● Explore ELISA principles, protocols, and applications to support reliable immunoassay design and data analysis.
Download Your Free ELISA Guide Guide →
References:
[1] Janetzki S, et al., Immune monitoring technology primer: the enzyme-linked immunospot (Elispot) and Fluorospot assay. Journal for ImmunoTherapy of Cancer. 2015. 3:30.
[2] Gye HJ, et al., Reproducibility of antigen-immobilized enzyme-linked immunosorbent assay (ELISA) and sandwich ELISA for quantitative detection of NNV particles. Journal of Virological Methods. 2020. 275:113754.
[3] duPont NC, et al., Validation and comparison of luminex multiplex cytokine analysis kits with ELISA: determinations of a panel of nine cytokines in clinical sample culture supernatants. Journal of Reproductive Immunology. 2005. 66(2):175-191.
[4] Klinmalai C, et al., Comparison between enzyme-linked immunospot assay and intracellular cytokine flow cytometry assay of cytomegalovirus-specific T-cell response in healthy participants. PLoS One. 2026. 21(6): e0349292.
[5] Ishrat U, et al., Comparison of interferon gamma release assays and tuberculin skin test performance for diagnosing Mycobacterium tuberculosis infection in the Pakistani population. Scientific Reports. 2025. 15:35788.
[6] Hanifehnezhad A, et al., Dual-antigen AdV5 vaccines against Crimean-Congo hemorrhagic fever virus induce superior humoral and Th1-biased cellular immunity. Scientific Reports. 2026. 16:28482.

