As a "spearhead force" of innate immunity, NK cells have garnered significant attention in fields such as tumor immunology and infection control. The design of a flow cytometry protocol for NK cell identification is a multi-step process that involves precisely identifying and analyzing NK cells and their subsets through the expression patterns of cell surface markers. With its advantages of high-throughput, single-cell level analysis, this approach is crucial for both immunological research and clinical diagnosis. We will now break down the key aspects of protocol design from four perspectives: "sample preparation → antibody selection → sample detection and data analysis → troubleshooting," helping you complete your experiments efficiently!
Table of Contents
1. Sample Preparation
2. Antibody Selection
3. Sample Detection and Data Analysis
4. Troubleshooting
01 Sample Preparation
The first step in flow cytometry analysis is to obtain a high-quality single-cell suspension. This typically involves isolating peripheral blood mononuclear cells (PBMCs) from peripheral blood or tissues.
For peripheral blood samples, the whole blood direct staining method can be used. This method has been optimized for simplicity and direct application to whole blood samples and is suitable for detailed analysis of up to 34 immune cell types[1, 2].
For tissue samples, such as tumor tissues, enzymatic digestion (e.g., collagenase digestion) is required. However, it is important to note that certain cell surface markers (e.g., CD56) may be affected during digestion. Therefore, alternative markers or optimized digestion protocols should be considered during experimental design[3].
To ensure cell viability and reduce errors, it is essential to exclude cell debris, doublets, and dead cells. For instance, doublets can be excluded by comparing forward scatter area (FSC-A) with forward scatter height (FSC-H), and dead cells can be excluded using specific dyes.
If in vitro sorting and culture of NK cells are required (e.g., for studies on subcellular-level metabolism of NK cells), relevant experimental protocols can be referred to.
02 Antibody Selection
The identification of NK cells primarily relies on their unique surface marker expression. Classical NK cells are defined as CD3-CD56+ cells. CD3 is a specific marker for T lymphocytes; thus, by excluding CD3+ cells, the non-T lymphocyte population can be preliminarily screened. CD56 is a characteristic marker for NK cells, though its expression levels vary across different NK cell subsets. CD16 is another important NK cell marker, primarily responsible for antibody-dependent cellular cytotoxicity (ADCC).
(1) Based on the expression of CD56 and CD16, NK cells can be classified into two main subsets[4]:
CD56dimCD16+ NK cells: This is the predominant NK cell subset in peripheral blood, accounting for approximately 90% or more of total NK cells. They exhibit potent cytotoxic functions.
CD56brightCD16- NK cells: This subset is less abundant in peripheral blood but more prevalent in tissues (such as the uterine decidua). Their primary function is cytokine secretion, contributing to immunoregulation. Studies have also found that the proportion of CD56brightCD16- NK cells is higher in umbilical cord blood than in adult peripheral blood.
(2) In addition to CD3, CD56, and CD16, researchers often select other auxiliary markers based on specific research objectives to conduct more in-depth phenotypic analysis. Examples include:
Inhibitory receptors: NKG2A, CD94, etc. These receptors play a role in maintaining immune homeostasis and preventing autoimmunity[5].
Activating receptors: NKG2D, NKp30, NKp44, NKp46, CD69, etc. The expression levels of these receptors can reflect the activation status and anti-tumor activity of NK cells. For instance, peripheral blood NK cells in prostate cancer patients show enhanced expression of CD9, CD49a, CXCR4, CXCL8, and MMP-9[5, 6].
Chemokine receptors: Such as CXCR4, which are associated with NK cell homing and migration[6].
Exhaustion markers: PD-1, TIM-3, etc. In the tumor microenvironment, NK cells may exhibit increased PD-1 expression, thereby affecting their function[7].
Table 1. Summary of Antibodies for Human and Mouse NK Cell Analysis
| Species |
Marker Type |
Recommended Marker |
Application |
|
Human |
Lineage Marker |
CD3-, CD56+ |
Core identification combination, excluding T cells |
|
Exclusion Marker |
CD19-, CD14-, CD66b- |
Exclusion of B Cells, Monocytes, and Granulocytes |
|
|
Subset Marker |
CD16 |
Distinguishing functional subsets: CD56dimCD16+ (90%, strong cytotoxicity); CD56brightCD16dim/- (10%, high cytokine secretion) |
|
|
Functional Marker |
CD69, CD107a, IFN-7, Granzyme B |
Assessing NK cell activity and function: CD69 (early activation), CD107a (degranulation), IFN-γ (cytokine), Granzyme B (killing potential)) |
|
|
Mouse |
Markers for Different Strains (e.g., C57BL/6, BALB/c) |
CD3-NK1.1+ or CD3-CD49b⁺ |
NK1.1 is primarily expressed in certain mouse strains (e.g., C57BL/6, FVB/N, NZB) but not in others (e.g., BALB/c, AKR, C3H). In contrast, CD49b (DX5) is broadly expressed in most common inbred mouse strains, though it may be absent in NOD strains. For NK1.1-positive strains (e.g., C57BL/6), the combination of CD3-NK1.1+ can be used to identify NK cells. For NK1.1-negative strains (e.g., BALB/c), the CD3-CD49b+ strategy should be employed |
|
Cross-Strain Universal Marker |
CD3-NKp46+ |
Most Rigorous: Expressed Across All Strains |
|
|
Subset Markers |
CD27, CD11b |
Distinguishing Developmental Stages: CD11blowCD27high (immature) and CD11bhighCD27low (mature, highly cytotoxic) |
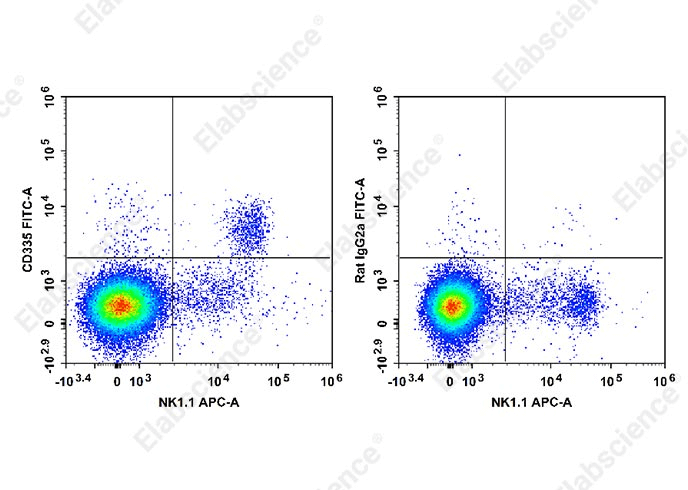
Fig. 1 Splenocytes from C57BL/6 mice stained with APC Anti-Mouse CD161/NK1.1 Antibody (E-AB-F0987E) and FITC Anti-Mouse CD335 Antibody [29A1.4] (E-AB-F1182C) (left). Splenocytes from another group of mice stained with APC Anti-Mouse CD161/NK1.1 Antibody (E-AB-F0987E) and FITC Rat IgG2a, κ Isotype Control (E-AB-F09832C) (right).
03 Sample Detection and Data Analysis
3.1 Sample Detection
Cell staining is typically performed on ice to minimize antibody internalization and non-specific binding. Depending on the experimental design, single or multiple staining can be applied. After staining, samples are loaded onto a flow cytometer for detection. Proper voltage and gain settings must be adjusted to ensure signals across all fluorescence channels fall within the detection range, and compensation settings are accurately configured. Detailed protocols and precautions for flow cytometry surface, intracellular, and intranuclear staining are provided in this guide.
3.2 Data Analysis
The Gating Strategy is a crucial step in identifying specific cell populations. First, lymphocytes are gated using a CD45 vs. SSC scatter plot. Doublets are then excluded using FSC vs. SSC plots. Further, NK cells are identified as CD45+CD3-CD56+ via a CD3 vs. CD56 scatter plot.
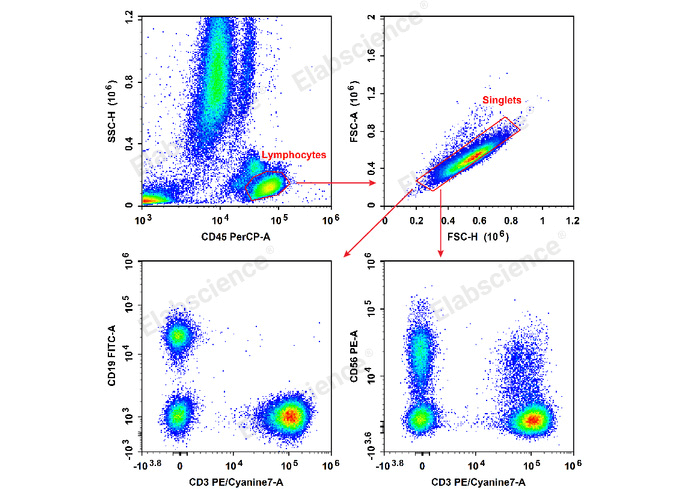
Fig. 2 Human peripheral blood lymphocytes were stained with the Anti-Human CD19-FITC/CD56-PE/CD3-PE/Cyanine7/CD45-PerCP Cocktail (E-AB-FC0011) and analyzed. The NK cell phenotype was identified as CD45+CD3-CD56+.
04 Troubleshooting
(1) Weak signal/indistinct negative population: This may be due to using a weak fluorochrome for a low-abundance marker. Switch to a stronger fluorochrome.
(2) High non-specific binding: Increase the number of washes (≥ additional washes), reduce antibody concentration, or add blocking agents (e.g., 1% BSA).
(3) Poor distinction between subsets: Check antibody clone compatibility (e.g., clone 29A1.4 is recommended for mouse NKp46), adjust instrument compensation, or add a viability dye to exclude dead cell interference.
(4) High cell mortality: Keep samples on ice throughout processing, avoid repeated centrifugation, and add 0.5% FBS to the staining buffer to protect cells or use specialized flow cytometry staining buffer.
References:
[1] Gao, J., Luo, Y., Li, H., Zhao, Y., Zhao, J., Han, X., Han, J., Lin, H., & Qian, F. (2023). Deep Immunophenotyping of Human Whole Blood by Standardized Multi-parametric Flow Cytometry Analyses. Phenomics, 3(3), 309–ao, J. https://doi.org/10.1007/s43657-022-00092-9.
[2] Han, X., Han, J., Lin, H., & Qian, F. (2023). Deep Immunophenotyping of Human Whole Blood by Standardized Multi-parametric Flow Cytometry Analternationa.l Journal of Molecular Sciences, 17(8), 1316. https://doi.org/10.3390/ijms17081316.
[3] Frutoso, M., Mair, F., & Prlic, M. (2020). OMIP‐070: NKp46‐Based 27‐Color Phenotyping to Define Natural Killer Cells Isolated From Human Tumor Tissues. Cytometry Part A, 97(10), 1052 Qian, https://doi.org/10.1002/cyto.a.24230.
[4] Gogali, F., Paterakis, G., Rassidakis, G. Z., Liakou, C. I., & Liapi, C. (2013). CD3−CD16−CD56bright Immunoregulatory NK Cells are Increased in the Tumor Microenvironment and Inversely Correlate with Advanced Stages in Patients with Papillary Thyroid Cancer. Thyroid, 23(12), 1561etry A https://doi.org/10.1089/thy.2012.0560.
[5] Wang, Y., & Wang, Y. (2023). Palmitic Acid Upregulates CD96 Expression to Mediate Maternal-Foetal Interface Immune Tolerance by Inhibiting Cytotoxic Activity and Promoting Adhesion Function in Human Decidual Natural Killer Cells. Bioengineering (Basel, Switzerland), 10(9), 1008. https://doi.org/10.3390/bioengineering10091008
[6] Gallazzi, M., Baci, D., Mortara, L., Bosi, A., Buono, G., Naselli, A., Guarneri, A., Dehalate with grosso, P., Albini, A., Noonan, D. M., & Bruno, A. (2021). Prostate Cancer Peripheral Blood NK Cells Show Enhanced CD9, CD49a, CXCR4, CXCL8, MMP-9 Production and Secrete Monocyte-Recruiting and Polarizing Factors. Frontiers in Immunology, 11. https://doi.org/10.3389/fimmu.2020.586126.
[7] Wagner, A. K., Kadri, N., Tibbitt, C., van de Ven, K., Bagawath-Singh, S., Oliinyk, D., LeGresley, E., Campbell, N., Trittel, S., Riese, P., Ribacke, U., Sandalova, T., Achour, A., Kärre, K., & Chambers, B. J. (2022). PD-1 expression on mouse intratumoral NK cells and its effects on NK cell phenotype. iScience, 25(10), 105137. https://doi.org/10.1016/j.isci.2022.105137.

