

Mitochondria drive cellular bioenergetics via oxidative phosphorylation (OXPHOS), coupling electron transport to ATP synthesis while supplying precursors and buffering ROS. Functional assessment employs high-resolution respirometry, JC-1 potentiometry, luciferase ATP assays, and MitoSOX Red redox probing. Beyond energy production, mitochondrial membrane potential (ΔΨₘ) determines cell fate: depolarization initiates apoptosis, while cancer-associated hyperpolarization fosters survival and glutamine-dependent biosynthesis. In type 2 diabetes, impaired OXPHOS arises from reduced mitochondrial mass, not respiratory incompetence.
In this context, we outline essential strategies for mitochondrial phenotyping and highlight the organelle as a sentinel of cellular stress and a metabolic checkpoint in pathophysiology.
Table of Contents
1. What does a mitochondrion do in an animal cell?
2. What is oxidative phosphorylation in cellular respiration?
3. Mitochondrial membrane potential as a readout of mitochondrial function
4. Reactive oxygen species generated during oxidative phosphorylation
5. Mitochondrial remodeling in cancer and metabolic diseases
6. Experimental methods to measure oxidative phosphorylation activity
01 What does a mitochondrion do in an animal cell?
Mitochondria are semi-autonomous organelles serving as central hubs for metabolism, energy conversion, and cellular signaling. Encased in a double-membrane system comprising the outer mitochondrial membrane and the folded inner mitochondrial membrane, they house the electron transport chain (ETC). The internal matrix accommodates the tricarboxylic acid (TCA) cycle and fatty acid β-oxidation[1].
Their primary role is ATP production via oxidative phosphorylation. Nutrients such as glucose, amino acids, and fatty acids are catabolized to yield NADH and FADH₂, which transfer electrons to the ETC. This process establishes an electrochemical proton gradient that drives ATP synthesis through F₁F₀-ATP synthase. Beyond bioenergetics, mitochondria supply biosynthetic precursors for macromolecules and maintain redox balance by managing respiration-derived reactive oxygen species (ROS)[1,2]. Consequently, mitochondrial dysfunction underpins diverse pathologies, including neurodegenerative diseases, metabolic disorders, and cancer[3].
02 What Is Oxidative Phosphorylation in Cellular Respiration?
Oxidative phosphorylation (OXPHOS) is the primary mechanism by which mitochondria generate ATP, coupling electron transport to ATP synthesis. Embedded within the inner mitochondrial membrane, the electron transport chain (ETC) consists of Complexes I through V, along with mobile carriers ubiquinone and cytochrome c[2,4].
Electrons derived from NADH and FADH₂ enter the ETC at Complex I and Complex II, respectively. They flow sequentially through Complex III to Complex IV, where molecular oxygen acts as the terminal electron acceptor and is reduced to water[2]. The energy released during this transfer drives protons across the inner membrane into the intermembrane space, establishing the mitochondrial membrane potential (ΔΨₘ). This proton motive force powers ATP synthesis as protons return to the matrix via Complex V (ATP synthase), phosphorylating ADP to ATP[2,4].
Metabolic yield varies by substrate; oxidizing one NADH produces approximately 2.5–2.7 ATP, while one FADH₂ yields about 1.5–1.6 ATP, contingent on coupling efficiency and membrane integrity[5]. Tight coupling ensures high thermodynamic efficiency, whereas uncoupling permits proton leak, dissipating energy as heat rather than generating ATP[2].
%20and%20ATP%20synthesis%20in%20the%20inner%20mitochondrial%20membrane_.png)
Fig. 1 The electron transport chain (ETC) and ATP synthesis in the inner mitochondrial membrane. Electron flow from NADH/FADH₂ through complexes I–IV generates a proton gradient that drives ATP synthesis by Complex V, with O₂ as the final electron acceptor (forming H₂O) and ANT mediating ATP/ADP exchange[5].
03 Mitochondrial Membrane Potential as a Readout of Mitochondrial Function
The mitochondrial membrane potential (ΔΨₘ) serves as a pivotal indicator of mitochondrial health. Generated primarily by the proton-pumping activity of ETC Complexes I, III, and IV, ΔΨₘ typically ranges from 140 to 180 mV in coupled mitochondria. Its magnitude reflects the equilibrium between proton extrusion via the ETC and proton re-entry through ATP synthase or leak pathways[2].
The JC-1 assay is the predominant method for quantifying ΔΨₘ. This lipophilic cationic dye accumulates in mitochondria in a potential-dependent manner. At low ΔΨₘ, JC-1 exists as monomers emitting green fluorescence; at high ΔΨₘ, it forms J-aggregates emitting red fluorescence. The resulting red-to-green fluorescence ratio provides a sensitive, ratiometric readout independent of mitochondrial mass[6]. This assay is robust across flow cytometry and fluorescence microscopy platforms. The signal responds linearly across physiological ranges and is abolished by protonophores such as FCCP, confirming its reliance on the electrochemical gradient. Notably, JC-1 reveals heterogeneous ΔΨₘ distributions among individual mitochondria within a single cell[6].
A declining ΔΨₘ signifies early mitochondrial dysfunction, often preceding mitochondrial permeability transition pore opening, pro-apoptotic factor release, and ATP synthesis failure. Conversely, ΔΨₘ hyperpolarization, frequently observed in cancer cells, can elevate ROS production and confer apoptotic resistance[2,7].
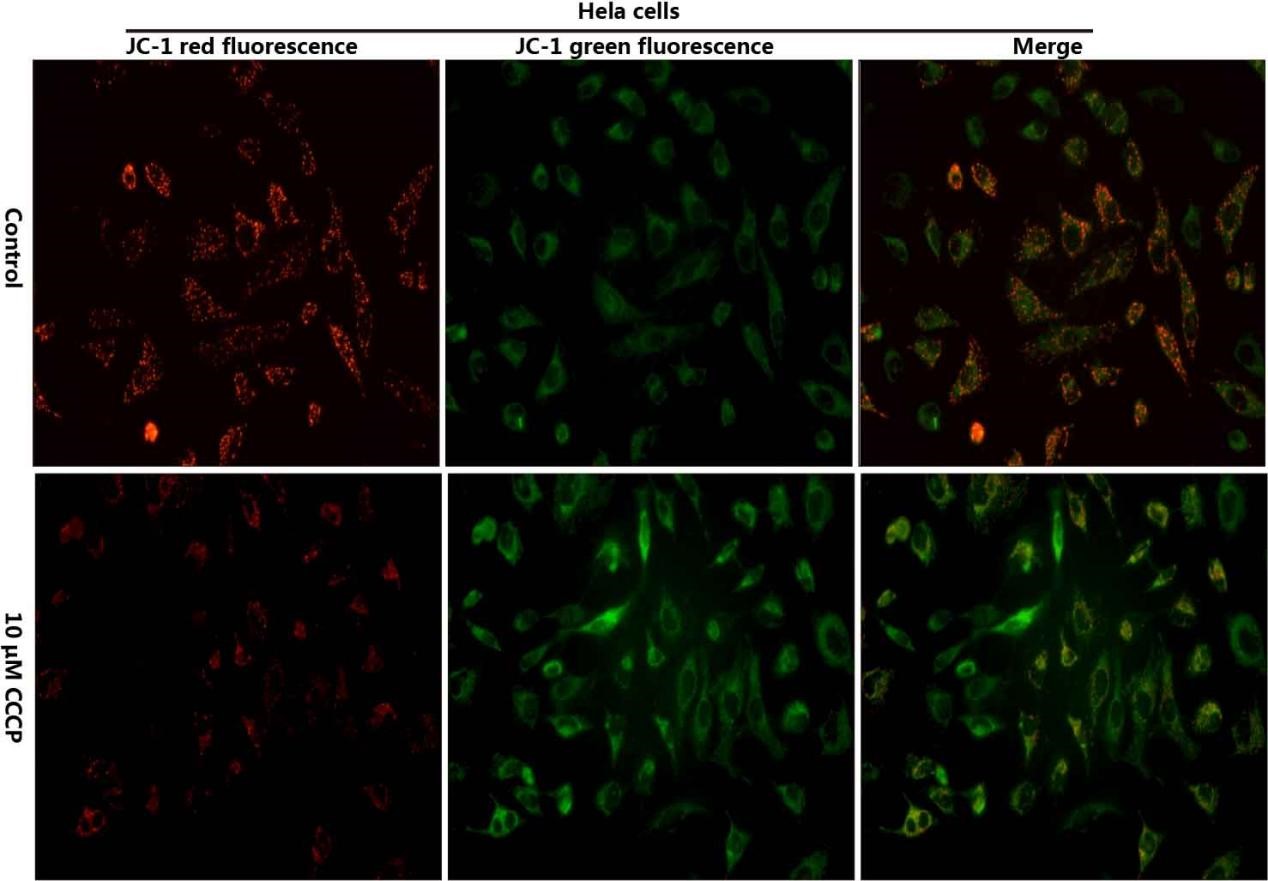
Fig. 2 Normal HeLa cells(Control,top) were not treated with drugs,show a low level of apoptosis, which is manifested as a small amount of mitochondrial membrane potential collapse cells (green); 10 μM CCCP treated HeLa cells for 40 min (bottom) , had a large number of mitochondrial membrane potential collapse cells (green). (The data are provided by Elabscience)
04 Reactive Oxygen Species Generated During Oxidative Phosphorylation
Mitochondrial reactive oxygen species (ROS) originate primarily as by-products of electron transport chain (ETC) activity, with the superoxide anion radical (O₂•⁻) being the predominant species. O₂•⁻ arises from the one-electron reduction of molecular oxygen at specific ETC sites, mainly Complex I (FMN cofactor and ubiquinone-binding site) and Complex III (Qₒ site)[4,8].
Under physiological conditions, 0.1–2% of electrons leak to form superoxide, a rate modulated by metabolic state, oxygen tension, and ΔΨₘ[2,8]. Superoxide is rapidly converted to hydrogen peroxide (H₂O₂) by manganese superoxide dismutase (MnSOD/SOD2) in the matrix and copper-zinc SOD (CuZnSOD/SOD1) in the intermembrane space[8]. Due to its stability and membrane permeability, H₂O₂ serves as a key signaling molecule capable of diffusing into the cytosol to modulate redox pathways[8].
ROS generation correlates tightly with ETC function. Elevated ΔΨₘ and a reduced CoQ pool enhance superoxide production, particularly via reverse electron transport (RET) from Complex II to Complex I[2,4]. Conversely, mild uncoupling dissipates ΔΨₘ and curtails ROS output, establishing a feedback loop mediated by uncoupling proteins (UCPs) and the adenine nucleotide translocase (ANT)[8].
Cellular homeostasis depends on balancing ROS production with antioxidant defenses. The mitochondrial antioxidant network comprises glutathione peroxidase, peroxiredoxins, thioredoxin, and thioredoxin reductase, all utilizing NADPH as the terminal reductant[4,8]. NADPH regeneration is driven by nicotinamide nucleotide transhydrogenase (NNT), an enzyme powered by ΔΨₘ, thereby coupling mitochondrial energetics directly to redox resilience[2,4].
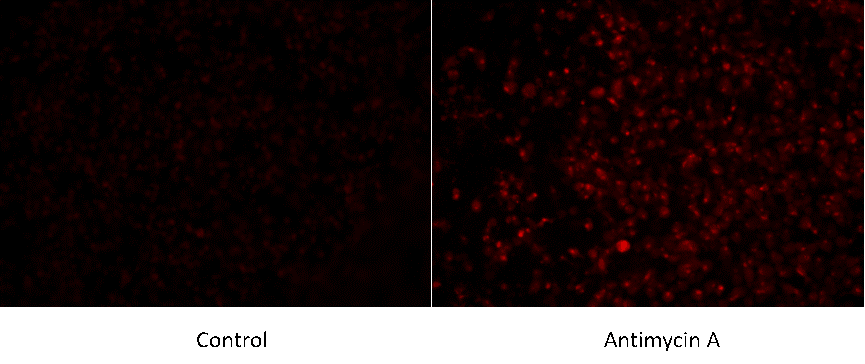
Fig. 3 HeLa cells were cultured with or without (Control) 5 μM Antimycin A for 1 h, and then changes in mitochondrial ROS were detected by mitochondrial superoxide fluorometric assay kit. (The data are provided by Elabscience)
05 Mitochondrial Remodeling in Cancer and Metabolic Diseases
Mitochondrial remodeling defines cancer and type 2 diabetes (T2D). In cancer, the Warburg effect shifts metabolism from oxidative phosphorylation to aerobic glycolysis, driven by PI3K/AKT/mTOR, HIF-1α, and Myc signaling[7]. Despite glycolysis dominance, mitochondria remain vital for biosynthesis; glutaminolysis fuels the TCA cycle, and ETC activity supports aspartate synthesis for proliferation[1,7]. Tumor mitochondria typically exhibit hyperpolarized ΔΨₘ, elevated ROS, and dysregulated Bcl-2 proteins, promoting tumor cell survival[7].
In T2D, skeletal muscle mitochondrial dysfunction is debated. Confounding factors like age and obesity obscure intrinsic defects; preserved respiratory capacity contrasts with reduced oxidative phosphorylation due to lower mitochondrial volume and vascular oxygen limitation[9].
Both pathologies feature disrupted dynamics. Imbalanced fission, fusion, and mitophagy yield fragmented networks, impairing bioenergetics and elevating ROS[7]. Context-specific targeting of these mechanisms offers therapeutic potential.
06 Experimental Methods to Measure Oxidative Phosphorylation Activity
A comprehensive mitochondrial function assay requires a multi-parametric approach integrating various techniques to evaluate oxidative phosphorylation. High-resolution respirometry, as a key component of the oxidative phosphorylation assay, measures mitochondrial respiration by defining critical parameters such as ATP-linked flux and maximal capacity via sequential pharmacological modulation. The respiratory control ratio serves as the primary index of coupling efficiency[2,3,5].
Coupling these data with a mitochondrial membrane potential assay provides a holistic bioenergetic profile. The JC-1 assay delivers a ratiometric readout of ΔΨₘ, complementing respirometry to quantify protonmotive force[6]. An ATP assay utilizing luciferin-luciferase bioluminescence directly confirms OXPHOS output, with specificity validated by oligomycin sensitivity[10].
Redox status is interrogated through an oxidative stress assay. A general ROS assay via DCFDA detects intracellular H₂O₂, while the Amplex Red system offers quantitative specificity[2,11]. A targeted mitochondrial superoxide assay employs MitoSOX Red for compartment-specific detection, with electron paramagnetic resonance spectroscopy providing orthogonal validation[2]. Integrated application of these assays enables precise characterization of ETC integrity and antioxidant capacity in pathophysiological states[2,3,5].
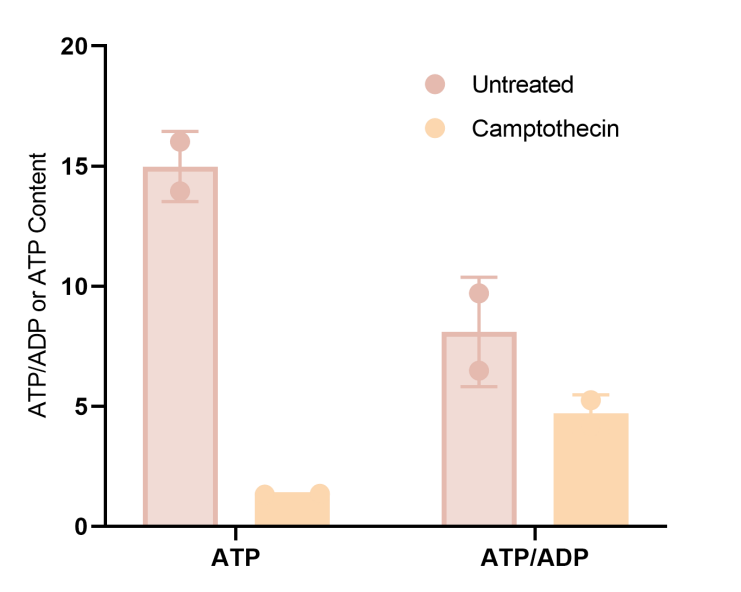
Fig. 4 After treatment with camptothecin apoptosis reagent, the ATP/ADP ratio (E-BC-F004) in 293T cells was decreased compared with untreated cells. (The data are provided by Elabscience)
Elabscience® Quick Overview of Popular Products:
Table 1. Assay Kits for mitochondrial function
|
Cat. No. |
Product Name |
|
E-BC-F300 |
ATP Chemiluminescence Assay Kit (Double Reagent) |
|
E-BC-F004 |
ATP/ADP Ratio Chemiluminescence Assay kit |
|
E-BC-F201 |
Enhanced ATP Chemiluminescence Assay Kit |
|
E-BC-F070 |
Enhanced Oxygen Consumption Rate (OCR)Fluorometric Assay Kit |
|
E-CK-A301 |
Mitochondrial Membrane Potential Assay Kit (with JC-1) |
|
E-BC-F008 |
Mitochondrial Superoxide Fluorometric Assay Kit |
|
E-BC-K784-M |
Fatty Acid Oxidation (FAO) Colorimetric Assay Kit |
|
E-BC-K153-M |
Mitochondrial Complex Ⅴ Activity Assay Kit |
|
E-BC-K149-M |
Mitochondrial Complex I (NADH-CoQ Reductase) Activity Assay Kit |
|
E-BC-K838-M |
Cell Mitochondrial Complex Ⅴ (ATP Synthase) Activity Assay Kit |
|
E-BC-K138-F |
Reactive Oxygen Species (ROS) Fluorometric Assay Kit (Green) |
References:
[1] Spinelli JB, Haigis MC. The Multifaceted Contributions of Mitochondria to Cellular Metabolism. Nature Cell Biology. 2018;20(7):745-754
[2] Nolfi-Donegan D, Braganza A, Shiva S. Mitochondrial Electron Transport Chain: Oxidative Phosphorylation, Oxidant Production, and Methods of Measurement. Redox Biology. 2020;37:101674
[3] Van Bergen NJ, Blake RE, Crowston JG, Trounce IA. Oxidative Phosphorylation Measurement in Cell Lines and Tissues. Mitochondrion. 2014;15:24-33
[4] Kowaltowski AJ, de Souza-Pinto NC, Castilho RF, Vercesi AE. Mitochondria and Reactive Oxygen Species. Free Radical Biology and Medicine. 2009;47(4):333-343
[5] Lewis MT, Heiston EM, Liu Y, et al. Quantification of Mitochondrial Oxidative Phosphorylation in Metabolic Disease: Application to Type 2 Diabetes. International Journal of Molecular Sciences. 2019;20(21):5271
[6] Smiley ST, Reers M, Mottola-Hartshorn C, et al. Intracellular Heterogeneity in Mitochondrial Membrane Potentials Revealed by a J-Aggregate-Forming Lipophilic Cation JC-1. Proceedings of the National Academy of Sciences. 1991;88(9):3671-3675
[7] Barbosa IA, Machado NG, Skildum AJ, Scott PM, Oliveira PJ. Mitochondrial Remodeling in Cancer Metabolism and Survival: Potential for New Therapies. Biochimica et Biophysica Acta (BBA) - Reviews on Cancer. 2012;1826(1):238-254
[8] Degli Esposti M. Measuring Mitochondrial Reactive Oxygen Species. Methods. 2002;26(4):335-340
[9] Manfredi G, Yang L, Gajewski CD, Mattiazzi M. Measurements of ATP in Mammalian Cells. Methods. 2002;26(4):317-326
[10] Kauffman M, Kauffman ME, Traore K, et al. MitoSOX-Based Flow Cytometry for Detecting Mitochondrial ROS. Reactive Oxygen Species. 2016
[11] d'Hose D, Gallez B. Measurement of Mitochondrial (Dys)Function in Cellular Systems Using Electron Paramagnetic Resonance (EPR): Oxygen Consumption Rate and Superoxide Production. In: Methods in Molecular Biology. Springer US; 2022. p 83-95

