

Redox signaling is a continuum rather than a switch: physiological ROS signal through reversible cysteine oxidation in the nanomolar eustress window, but once oxidant flux outruns antioxidant capacity the same chemistry turns destructive, and unchecked lipid peroxidation commits the cell to ferroptosis. Locating a cell on that continuum is the central experimental problem, because one endpoint fluorescence value resolves neither oxidant identity, source compartment, nor whether the damage is reversible. In this context, we outline concentration-calibrated protocols for redox phenotyping, establishing this assay suite as a checkpoint for decoding the progression from signaling through oxidative stress to ferroptotic death.
Table of Contents
1. How does hydrogen peroxide act as a redox signaling molecule?
2. How does mitochondrial ROS control cellular redox signaling?
3. How do redox signals regulate T cell activation and function?
4. How does redox signaling shape macrophage inflammatory responses?
5. How does redox signaling regulate ferroptosis?
6. Which redox biomarkers best distinguish signaling from oxidative stress?
01 How does hydrogen peroxide act as a redox signaling molecule?
H₂O₂ is built for signaling in a way superoxide is not: a non-radical two-electron oxidant, it travels farther yet reacts preferentially with deprotonated cysteine thiolates in favored microenvironments rather than with most residues, lipids or DNA. Production by NADPH oxidases and the respiratory chain, set against removal by peroxiredoxins, glutathione peroxidases and catalase, holds the steady state at 1 to 10 nM, the range termed oxidative eustress[1]. There, H₂O₂ acts by reversible cysteine oxidation: sulfenylation inactivates protein tyrosine phosphatases, raising net tyrosine phosphorylation; peroxiredoxins relay the oxidative equivalent to factors such as STAT3; and peroxiporins gate H₂O₂ across membranes, creating gradients that keep the signal local. Thioredoxin- and glutathione-dependent reductases then reset the switch, so duration reflects reduction as much as oxidation. Between roughly 10 and 100 nM, Nrf2/Keap1 and NF-κB engage; above 100 nM comes oxidative distress, with damage to lipids, proteins and DNA. The 1 to 5 µM H₂O₂ used in culture is orders of magnitude higher, so ROS assay data at such doses describe damage, not signaling[1]. Probe choice decides what any ROS assay reports: DCFH-DA is not oxidized by H₂O₂ and drifts with pH, while boronate probes such as peroxy yellow 1 react stoichiometrically[1]. Signaling needs chemically defined readouts: catalase Compound I spectroscopy, the peroxiredoxin-2 ratio, or encoded sensors. Calibrated H₂O₂ boluses with catalase controls make a ROS assay report signaling, not injury[1].
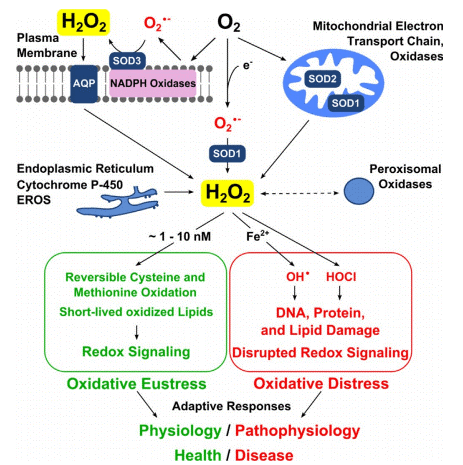
Fig. 1 Role of hydrogen peroxide in oxidative stress[1]. Endogenous H₂O₂ sources include NADPH oxidases and mitochondria. SODs (1,2,3) convert superoxide to H₂O₂, diffusing via aquaporins. Low levels (green) cause oxidative eustress for redox signaling; high levels (red) cause oxidative distress and damage.
02 How does mitochondrial ROS control cellular redox signaling?
Mitochondria generate superoxide mainly at Complexes I and III, converted to H₂O₂ by superoxide dismutases in the matrix and intermembrane space[2]. Unlike NOX enzymes, which make oxidant on demand, this source is coupled to respiration, so the signal reports metabolic state[2]. What is controlled depends on where the oxidant appears, because it acts only within its diffusion radius: charged superoxide cannot cross membranes, so superoxide released into the matrix stays organellar, whereas superoxide released by Complex III into the intermembrane space exits through voltage-dependent anion channels to reach cytosolic targets[2]. Conversion by SOD is a further control point, deciding whether the signal stays short-range as superoxide or travels farther as uncharged H₂O₂. One source therefore serves several programs: hypoxic HIF-1α stabilization, NLRP3 inflammasome activation, starvation autophagy via ATG4, and hematopoietic stem cell self-renewal. Control thus resides in site, chemistry and reach rather than in total oxidant load, which is why a reactive oxygen species assay must resolve where the oxidant is, not only how much[2,3]. Probe choice follows this logic: a reactive oxygen species assay must report location, not just amount, since MitoSOX Red loads with ΔΨm and DCFH-DA is unfit alone[3]. Fluorescence proves nothing on its own, so a reactive oxygen species assay needs compartment-targeted sensors plus concurrent perturbation[3].
03 How do redox signals regulate T cell activation and function?
TCR engagement generates superoxide and H₂O₂ within minutes, first from NADPH oxidases (NOX2, DUOX1), then from mitochondria at 1 to 2 h[4]. The logic mirrors proximal tyrosine phosphorylation: H₂O₂ sulfenylates and inactivates Shp1 and Shp2, amplifying Lck and ZAP-70, while heavy oxidation of Lck, LAT or cofilin suppresses it. Because outcome tracks dose, source and differentiation state, one shift can amplify signaling in one cell and suppress it in another[4]. Downstream, antigen-driven Ca²⁺ entry via CRAC channels raises ΔΨm and triggers Complex III ROS required for NFAT translocation and IL-2 transcription, the step on which a T cell activation assay hinges[5]. Two constraints shape a T cell activation assay with a redox dimension: T cells make far less ROS than phagocytes, so monocyte contamination dominates the signal, and the ROS pulse is transient and compartment-specific, a mitochondrial spike within 10 min of stimulation lasting over 120 min[4,5]. Mechanistically, deleting Complex III subunit RISP (Uqcrfs1) abolishes MitoSOX Red oxidation, IL-2, CD69 and CD25, rescue with exogenous H₂O₂ restores IL-2, and MitoVE abolishes it, so Complex III oxidants, not ATP, drive NFAT activation. Redox tone is permissive rather than instructive, since RISP-deficient T cells still proliferate under lymphopenia yet fail antigen-specific expansion, so interpreting a T cell activation assay means separating bioenergetic failure from loss of ROS signaling[5].
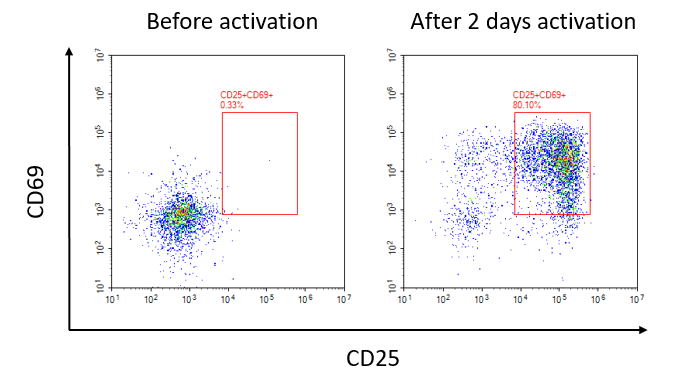
Fig. 2 Human PBMCs were activated with Human CD3/CD28 T Cell Activation Beads for 2 days, and the expression of CD69 and CD25 was analyzed pre- and post-activation.
04 How does redox signaling shape macrophage inflammatory responses?
In pro-inflammatory macrophages, lipopolysaccharide reprograms metabolism, raising ΔΨm and keeping coenzyme Q reduced, which drives superoxide by reverse electron transport (RET) at Complex I[6]. This mtROS is a requirement, not a byproduct: the ND6 P25L mutation disables Complex I RET and abolishes IL-1β release after NLRP3 activation, the endpoint on which a macrophage activation assay in this pathway depends. The effect is selective, since TNF-α, IL-6 and IL-10 release persists without RET-derived superoxide, so mitochondrial ROS shapes which arm of the inflammatory program runs[6]. One mitochondrial ROS source, read out with MitoNeoD, thus controls a defined effector function and extends TLR-driven phagosomal recruitment[2,6]. Three choices follow for a macrophage activation assay with a redox dimension. Measure superoxide with mitochondria-validated probes such as MitoNeoD, free of the DNA intercalation background of MitoSOX, reading membrane potential and respiration in parallel since RET superoxide depends on ΔΨm and coenzyme Q redox state[3,6]. Match cytokine timing to redox kinetics: IL-1β follows NLRP3 assembly and gasdermin D pore formation, with ROS-dependent gasdermin D oxidation as the proposed link, so time ELISA to inflammasome activation, not the early ROS peak[6]. Note that oxidants cross between cell types and confound co-culture T cell readouts, as set out in section3[4]. Purity-documented isolated cells give the cleanest macrophage activation assay[4].
%20for%2048%20h_.png)
Fig. 3 RAW 264.7 cells were induced with RAW 264.7 Cell M1 Differentiation MIX (XJM004A) for 48 h. Culture supernatants were then collected, and the secretion levels of mouse TNF-α, IL-12, IL-6, and IL-1β were determined by ELISA. The results showed that the production of all four cytokines was markedly increased after induction.
05 How does redox signaling regulate ferroptosis?
Ferroptosis is the terminal phenotype once phospholipid antioxidant defenses are exhausted, and the threshold is set by defense capacity rather than oxidant dose: how much peroxide the glutathione peroxidase 4(GPX4) and system xc⁻ axis can absorb decides whether a cell survives the same load, so lipid peroxidation and ferroptosis have a regulatable set point. Inducers converge four ways, SLC7A11 inhibition starving GPX4 of glutathione, GPX4 inhibition or degradation, and endoperoxides, while subcellular mapping makes the ER the early site and mitochondrial peroxidation dispensable[7]. The relation between lipid peroxidation and ferroptosis is best read with C11-BODIPY 581/591, whose oxidation shifts emission red to green for a loading-independent ratio, but such a lipid peroxidation assay needs tuned dose and timing, since weak treatment leaves no oxidized probe and overtreatment permeabilizes membranes. A complete ferroptosis assay adds kinetic viability and matched inhibitor rescue, with specificity resting on ferrostatin-1 or deferoxamine and absent cleaved caspase-3[8]. C11-BODIPY reports real-time membrane peroxides rather than cumulative damage, so lipidomics should close each lipid peroxidation assay and any ferroptosis assay built on it: F₂-isoprostanes such as 8-iso-PGF₂α are the in vivo gold standard, yet may reflect PGHS activity, so work on lipid peroxidation and ferroptosis needs the 8-iso-PGF₂α/PGF₂α ratio, chemical peroxidation giving near-equal products where enzymatic formation yields only about 0.004 to 0.008[9].
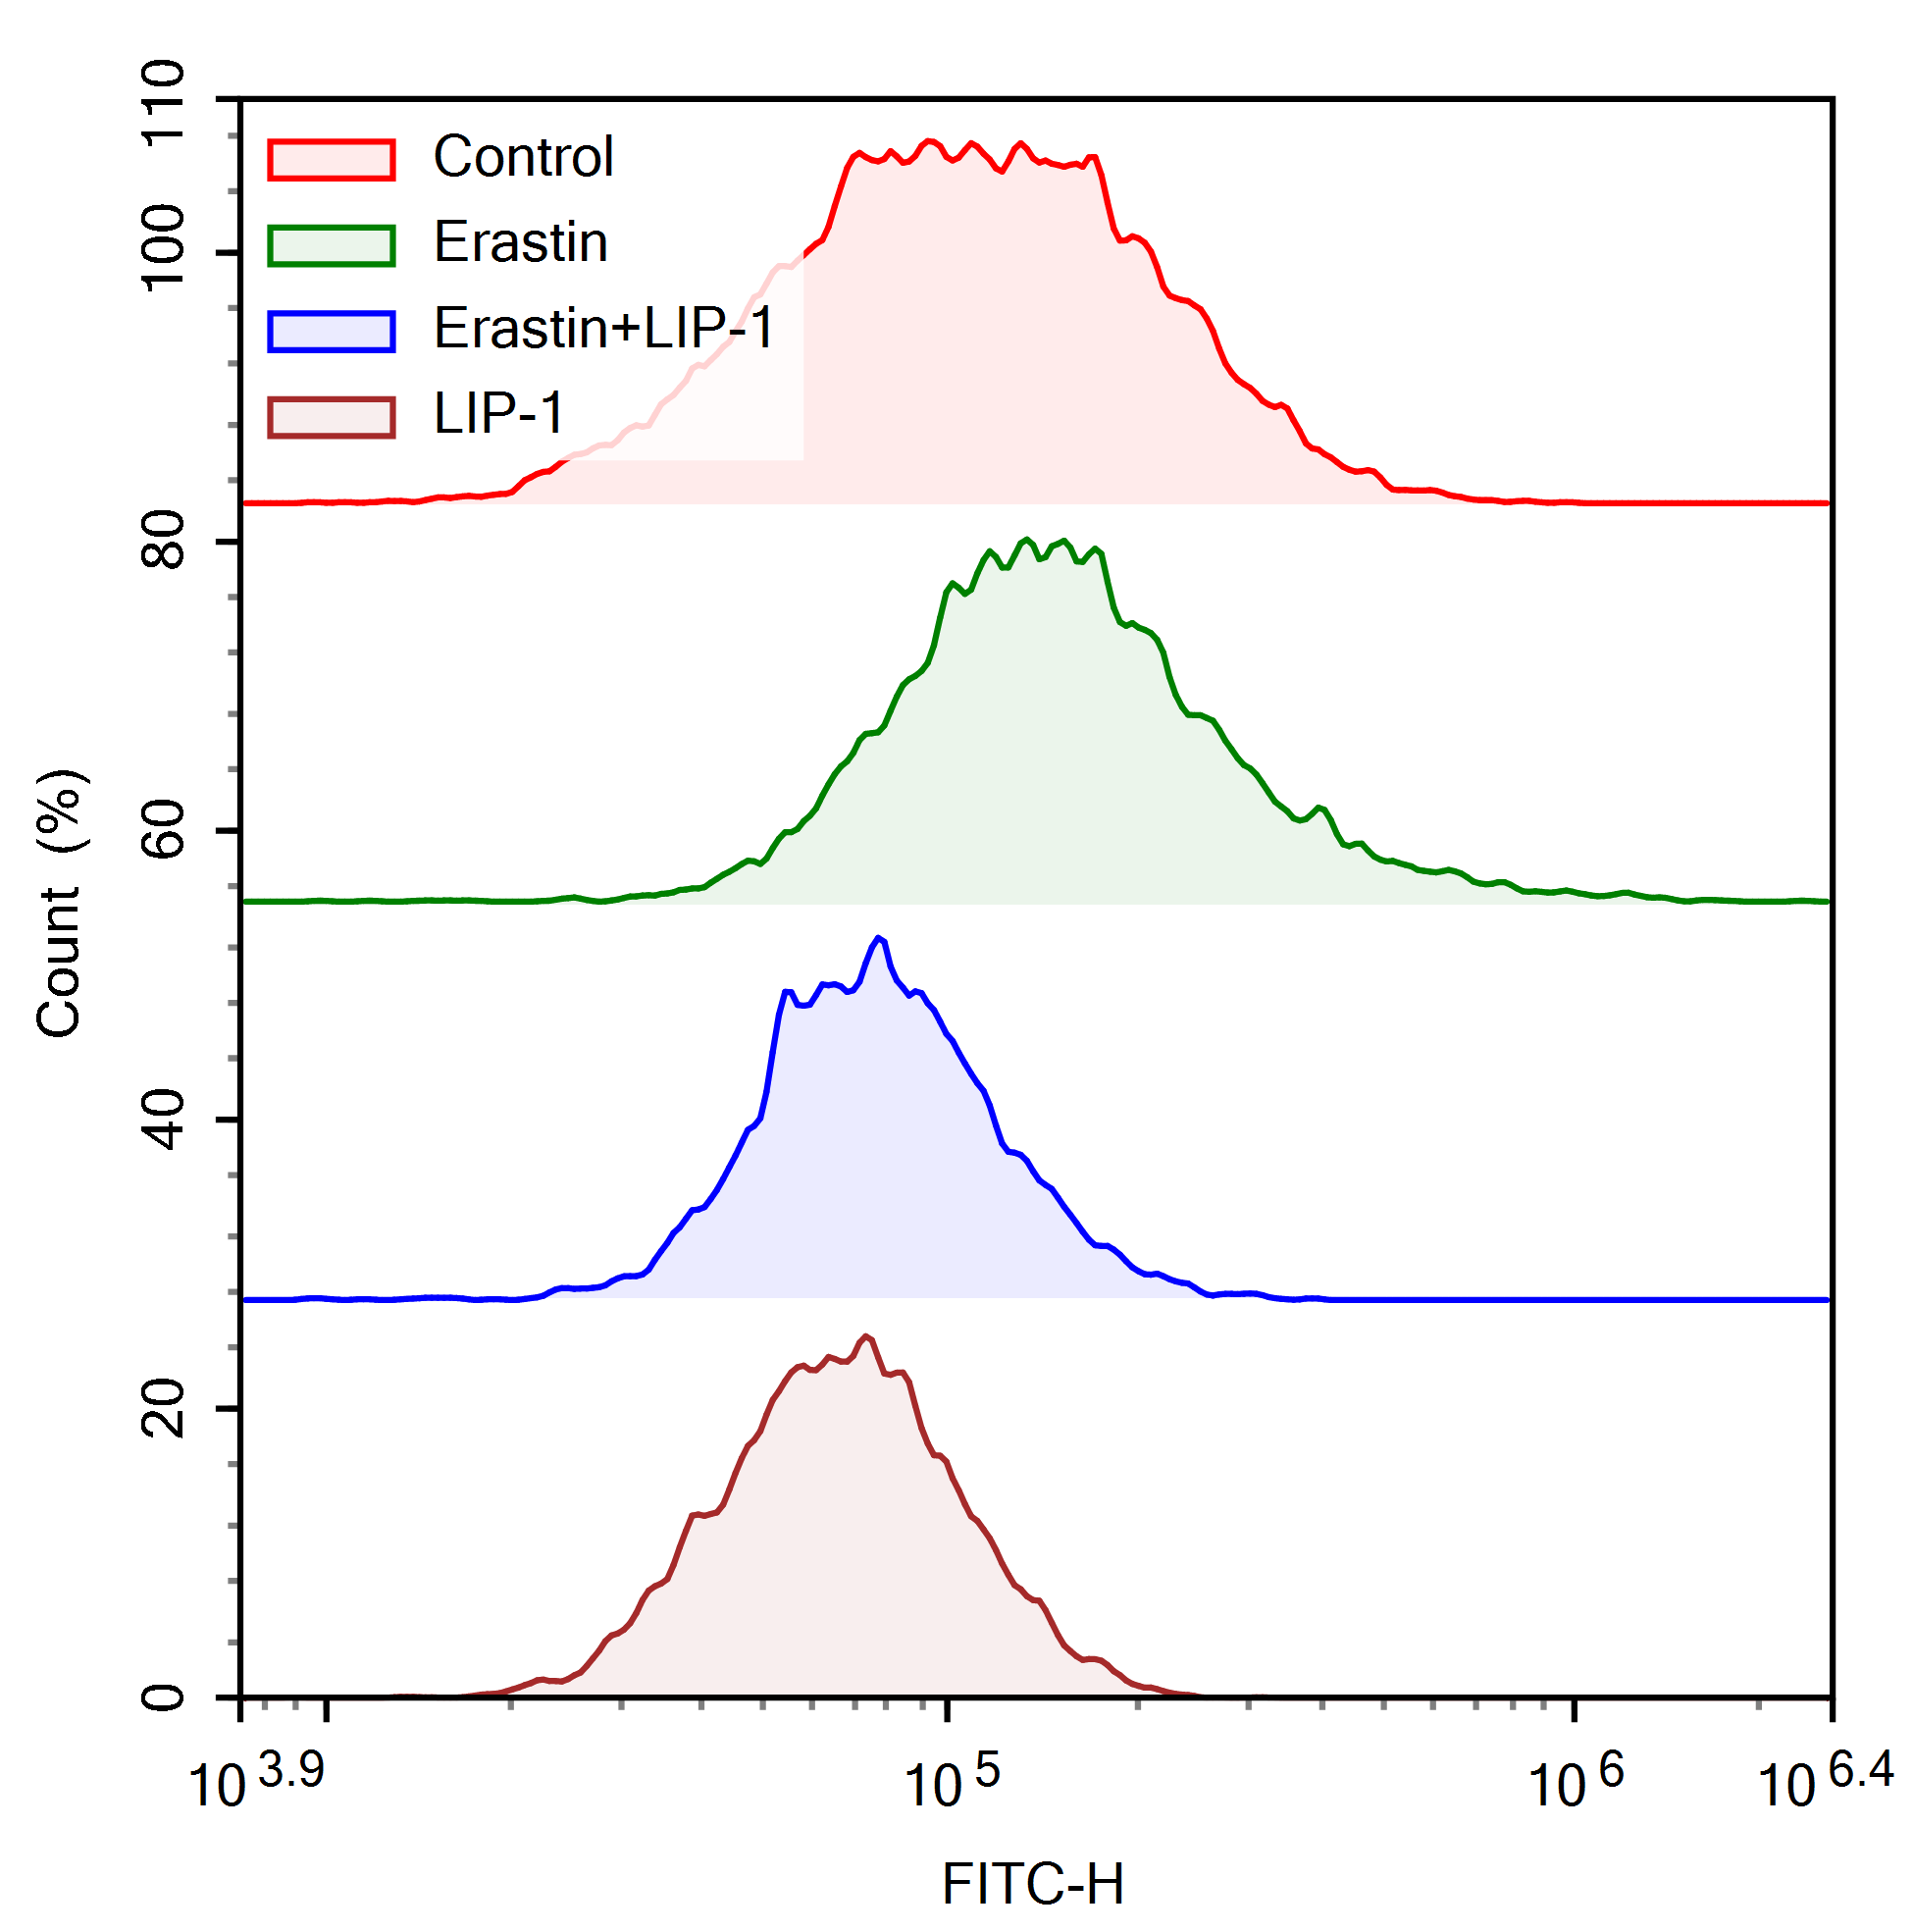
Fig. 4 Erastin treatment markedly increased LPO levels (FITC-H⁺ cells) in HepG2 cells across all tested concentrations, while co-treatment with Lip-1 effectively suppressed this elevation, restoring LPO to near-control levels. Lip-1 alone showed no obvious effect on basal LPO. These data indicate that Lip-1 reverses Erastin-induced lipid peroxidation.
06 Which redox biomarkers best distinguish signaling from oxidative stress?
In summary, Redox biology fails when one probe stands in for a complex state; the remedy is a tiered oxidative stress assay, each tier answering one question. Only the first two tiers are biomarkers proper: did flux change and where, read by compartment-targeted ratiometric sensors (HyPer) or validated probes with matched pH and potential controls; and was antioxidant capacity exceeded, read by GSH/GSSG, NADPH, aconitase and stable products outside the matrix[1,3]. Tiers three and four are causal controls rather than biomarkers: perturbation with targeted antioxidants or electron transport chain modulators, then genetic assignment of the source as in ND6 P25L macrophages and Uqcrfs1-deficient T cells[3,5,6]. The right panel follows the question: reversible signaling calls for H₂O₂ sensors and GSH/GSSG, resting on cysteine oxidation, not damage[1,4]. Cumulative stress calls for protein carbonyls, lipid hydroperoxides and isoprostane ratios, with F₂-isoprostane validated in plasma as in section 5[9]. Ferroptosis follows that section: C11-BODIPY ratios and GPX4/SLC7A11 status read against subcellular site, since ER and plasma membrane peroxidation decide the outcome[7,8]. No single marker is best in isolation; the minimum that separates signaling from stress is one reversible marker plus one damage marker plus perturbation[3]. Report fluorescence only as relative change, never as absolute concentration; no single probe should carry an oxidative stress assay[3]. Source-resolved flux, antioxidant status, damage markers and intervention give the operational line between the two and keep an oxidative stress assay honest about the state it reports.
Elabscience® Quick Overview of Popular Products:
Table 1. Assay kits for oxidative stress
|
Cat. No. |
Product Name |
|
E-BC-F001 |
Hydrogen Peroxide (H2O2) Fluorometric Assay Kit |
|
E-BC-K020-M |
Total Superoxide Dismutase (T-SOD) Activity Assay Kit (WST-1 Method) |
|
E-BC-F003 |
Lipid Peroxide LPO Fluorometric Assay Kit |
|
E-BC-F008 |
Mitochondrial Superoxide Fluorometric Assay Kit |
|
E-BC-K151-M |
Mitochondrial Complex Ⅲ Activity Assay Kit |
|
E-BC-K815-M |
NADPH Oxidase (NAO) Activity Colorimetric Assay Kit |
|
E-EL-H0109 |
Human TNF-α(Tumor Necrosis Factor Alpha) ELISA Kit |
|
E-EL-H0149 |
Human IL-1β(Interleukin 1 Beta) ELISA Kit |
|
E-EL-M0042 |
Mouse IL-2(Interleukin 2) ELISA Kit |
|
E-EL-H6154 |
Human IL-10(Interleukin 10)ELISA Kit |
|
E-BC-K030-M |
Reduced Glutathione (GSH) Colorimetric Assay Kit |
|
E-BC-K883-M |
Glutathione Peroxidase 4 GPX4 Activity Assay Kit |
|
E-BC-K138-F |
Reactive Oxygen Species (ROS) Fluorometric Assay Kit (Green) |
References:
[1] Sies, H., Hydrogen Peroxide as a Central Redox Signaling Molecule in Physiological Oxidative Stress: Oxidative Eustress.Redox Biology, 2017. 11:613-619 DOI: 10.1016/j.redox.2016.12.035
[2] Finkel, T., Signal Transduction by Mitochondrial Oxidants.Journal of Biological Chemistry, 2012. 287(7):4434-4440 DOI: 10.1074/jbc.r111.271999
[3] Kowaltowski, A.J., Strategies to Detect Mitochondrial Oxidants.Redox Biology, 2019. 21:101065 DOI: 10.1016/j.redox.2018.101065
[4] Simeoni, L., et al., Redox Regulation of T-Cell Receptor Signaling.Biological Chemistry, 2015. 396(5):555-569 DOI: 10.1515/hsz-2014-0312
[5] Sena, L.A., et al., Mitochondria Are Required for Antigen-Specific T Cell Activation through Reactive Oxygen Species Signaling.Immunity, 2013. 38(2):225-236 DOI: 10.1016/j.immuni.2012.10.020
[6] Casey, A.M., et al., Pro-inflammatory macrophages produce mitochondria-derived superoxide by reverse electron transport at complex I that regulates IL-1β release during NLRP3 inflammasome activation.Nature Metabolism, 2025. 7:493-507 DOI: 10.1038/s42255-025-01224-x
[7] von Krusenstiern, A.N., et al., Identification of essential sites of lipid peroxidation in ferroptosis.Nature Chemical Biology, 2023. 19:719-730 DOI: 10.1038/s41589-022-01249-3
[8] Murray, M.B., et al., Protocol for Detection of Ferroptosis in Cultured Cells.STAR Protocols, 2023. 4(3):102457 DOI: 10.1016/j.xpro.2023.102457
[9] van 't Erve, T.J., et al., Reinterpreting the Best Biomarker of Oxidative Stress: The 8-Iso-PGF2α/PGF2α Ratio Distinguishes Chemical from Enzymatic Lipid Peroxidation.Free Radical Biology and Medicine, 2015. 83:245-251 DOI: 10.1016/j.freeradbiomed.2015.03.004

