

Recognition of peptide antigens presented by major histocompatibility complex (MHC) molecules represents the defining event of adaptive T cell immunity. T cell receptors (TCRs) engage composite peptide–MHC (pMHC) surfaces through a conserved diagonal docking topology. Within this interaction, germline-encoded CDR1 and CDR2 loops contact MHC helices, while hypervariable CDR3 loops mediate peptide recognition. CD4 and CD8 co-receptors establish MHC class restriction by binding non-polymorphic regions of MHC class II and class I molecules, respectively, and recruiting the kinase Lck to the signaling complex. Cross-presentation, predominantly mediated by dendritic cells via the phagosome-to-cytosol route, shuttles exogenous antigens into the MHC class I pathway to prime antigen-specific CD8⁺ T cells. Co-receptor binding prolongs TCR–pMHC dwell time, stabilizes catch bond formation and boosts recognition sensitivity, while shaping the balance between sensitivity and antigen discrimination. Tumors disrupt antigen recognition by impairing MHC class I antigen presentation machinery and inducing chronic antigen stimulation that drives T cell exhaustion.
This review synthesizes current structural, biophysical and methodological insights into T cell antigen recognition. It covers events starting from initial TCR engagement, the functional consequences of impaired antigen recognition in tumors, and modern technologies applied to characterize antigen-specific T cells.
Table of Contents
1. How does TCR recognize peptide–MHC complexes?
2. How do CD4+ and CD8+ T cells recognize MHC class II and MHC class I?
3. How does cross-presentation activate antigen-specific CD8+ T cells?
4. How do co-receptors CD4 and CD8 strengthen TCR–pMHC interactions?
5. How does T cell antigen recognition change in the tumor microenvironment?
6. How can multidimensional flow cytometry profile antigen-specific T cells?
01 How does TCR recognize peptide–MHC complexes?
T cell antigen recognition is initiated when the T cell receptor (TCR) engages peptide–major histocompatibility complex (pMHC) molecules displayed on the surface of antigen-presenting cells (APCs). This recognition event is the critical checkpoint that determines whether a T cell will mount an immune response, as the TCR–pMHC interaction “dictates its function and thereby influences its role in disease”[1].
Structurally, the TCR is a heterodimeric membrane protein composed of α and β chains, each containing variable domains that form the antigen-binding site. Within the contact region between a T cell and its conjugated APC, TCRs scan pMHC complexes to identify foreign peptides embedded in the MHC binding groove[2]. A long-standing question in the field has concerned the stoichiometry of TCR complexes required for antigen recognition. Brameshuber and colleagues interrogated this question using single-molecule brightness analysis, photon-antibunching-based fluorescence correlation spectroscopy, and Förster resonance energy transfer (FRET) measurements, and found “exclusively monomeric TCR–CD3 complexes driving the recognition of antigenic pMHCs” [2]. This finding demonstrates the “exceptional capacity of single TCR–CD3 complexes to elicit robust intracellular signaling” [2], despite the fact that TCR:pMHC affinities are typically in the micromolar range[2].
The relative energetic contributions of TCR:peptide versus TCR:MHC contacts have important implications for understanding T cell development and function, yet they remain incompletely understood[3]. Using site-directed mutagenesis, Zhang et al. estimated the contribution of HLA-A2 side-chains to the binding of four distinct TCRs and found that these TCRs exhibit “very different energetic ‘footprints’ on HLA-A2, with no residues contributing to all TCR interactions”[3]. This variability highlights the degeneracy and flexibility inherent in TCR–pMHC recognition.
At the cellular level, antigen recognition is intimately coupled with the formation of the immunological synapse (IS), a structured interface between the T cell and the APC[4]. The IS is reinforced by cell adhesion molecules, which are thought to “shield both TCR and pMHC from mechanical forces” arising from cell motility and cytoskeletal dynamics[5]. Recent evidence further suggests that the effective affinity between TCRs and pMHC is actively modulated during the early steps of TCR signaling, and agent-based modeling has shown that “without any specific active mechanism, the observed affinity between receptors and ligands evolves over time and depends on the density of ligands”[4]. Centripetal transport driven by F-actin coupling has been proposed as a potential mechanism for this affinity modulation during IS formation[4].
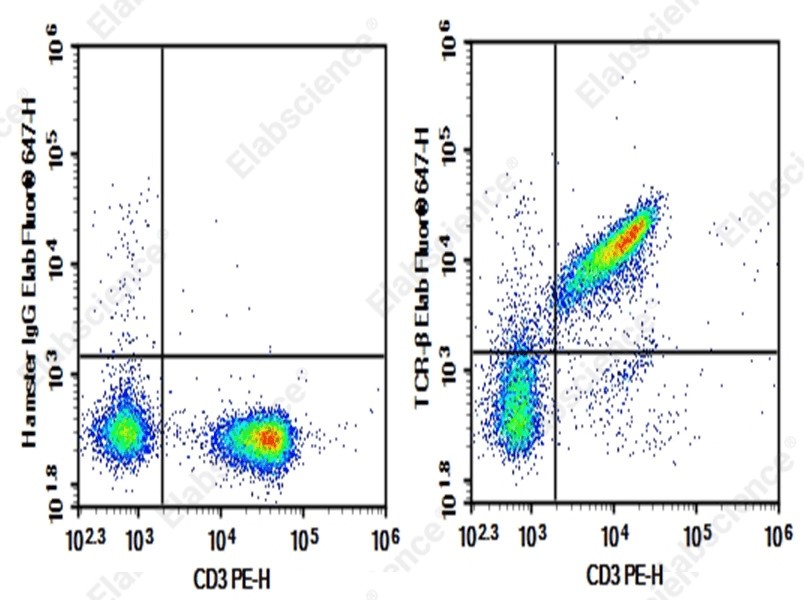
Fig. 1 Detection and analysis of TCRβ expression in mouse splenocytes. C57BL/6 mouse splenocytes were stained with 0.2 μg purified anti-mouse TCRβ antibody (clone H57-597, Functional Grade; right panel) and 0.2 μg Armenian hamster IgG, κ isotype control (left panel). Samples were subsequently incubated with Elab Fluor® 647-conjugated goat anti-Armenian hamster IgG secondary antibody, followed by anti-mouse CD3 PE-conjugated monoclonal antibody. (The data are provided by Elabscience®)
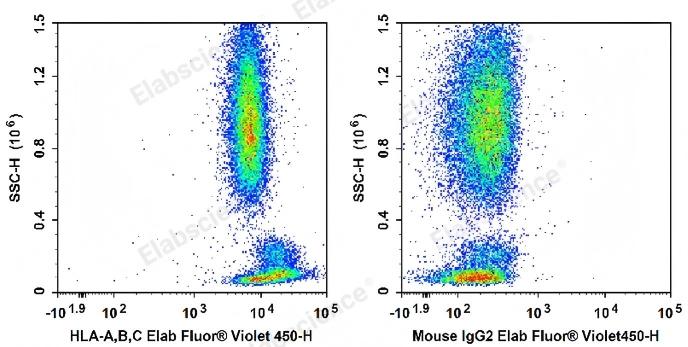
Fig. 2 Detection and analysis of HLA-A, B, C expression in human peripheral blood lymphocytes. Human peripheral blood lymphocytes are stained with Elab Fluor® Violet 450 Anti-Human/Monkey HLA-A, B, C Antibody (Left). Lymphocytes are stained with Elab Fluor® Violet 450 Mouse IgG2a, κ Isotype Control (Right). (The data are provided by Elabscience®)
Elabscience® Quick Overview of Popular Products:
Table 1. Reagents used for T cell antigen recognition research
|
Product Name |
Cat. No. |
|
Elab Fluor® Violet 450 Anti-Human/Monkey HLA-A,B,C Antibody[W6/32] |
E-AB-F1130Q |
|
Elab Fluor® 647 Anti-Mouse TCRβ Antibody[H57-597] |
E-AB-F1123M |
|
Human CD3/CD28 T Cell Activation Beads |
MIH001A |
|
PE Anti-Human/Monkey TCR γ/δ Antibody[B1] |
E-AB-F1145D |
|
PerCP/Cyanine5.5 Anti-Human CD3 Antibody[OKT-3] |
E-AB-F1001J |
|
APC Anti-Mouse MHC II (I-A/I-E) Antibody[M5/114] |
E-AB-F0990E |
|
Elab Fluor® 700 Anti-Mouse TCRβ Antibody[H57-597] |
E-AB-F1123UM1 |
|
Mouse CD3/CD28 T Cell Activation Beads |
MIM001A |
|
FITC Anti-Mouse TCR γ/δ Antibody[GL3] |
E-AB-F1282C |
|
PerCP/Cyanine5.5 Anti-Mouse CD3 Antibody[17A2] |
E-AB-F1013J |
|
Human IFN-γ (Interferon Gamma) ELISPOT Kit |
ESP-H0002 |
02 How do CD4+ and CD8+ T cells recognize MHC class II and MHC class I?
The division of labor between CD4+ helper T cells and CD8+ cytotoxic T cells is fundamentally governed by their differential recognition of MHC classes. This is the principle of MHC restriction: the TCR must simultaneously recognize both the specific antigenic peptide and the self-MHC molecule presenting it[6]. The immune system has evolved two parallel antigen presentation pathways to handle distinct categories of pathogenic threats[7].
MHC Class I and CD8+ T Cells. MHC class I molecules are expressed on virtually all nucleated cells and present endogenously derived peptides, typically 8–10 amino acids in length, to CD8+ cytotoxic T lymphocytes (CTLs)[6]. The closed architecture of the MHC class I peptide-binding groove constrains peptide length to short fragments[6]. When CD8+ T cells recognize viral or tumor-derived peptides displayed on MHC class I, they become activated and directly kill the presenting cell[8]. This surveillance mechanism enables CTLs to eliminate cells harboring intracellular pathogens or undergoing malignant transformation[9].
MHC Class II and CD4+ T Cells. MHC class II molecules are constitutively expressed primarily on professional APCs, including dendritic cells, macrophages, and B cells, and present exogenously derived peptides to CD4+ helper T cells[6]. The MHC class II binding groove is open-ended, accommodating longer peptides of 13–25 residues or more[6]. CD4+ T cells do not directly kill target cells; rather, upon antigen recognition they orchestrate broader immune responses by secreting cytokines that activate B cells, macrophages, and CD8+ T cells.
The establishment of MHC restriction occurs during T cell development in the thymus through positive selection, a process ensuring that only T cells capable of recognizing self-MHC molecules
survive and enter the periphery[10]. This educational mechanism produces a T cell repertoire that is simultaneously self-MHC-restricted and self-tolerant. The genetic polymorphism of MHC molecules, combined with the principle of MHC restriction, collectively determines an individual's susceptibility to infections, predisposition to autoimmune disease, and responsiveness to immunotherapies[10].
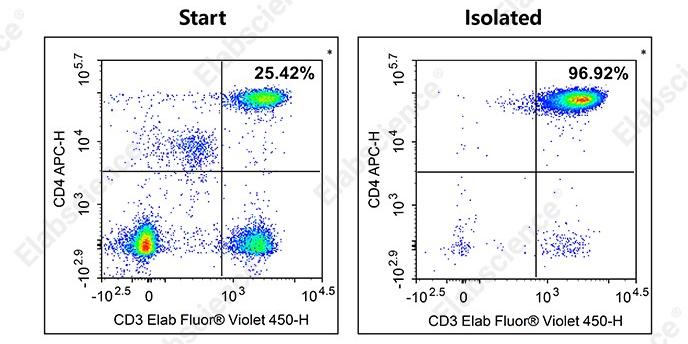
Fig. 3 Detection of CD4+ T cells isolated from human peripheral blood cells. CD4+ T cells were sorted from human peripheral blood cells using the EasySort™ Human CD4+ T Cell Isolation Kit (MIH002N), then stained with Elab Fluor® Violet 450 Anti-Human CD3 Antibody[OKT-3] (E-AB-F1001Q) and APC Anti-Human CD4 Antibody[SK3] (E-AB-F1352E). The purities of the initial unseparated population and final enriched CD4+ T cell fraction were 25.42% and 96.92%, respectively. (The data are provided by Elabscience®)
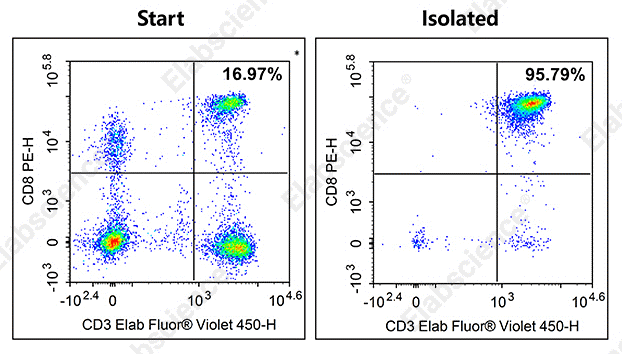
Fig. 4 Detection of CD8+ T cells isolated from human peripheral blood cells. CD8+ T cells were sorted from human peripheral blood cells using the EasySort™ Human CD8+ T Cell Isolation Kit (MIH003N), then stained with Elab Fluor® Violet 450 Anti-Human CD3 Antibody[OKT-3] (E-AB-F1001Q) and PE Anti-Human CD8a [HIT8a] (E-AB-F1271D). The purities of the initial unseparated population and final enriched CD8+ T cell fraction were 16.97% and 95.79%, respectively. (The data are provided by Elabscience®)
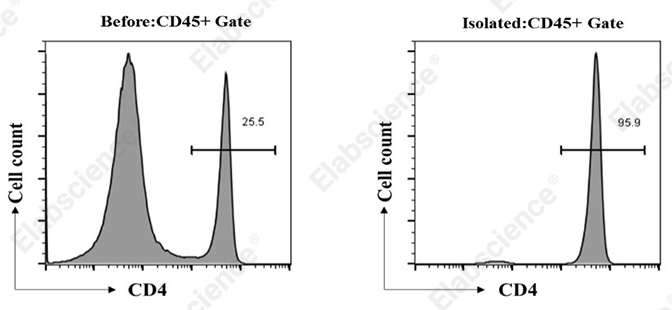
Fig. 5 Detection of CD4+ T cells isolated from mouse tissues. CD4+ T cells were isolated from splenocytes of C57BL/6 mice using the EasySort™ Mouse CD4+ T Cell Isolation Kit (MIM002N), then stained with ElabFluor® Violet 450 anti-mouse CD45 antibody (clone 30-F11) and PE anti-mouse CD4 antibody (clone GK1.5). The purities of the initial unseparated population and final enriched CD4+ T cell fraction were 25.5% and 95.9%, respectively. (The data are provided by Elabscience®)
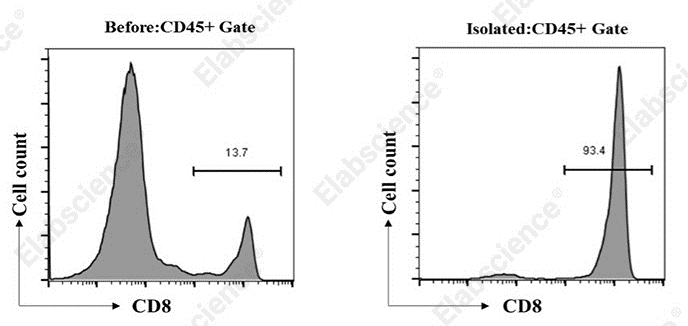
Fig. 6 Detection of CD8+ T cells isolated from mouse tissues. CD8+ T cells were sorted from C57BL/6 mice splenocyte using the EasySort™ Mouse CD8+ T Cell Isolation Kit (MIM003N), then stained with ElabFluor® Violet 450 anti-mouse CD45 antibody (clone 30-F11) and PE anti-mouse CD8 antibody (clone 53-6.7). The purities of the initial unseparated population and final enriched CD4+ T cell fraction were 13.7% and 93.4%, respectively. (The data are provided by Elabscience®)
Elabscience® Quick Overview of Popular Products:
Table 2. Reagents used for T cell research
|
Product Name |
Cat. No. |
|
EasySort™ Mouse CD4+T Cell Isolation Kit |
MIM002N |
|
EasySort™ Human CD4+ T Cell Isolation Kit |
MIH002N |
|
EasySort™ Human CD8+ T Cell Isolation Kit |
MIH003N |
|
EasySort™ Mouse CD8+T Cell Isolation Kit |
MIM003N |
|
Elab Fluor® Violet 450 Anti-Mouse CD45 Antibody[30-F11] |
E-AB-F1136Q |
|
PE Anti-Mouse CD4 Antibody[GK1.5] |
E-AB-F1097D |
|
PE Anti-Mouse CD8a Antibody[53-6.7] |
E-AB-F1104D |
|
Human PBMC Separation Solution(P 1.077) |
E-CK-A103 |
|
10×ACK Lysis Buffer |
E-CK-A105 |
|
10× RBC Lysis/Fixation Solution |
E-CK-A106 |
03 How does cross-presentation activate antigen-specific CD8+ T cells?
Cytotoxic CD8+ T cells can kill any virus-infected or tumor cell displaying antigenic peptides on MHC class I molecules[9]. However, tumor cells and virus-infected cells generally cannot present antigens in a sufficiently stimulatory manner to prime naïve CD8+ T cells to become effector CTLs[9]. This priming function is the responsibility of conventional dendritic cells (cDCs), which serve as a bridge between innate and adaptive immunity through a specialized pathway known as cross-presentation.
Cross-presentation is defined as the process by which cDCs capture exogenous cell-associated antigens and present them on MHC class I molecules to naïve CD8+ T cells, while simultaneously providing the requisite costimulatory signals[9]. This pathway is essential for generating CTL responses against tumors and viruses that do not directly infect dendritic cells, and it underlies the efficacy of many vaccine strategies. Despite its fundamental importance for antitumor and antiviral immunity, the molecular mechanisms governing cross-presentation remain incompletely elucidated[9].
Emerging evidence implicates innate immune receptors in the regulation of cross-presentation. Corridoni and Simmons have shown that NOD2, a cytosolic NLR family member, enhances cross-presentation in dendritic cells and thereby boosts CD8+ T cell activation[12]. This finding expands the functional repertoire of innate immune receptors beyond their canonical roles in pathogen recognition and into the direct modulation of adaptive immune priming[9].
The identification of additional molecular regulators of cross-presentation remains an active area of investigation with direct implications for vaccine design and cancer immunotherapy[9]. In relevant experimental workflows, researchers use a CD8+ T cell isolation kit for lymphocyte purification, alongside anti-MHC I antibody and anti-MHC II antibody for sample staining in T cell phenotyping.
%20maturation_%20.jpg)
Fig. 7 Flow cytometric analysis of dendritic cell (DC) maturation. Bone marrow-derived DCs from C57BL/6 mice were exposed to maturation stimuli, which significantly increased the expression of MHC II, CD80, CD40 and CD86. (The data are provided by Elabscience®)
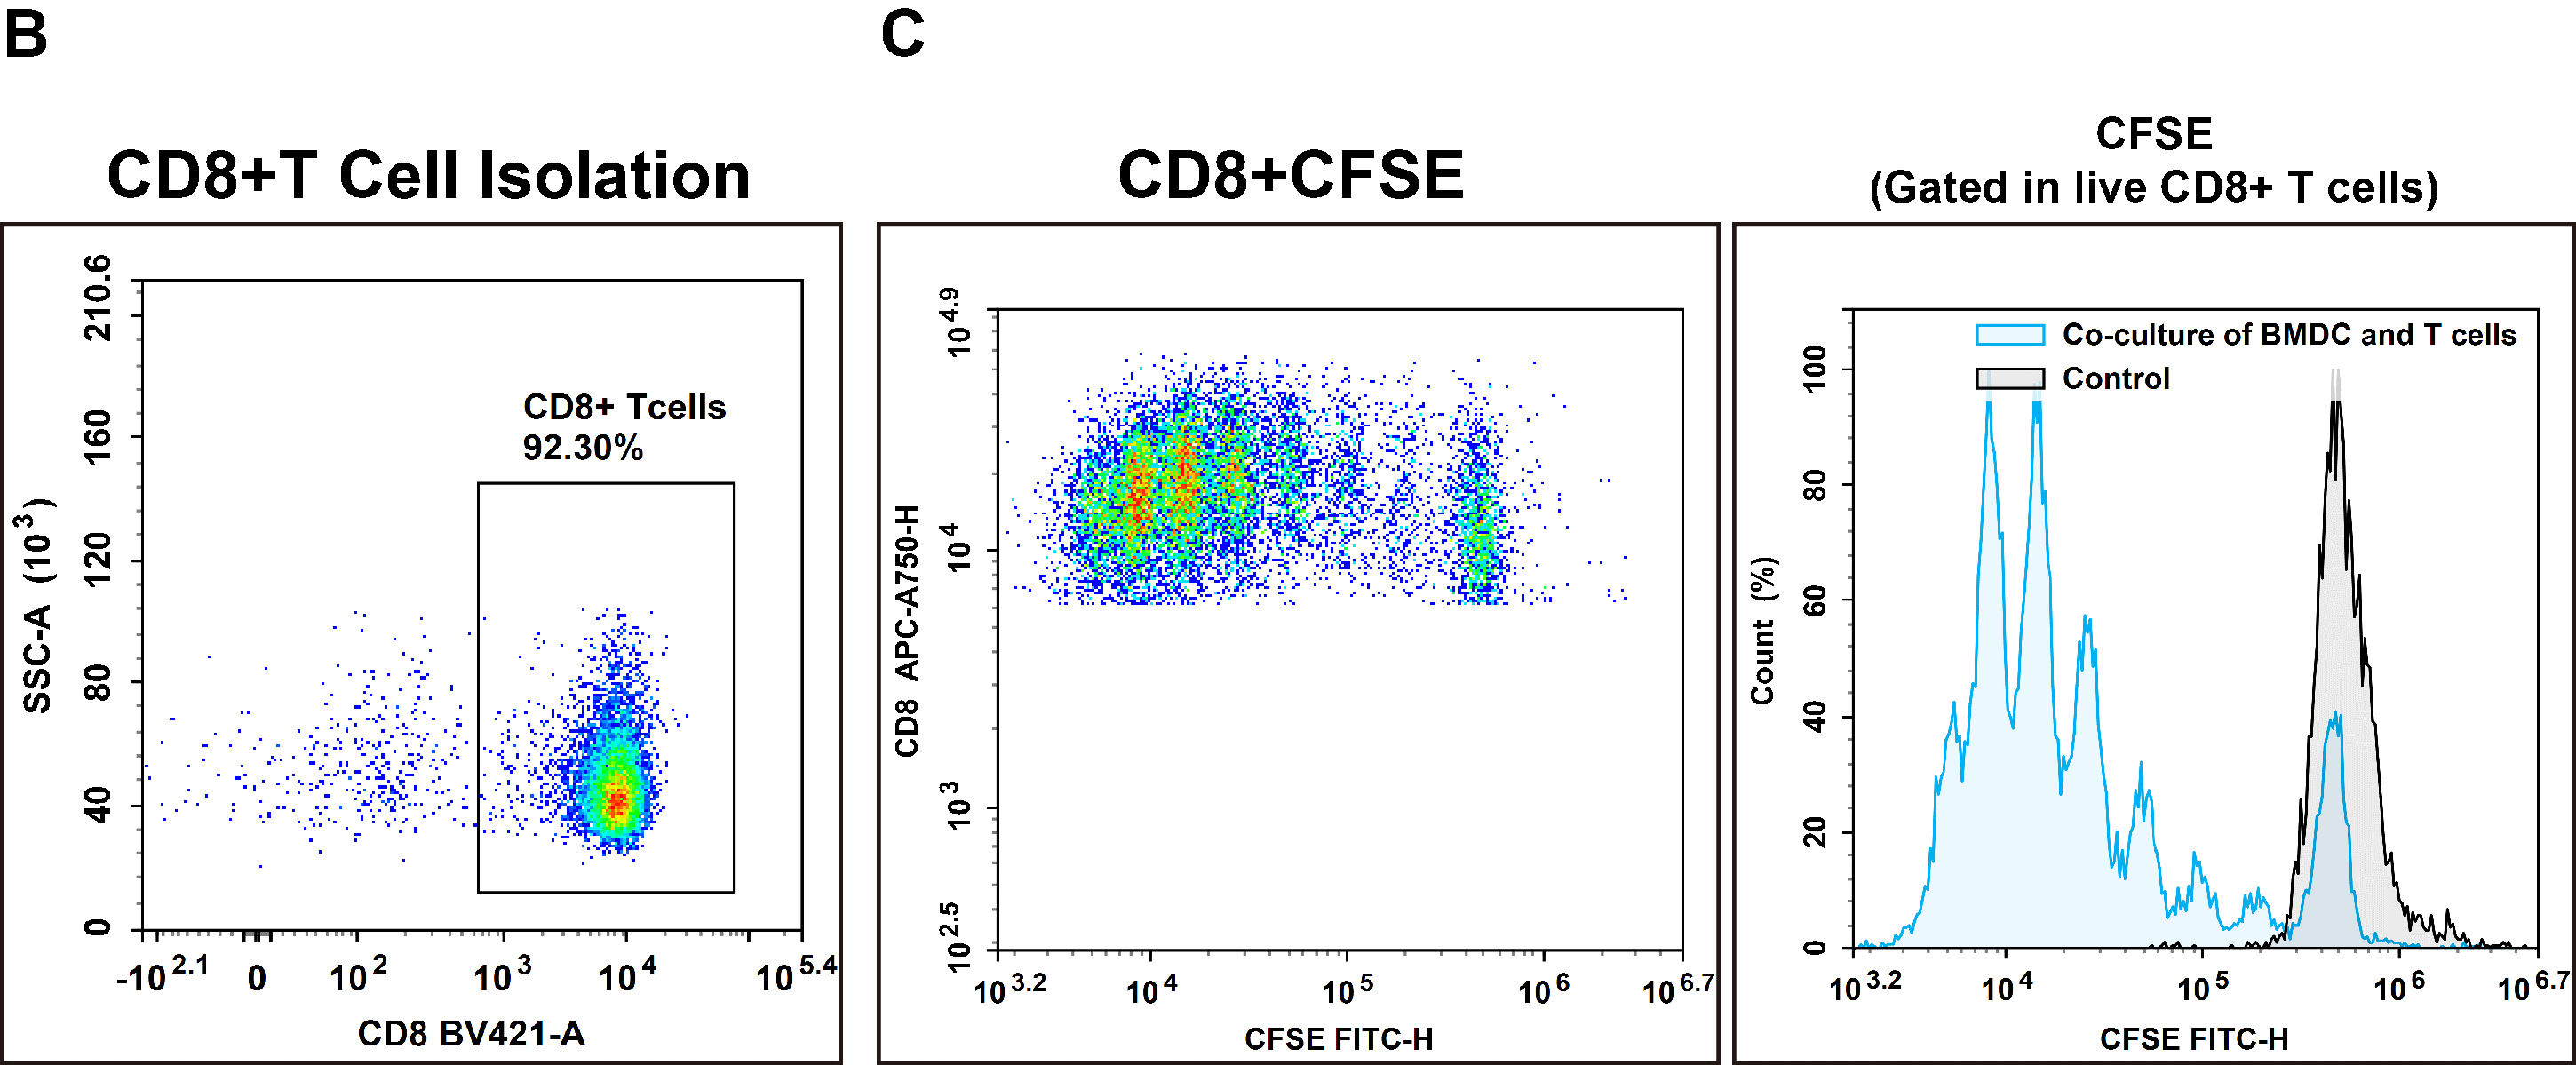
Fig. 8 Interaction between T cells and bone marrow-derived dendritic cells (BMDCs). CD8+ T cells were isolated from the splenocytes of C57BL/6 mice using EasySort™ Mouse CD8+T Cell Isolation Kit (cat. no. MIM003N). The purity of the isolated CD8+ T cells was verified by flow cytometry. Following CFSE labeling, CD8+ T cells were co‑cultured with mature BMDCs for 72 h in vitro, and the proliferation of CD8+ T cells was subsequently assessed. (The data are provided by Elabscience®)
Elabscience® Quick Overview of Popular Products:
Table 3. Reagents for DC-T cell co-culture
|
Product Name |
Cat. No. |
|
EasySort™ Mouse CD8+T Cell Isolation Kit |
MIM003N |
|
EasySort™ Mouse CD3+T Cell Isolation Kit |
MIM001N |
|
EasySort™ Mouse CD4+T Cell Isolation Kit |
MIM002N |
|
EasySort™ Human CD3+T Cell Isolation Kit |
MIH001N |
|
EasySort™ Human CD4+ T Cell Isolation Kit |
MIH002N |
|
EasySort™ Human CD8+ T Cell Isolation Kit |
MIH003N |
|
EasySort™ Human Naïve Pan T Cell Isolation Kit |
MIH006N |
|
EasySort™ Human Naïve CD4+T Cell Isolation Kit |
MIH007N |
|
EasySort™ Human Naïve CD8+T Cell Isolation Kit |
MIH008N |
|
EasySort™ Mouse Pan-Naïve T Cell Isolation Kit |
MIM006N |
|
EasySort™ Mouse Naïve CD4+T Cell Isolation Kit |
MIM007N |
|
EasySort™ Mouse Naïve CD8+T Cell Isolation Kit |
MIM008N |
|
EasySort™-5 Magnet |
EC001 |
|
Mouse Bone Marrow-derived Dendritic Cells (BMDC) Induction and Identification Kit |
XJM003 |
|
FITC Anti-Mouse CD3 Antibody[17A2] |
E-AB-F1013C |
|
Elab Fluor® Violet 450 Anti-Mouse CD8a Antibody[53-6.7] |
E-AB-F1104Q |
|
Caspase 3/7 Activity Detection Substrate for Flow Cytometry |
E-CK-A483 |
|
Caspase 3/7 and Annexin V Double Staining Apoptosis Kit |
E-CK-A831 |
|
Caspase 1 Activity Detection Substrate for Flow Cytometry |
E-CK-A481 |
|
Reactive Oxygen Species (ROS) Fluorometric Assay Kit (Red) |
E-BC-F005 |
|
Lactate Dehydrogenase (LDH) Cytotoxicity Colorimetric Assay Kit |
E-BC-K771-M |
|
CellaQuant™ Mouse TNF-α (Tumor Necrosis Factor Alpha) ELISA Kit |
CQM002 |
|
CellaQuant™ Mouse IL-2 (Interleukin 2) ELISA Kit |
CQM006 |
|
CellaQuant™ Mouse IFN-γ (Interferon Gamma) ELISA Kit |
CQM005 |
04 How do co-receptors CD4 and CD8 strengthen TCR–pMHC interactions?
The co-receptors CD4 and CD8 are transmembrane glycoproteins that bind to invariant regions of MHC class II and MHC class I molecules, respectively, and play essential roles in stabilizing TCR–pMHC interactions and facilitating signal transduction. The recognition of a cognate TCR ligand leads to TCR–co-receptor engagement at the pMHC interface, with TCR signaling occurring in both the presence and absence of CD4 or CD8 co-receptor engagement[11].
The co-receptors strengthen antigen recognition through two principal mechanisms. First, they enhance the physical avidity of the T cell–APC interaction by binding to the same pMHC complex that engages the TCR, effectively increasing the dwell time of the ternary complex. Second, the cytoplasmic tails of CD4 and CD8 are associated with the Src-family tyrosine kinase Lck. When co-receptors are recruited to the TCR–pMHC complex, Lck is brought into proximity with the immunoreceptor tyrosine-based activation motifs (ITAMs) of the CD3 chains, initiating the phosphorylation cascade that constitutes the earliest biochemical events of T cell activation. Mørch and colleagues have reviewed how TCR signaling proceeds with co-receptor participation and how "TCR–peptide-MHC interactions in situ show accelerated" dynamics when co-receptors are engaged[11].
The differential expression of CD4 and CD8 on mature T cells is not merely correlative but functionally instructive: CD8 binds specifically to the α3 domain of MHC class I heavy chains, while CD4 binds to the β2 domain of MHC class II molecules. This lock-and-key specificity ensures that CD8+ T cells respond exclusively to MHC class I–restricted antigens (intracellular pathogens, tumor antigens) and CD4+ T cells to MHC class II–restricted antigens (extracellular pathogens), reinforcing the functional specialization of T cell subsets.
_.png)
Fig. 9 Analysis of IFN-γ and IL-4 production in human peripheral blood mononuclear cells (PBMCs). Peripheral blood mononuclear cells (PBMCs) were treated with Cell Stimulation MIX and Protein Transport Inhibitor MIX for 5 hours, then were harvested, fixed, and permeabilized, followed by staining with PerCP/Cyanine5.5 Anti-Human CD3, Elab Fluor® 488 Anti-Human CD4, PE Anti-Human IL-4 and APC Anti-Human IFN-γ for analysis of the proportion of Th1/Th2 cells and their functional capacity to secrete the effector cytokine IFN-γ or IL-4. Th1 cells were defined by the phenotype CD3+CD4+IFN-γ+, Th2 cells were defined by the phenotype CD3+CD4+IL-4+. (The data are provided by Elabscience®)
Elabscience® Quick Overview of Popular Products:
Table 4. Reagents for T Cell cytokine secretion assays
|
Product Name |
Cat. No. |
|
Mouse Th17 Flow Cytometry Staining Kit |
XJM002 |
|
Mouse Th1/Th2 Flow Cytometry Staining Kit |
XJM001 |
|
Human Th1/Th2 Flow Cytometry Staining Kit |
XJH001 |
|
Human Th17 Flow Cytometry Staining Kit |
XJH002 |
|
Cell Staining Buffer |
E-CK-A107 |
|
Cell Stimulation and Protein Transport Inhibitor Kit |
E-CK-A091 |
|
Intracellular Fixation/Permeabilization Buffer Kit |
E-CK-A109 |
05 How does T cell antigen recognition change in the tumor microenvironment?
The tumor microenvironment (TME) imposes multiple layers of impairment on T cell antigen recognition, collectively contributing to immune evasion. A central mechanism is the downregulation of MHC class I molecules on tumor cells. As noted in recent literature, viruses and cancer cells frequently escape immune surveillance by downregulating MHC class I expression[7]. Reduced MHC class I surface expression directly diminishes the density of antigenic pMHC ligands available for TCR engagement, thereby raising the threshold for T cell activation[9]. In related immunological studies, researchers employ a CD4+ T cell isolation kit and a CD8+ T cell isolation kit to purify lymphocyte populations. The anti-MHC I antibody and anti-MHC II antibody are routinely used as staining reagents within a T cell flow cytometry panel to support T cell phenotyping.
Beyond MHC downregulation, the TME is characterized by multiple additional immunosuppressive features that compromise antigen recognition: the accumulation of regulatory T cells (Tregs), the production of immunosuppressive cytokines (IL-10, TGF-β), the expression of immune checkpoint ligands (PD-L1, CTLA-4 ligands), metabolic competition for nutrients, and hypoxia-driven acidification. The TCR–pMHC interaction that dictates its function and thereby influences its role in disease is thus subject to perturbation at multiple levels, ranging from the availability of peptide–MHC ligands to the biochemical context in which recognition occurs.
The recent advances in high-throughput sequencing, mass cytometry, microfluidics, and computational biology discussed by Joglekar and Li have created opportunities to map the antigenic landscape of T cell responses within tumors[1]. However, the absence of robust approaches for comprehensive antigen discovery has historically restricted the fundamental understanding of the antigenic landscape of the overall T cell response[1], and this challenge is magnified in the heterogeneous and dynamic TME. Current research efforts focus on identifying tumor-specific neoantigens, elucidating the regulatory mechanisms of antigen presentation machinery in cancer cells, and developing strategies to restore effective T cell recognition within the immunosuppressive tumor milieu.
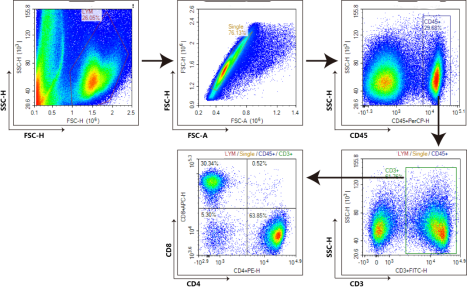
Fig. 10 Detection of tumor-associated T cells in 4T1 xenografts from BALB/c mice. Thirteen days after subcutaneous 4T1 cell injection into the neck of BALB/c mice, tumor tissues were harvested and enzymatically digested to prepare single-cell suspensions. Tumor-infiltrating T cells were analyzed by flow cytometry with a viability dye and antibodies against CD45, CD3, CD4, and CD8. (The data are provided by Elabscience®)
Elabscience® Quick Overview of Popular Products:
Table 5. Reagents for T cell research in the tumor microenvironment
|
Product Name |
Cat. No. |
|
PerCP Anti-Mouse CD45 Antibody[30-F11] |
E-AB-F1136F |
|
FITC Anti-Mouse CD3 Antibody[17A2] |
E-AB-F1013C |
|
PE Anti-Mouse CD4 Antibody[GK1.5] |
E-AB-F1097D |
|
APC Anti-Mouse CD8a Antibody[53-6.7] |
E-AB-F1104E |
|
EasyStain™ Human TBNK 6-color Cocktail Set 1 |
E-AB-FC0024 |
|
Anti-Human CD45-FITC/CD3-PE/Cyanine5/CD4-PE/CD8-PE/Elab Fluor® 594 Cocktail |
E-AB-FC0029 |
|
Anti-Human CD3-APC/CD4-FITC/CD8a-PE Cocktail |
E-AB-FC0008 |
|
Anti-Human CD3-APC/CD4-FITC/CD8a-PerCP-Cyanine5.5 Cocktail |
E-AB-FC0002 |
|
Cell Staining Buffer |
E-CK-A107 |
|
Cell Stimulation and Protein Transport Inhibitor Kit |
E-CK-A091 |
|
Intracellular Fixation/Permeabilization Buffer Kit |
E-CK-A109 |
06 How can multidimensional flow cytometry profile antigen-specific T cells?
The detection and characterization of antigen-specific T cells have been revolutionized by MHC multimer technologies combined with flow cytometry. For more than two decades, pMHC tetramers analyzed by flow cytometry have been the gold standard for detecting CD8+ and CD4+ T cells specific to antigens presented in the context of MHC class I and class II, respectively[12]. The seminal breakthrough was reported by Altman et al., who demonstrated that tetramerization of pMHC class I molecules provided sufficient stability to TCR–pMHC interactions to enable detection of MHC multimer-binding T cells by flow cytometry[13]. Since then, the scientific community has pursued expanding the capacity of MHC multimer-based detection technologies to facilitate large-scale epitope discovery and immune monitoring in limited biological material[13].
From Conventional Flow Cytometry to Mass Cytometry. A significant advance has been the integration of pMHC tetramers with mass cytometry (cytometry by time of flight, CyTOF), which has enabled far more comprehensive profiling of antigen-specific T cell responses than conventional fluorescence-based approaches[12]. Mass cytometry utilizes metal isotope-labeled probes, circumventing the spectral overlap limitations inherent in fluorophore-based detection and permitting simultaneous measurement of over 40 parameters. This capability has enabled ex vivo screening of CD8+ T cell reactivities against hundreds of MHC class I–restricted candidate epitopes[12]. However, MHC class II molecules have proven more challenging to combine with mass cytometry, as they are structurally more complex and bind with lower affinities to cognate TCRs than MHC class I molecules[12].
Automated Analysis and Inter-Laboratory Standardization. Manual analysis of flow cytometry data and subjective gate-border decisions remain a significant source of variation in the assessment of antigen-specific T cells, both across laboratories and over time within individual laboratories[14]. The challenge is compounded by the fact that MHC multimer-binding T cell populations are often rare and therefore difficult to detect reliably[14]. Automated computational approaches, including FLOw Clustering without K (FLOCK), Scalable Weighted Iterative Flow-clustering Technique (SWIFT), and ReFlow, have been applied to flow cytometry data collected from 28 laboratories and exhibit great potential to reduce technical variation across different experimental facilities[14]. These automated strategies represent an attractive solution to decrease subjectivity and improve reproducibility in antigen-specific T cell quantification[14].
Emerging High-Dimensional Approaches. The field continues to evolve toward higher-dimensional profiling. Novel spectral high-dimensional flow cytometry assays now enable combinatorial MHC class I tetramer staining combined with deep antigen-specific CD8+ T cell phenotyping[8]. In parallel, DNA barcode-labeled pMHC multimers have been developed to screen over 1,000 peptide specificities in a single sample, allowing detection of low-frequency CD8+ T cells specific for virus- or cancer-restricted antigens[15]. These technological advances, coupled with automated computational analysis pipelines, are progressively moving the field toward comprehensive, standardized, and high-throughput immune monitoring of antigen-specific T cell responses in both research and clinical settings.
In conclusion, T cell antigen recognition is a multilayered process spanning molecular, cellular, and systems-level phenomena. At the molecular level, monomeric TCR–CD3 complexes engage pMHC ligands with remarkable sensitivity[2], and co-receptors CD4 and CD8 enhance both the stability and signaling capacity of these interactions[11]. The CD4/CD8 dichotomy maps functionally onto the MHC class II/class I pathways, ensuring appropriate immune responses to extracellular and intracellular threats. Cross-presentation by dendritic cells provides an essential bridge for priming CD8+ T cell responses against tumors and viruses that evade direct DC infection[9]. In the tumor microenvironment, multiple mechanisms converge to impair antigen recognition, and understanding these processes is critical for developing effective immunotherapies. Finally, advances in multidimensional flow and mass cytometry, combined with automated analysis, are enabling increasingly comprehensive profiling of antigen-specific T cells with direct translational relevance for vaccine development, cancer immunotherapy, and autoimmune disease management[12].
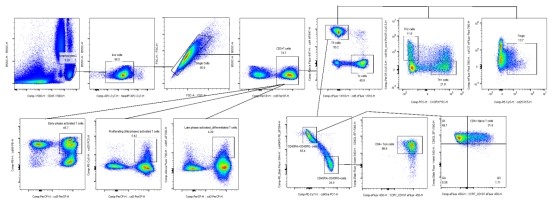
Fig. 11 16-color full-spectrum analysis of human peripheral blood T cells. T cell subsets in human peripheral blood were detected using a spectral flow cytometer (Agilent NovoCyte Opteon VBRY), and the data were analyzed with FlowJo software. (The data are provided by Elabscience®)
Elabscience® Quick Overview of Popular Products:
Table 6. Marker Panel and Fluorochrome Assignment
|
Marker |
Clonal |
Fluorochrome |
Cat. No. |
|
CD8 |
OKT-8 |
Elab Fluor® Violet 610 |
E-AB-F1110T |
|
CCR7/CD197 |
G043H7 |
Elab Fluor® Violet 450 |
E-AB-F1159Q |
|
CD3 |
OKT-3 |
Percp |
E-AB-F1001F |
|
CD4 |
SK3 |
Elab Fluor® 647 |
E-AB-F1352M |
|
CD45RA |
HI100 |
PE/Cyanine7 |
E-AB-F1052H |
|
CD45 |
HI30 |
Elab Fluor® Violet 500 |
E-AB-F1137R |
|
CD28 |
CD28.2 |
APC |
E-AB-F1195E |
|
CD69 |
FN50 |
PE |
E-AB-F1138D |
|
CD45RO |
UCHL1 |
PE/Elab Fluor® 594 |
E-AB-F1139P |
|
CD95 |
DX2 |
Elab Fluor® 700 |
E-AB-F1168M1 |
|
CD25 |
BC96 |
PE/Cyanine5 |
E-AB-F1194G |
|
CD127 |
A019D5 |
Elab Fluor® Red 780 |
E-AB-F1152S |
|
CD62L |
DREG56 |
Elab Fluor® Violet 540 |
E-AB-F1051T3 |
|
CD183/CXCR3 |
G025H7 |
FITC |
E-AB-F1156C |
|
CD194/CCR4 |
L291H4 |
PerCP/Cyanine5.5 |
E-AB-F1366J |
|
Live/Dead |
/ |
STYX™ Near-IR |
E-CK-A168 |
References:
[1] JOGLEKAR A V, LI G. T cell antigen discovery[J]. Nature Methods, 2021, 18(8): 873-880.
[2] BRAMESHUBER M, KELLNER F, ROSSBOTH B K, et al. Monomeric TCRs drive T cell antigen recognition[J]. Nature Immunology, 2018, 19(5): 487-496.
[3] ZHANG H, LIM H S, KNAPP B, et al. The contribution of major histocompatibility complex contacts to the affinity and kinetics of T cell receptor binding[J]. Scientific Reports, 2016, 6(1).
[4] SIOKIS A, ROBERT P A, MEYER-HERMANN M. Agent-Based Modeling of T Cell Receptor Cooperativity[J]. International Journal of Molecular Sciences, 2020, 21(18): 6473.
[5] Huppa J B ,Schütz, Gerhard J.T‐cell antigen recognition: catch‐as‐catch‐can or catch‐22?[J].EMBO Journal, 2023, 42(7).DOI:10.15252/embj.2023113507.
[6] Raymond M , Balthazard R , Zahn A ,et al.Ubiquitination of MHC class II molecules regulates B-cell development and response to antigens in mice[J].The Journal of Immunology, 2026, 215(1).
[7] Askonas B A , Openshaw P J M .MHC and antigen presentation[J].Immunology Today, 1989, 10(12):396-397.
[8] Pratcher W , Takahashi C , Lorenzo M ,et al.Novel Spectral High‐Dimensional Flow Cytometry Assay for Combinatorial MHC Class I Tetramer Staining and Deep Antigen‐Specific CD8 T Cell Phenotyping[J].Cytometry. Part A, 2025, 107(9)
[9] RAWAT K, JAKUBZICK C V. Channeling antigens to CD8+T cells[J]. Science, 2023, 380(6651): 1218-1219.
[10] Piepenbrink K H , Blevins S J , Scott D R ,et al.The basis for limited specificity and MHC restriction in a T cell receptor interface[J].Nature Communications, 2013, 4.
[11] Mrch A M ,tefan.Bálint, Santos A M ,et al.Coreceptors and TCR Signaling - the Strong and the Weak of It[J].Frontiers in cell and developmental biology, 2020, 8:597627.
[12] CHRISTOPHERSEN A. Peptide‐MHC class I and class II tetramers: From flow to mass cytometry[J]. HLA, 2020, 95(3): 169-178.
[13] BENTZEN A K, HADRUP S R. Evolution of MHC-based technologies used for detection of antigen-responsive T cells[J]. Cancer Immunology, Immunotherapy, 2017, 66(5): 657-666.
[14] PEDERSEN N W, CHANDRAN P A, QIAN Y, et al. Automated Analysis of Flow Cytometry Data to Reduce Inter-Lab Variation in the Detection of Major Histocompatibility Complex Multimer-Binding T Cells[J]. Frontiers in Immunology, 2017, 8.
[15] Bentzen A K , Marquard A M , Lyngaa R ,et al.Large-scale detection of antigen-specific T cells using peptide-MHC-I multimers labeled with DNA barcodes[J].Nature Biotechnology, 2016.

