The flow cytometry apoptosis assay is of great significance for both basic research and translational medicine. This article systematically reviews the application strategies and optimization points of four mainstream apoptosis detection methods in multi-color flow cytometry: The annexin v staining protocol emphasizes reducing the need for compensation through dye combination and spectral analysis, enabling accurate distinction between early apoptosis and necrosis. The TUNEL method is used for quantitative analysis of DNA breaks in late apoptosis and introduces its application in tumor research and reproductive medicine. The jc-1 assay method, based on ratio-based detection of mitochondrial membrane potential changes, has wide applicability and multi-parameter analysis capabilities. The live cell caspase reporter system supports real-time dynamic monitoring of the initiation and execution of apoptosis. In addition, this article also discusses common biomarkers in tumor immunology and cell therapy research, as well as combined strategies for detecting the apoptosis process.
Table of Contents
1. How can Annexin V panels be optimized for multicolor flow cytometry?
2. TUNEL assay applications in DNA fragmentation analysis by flow cytometry
3. Why is JC-1 still widely used for mitochondrial apoptosis detection?
4. Real-time detection of apoptosis using live-cell caspase reporters
5. Apoptosis biomarkers in cancer immunology and cell therapy research
01 How can Annexin V panels be optimized for multicolor flow cytometry?
1.1 Technical principles and methodological advantages
Phospholipids in normal cell membranes are asymmetrically distributed, and phosphatidylserine (PS) is confined to the inner lobe of the membrane[1]. In the early stage of apoptosis, PS is everted to the extracellular lobe and exposed to the cell surface[2]. Annexin V is a 36 kDa calcium-dependent phospholipid-binding protein. It has a high affinity for PS in the presence of Ca²⁺ and can specifically bind to exposed PS. The fluorescently labeled Annexin V was combined with propidium iodide (PI) and detected by flow cytometry - Annexin V⁺/PI⁻ represents early apoptotic cells, Annexin V⁺/PI⁺ represents late apoptotic or necrotic cells, and Annexin V⁻/PI⁻ represents living cells[3].
The use of annexin v assay for detecting apoptosis offers several methodological advantages: Firstly, it can detect early apoptosis, as the PS inversion occurs before DNA fragmentation and membrane permeability changes, making it one of the earliest measurable events of apoptosis; Secondly, it is rapid and simple, with staining taking only 10-15 minutes and no need for fixation or cell permeabilization[3]; Thirdly, it has strong discriminatory power, combined with PI, it can simultaneously distinguish live cells, early apoptotic cells, late apoptotic cells and necrotic cells; Fourthly, it can achieve high-throughput quantification, flow cytometry apoptosis assay can quickly detect a large number of cells and provide objective quantitative data[4]; Finally, it has high sensitivity, comparable to the TUNEL method, and can detect earlier apoptotic events[2].
1.2 Key points for optimizing the Annexin V multi-color flow solution
Selection of fluorescent dyes and spectral compatibility: Preferential selection of dye combinations requiring low compensation is recommended. For instance, the combination of FITC/PE-Annexin V with 7-AAD necessitates compensation correction, whereas assigning fluorophores to different lasers and ensuring that their emission spectra exhibit minimal overlap can maximally reduce spectral overlap and compensation requirements. Recommended panels include FITC‑Annexin V (excited by 488 nm) + APC/Alexa Fluor 647‑Annexin V (excited by the red laser) + 7‑AAD, or Pacific Blue‑Annexin V (excited by the violet laser) + Cell Event Green + 7‑AAD[5].
Optimization of buffer conditions: Calcium ion concentration is critical for detection, as the binding of Annexin V to phosphatidylserine (PS) is Ca²⁺‑dependent; therefore, the binding buffer must contain 2.5 mM CaCl₂. The recommended buffer formulation includes 10 mM HEPES (pH 7.4), 150 mM NaCl, and 2.5 mM CaCl₂. All washing steps should also be performed using a buffer containing calcium and magnesium to maintain Annexin V binding[1].
Optimization of staining protocols: First, Annexin V concentration titration is recommended. It is advisable to start with the manufacturer's recommended concentration and perform titration optimization for different cell lines, typically at 1 µg per sample (10 µL from a 100 µg/mL stock solution)[5]. For incubation conditions, 15 minutes at room temperature in the dark is sufficient; prolonged incubation may lead to false‑positive results in live cells[1]. Attention should also be paid to the staining order. In multicolor panels, when using FLICA‑type caspase substrates, it is recommended to add FLICA first (30 minutes), followed by Annexin V (15 minutes), and finally the DNA dye. The total staining time should be kept within 2 hours to minimize the impact of ongoing apoptosis. Finally, centrifugation steps should be minimized, as apoptotic cells are fragile. Excessive centrifugation and vortexing can damage cells; resuspension should be performed by gently tapping the tube wall[5].
Combination with live/dead dyes: DNA dyes such as 7‑AAD (excited at 488 nm, detected at >675 nm), PI, DAPI, TO‑PRO‑3, etc., can be selected, ensuring spectral compatibility with the Annexin V fluorophore. Covalent live/dead dyes (fixable viability dyes) can serve as alternatives to DNA dyes, allowing post‑fixation analysis. Live/Dead Near IR, Zombie NIR, and similar dyes are recommended, but they must be used in protein‑free buffers[5]. A key principle is that a membrane‑impermeant dye must be used simultaneously to distinguish early apoptotic cells (Annexin V⁺/live/dead dye⁻) from necrotic/late apoptotic cells (double‑positive)[1, 6].
Common pitfalls and quality control recommendations: First, annexin v assay positivity≠ apoptosis, PS exposure can also occur in non‑apoptotic settings such as calcium‑induced lipid scrambling, viral infection, and platelet activation. annexin v staining alone is insufficient to confirm apoptosis and must be combined with caspase activity assay or other functional assays[6]. Second, for adherent cells, it should be noted that trypsinization itself can induce transient PS exposure; a recovery period following trypsinization is recommended. Furthermore, apoptosis is a dynamic process, and sampling at multiple time points is recommended to capture the early apoptotic window (Annexin V⁺/PI⁻). Finally, each experiment should include an untreated control and a positive control treated with known apoptosis inducers (e.g., 1 µM staurosporine, 1-5 µM camptothecin), along with a concentration‑time curve[5].
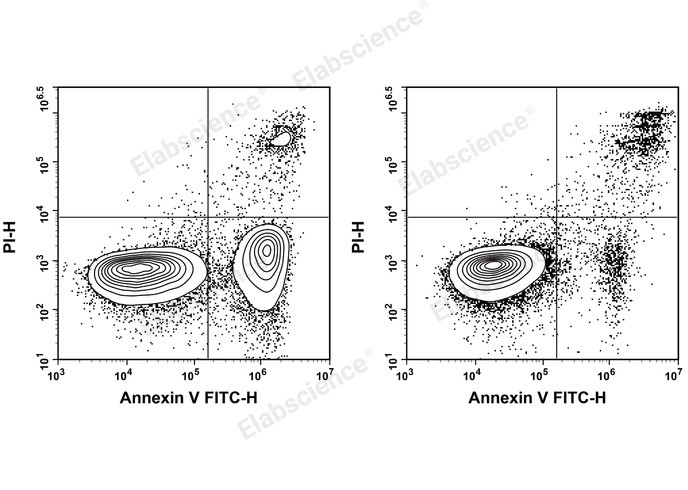
Fig. 1 Jurkat cells were treated with 5 μM Camptothecin and detected with Annexin V assay kit. Jurkat cells were cultured with (Left) or without (Right) 5 μM Camptothecin for 4 h. Annexin V-FITC single-positive cells were early apoptotic cells, Annexin V-FITC and PI double-positive cells were necrotic or late apoptotic cells, and PI single-positive cells were naked nuclei (The data are provided by Elabscience).
Quick Overview of Popular Products:
Table 1. Reagents for Annexin V-FCM detection
|
Fluorescent Dye of Annexin V |
PI (Cat. No.) |
7-ADD (Cat. No.) |
DAPI (Cat. No.) |
|
FITC |
E-CK-A211 |
E-CK-A221 |
E-CK-A252 |
|
Elab Fluor® 647 |
E-CK-A213 |
E-CK-A214 |
E-CK-A254 |
|
PE |
/ |
E-CK-A216 |
E-CK-A256 |
|
APC |
E-CK-A217 |
E-CK-A218 |
E-CK-A258 |
|
EGFP |
E-CK-A219 |
E-CK-A220 |
E-CK-A260 |
|
Cyanine5 |
E-CK-A221 |
E-CK-A222 |
E-CK-A262 |
|
PE/Cyanine5 |
/ |
/ |
E-CK-A264 |
|
PE/Cyanine5.5 |
/ |
/ |
E-CK-A266 |
|
PE/Cyanine7 |
/ |
E-CK-A228 |
E-CK-A268 |
|
APC/Cyanine7 |
E-CK-A229 |
E-CK-A230 |
E-CK-A270 |
|
Elab Fluor® Violet 450 |
E-CK-A233 |
E-CK-A234 |
/ |
|
Elab Fluor® Violet 500 |
E-CK-A235 |
E-CK-A236 |
/ |
|
PE/Elab Fluor® 594 |
/ |
/ |
E-CK-A272 |
|
Elab Fluor® 488 |
E-CK-A237 |
E-CK-A238 |
E-CK-A278 |
|
FITC |
E-CK-A239 |
E-CK-A240 |
E-CK-A280 |
|
Elab Fluor® 647 |
E-CK-A211 |
E-CK-A221 |
E-CK-A252 |
02 TUNEL assay applications in DNA fragmentation analysis by flow cytometry
2.1 Technical principles and methodological advantages
Since its establishment by Gorczyca[7] and Gavrieli et al.[8] in 1992, the TUNEL (Terminal deoxynucleotidyl transferase dUTP nick end labeling) technique has become one of the core methods for detecting DNA fragmentation by flow cytometry (FCM). The fundamental principle lies in the detection of DNA strand breaks that occur during apoptosis. Specifically, in the late stage of apoptosis, specific endonucleases are activated, leading to double‑ or single‑strand breaks in chromosomal DNA and generating numerous 3'‑OH overhangs. In flow cytometry apoptosis assay, after cell fixation and permeabilization, terminal deoxynucleotidyl transferase (TdT) catalyzes the incorporation of fluorescently labeled deoxyuridine triphosphate (dUTP) onto these exposed 3'‑OH ends. Because normal or proliferating cells lack extensive DNA breaks and produce little background signal, the fluorescence intensity or the percentage of positive cells measured by flow cytometry allows quantitative assessment of the extent of DNA fragmentation, thereby accurately reflecting the level of apoptosis[9].
Over the past 20 years, high‑quality research has confirmed that this technique offers three major advantages over conventional methods such as Sub‑G1 analysis and the comet assay: high specificity, high sensitivity, and multiparameter analytical capability. By directly labeling DNA strand breaks rather than indirectly inferring DNA content loss, this method circumvents the interference of cell cycle distribution that limits the Sub‑G1 approach[10];Moreover, it can distinguish single‑strand breaks (SSB) from double‑strand breaks (DSB), whereas the comet assay only detects total DNA damage. When combined with DAPI co‑staining, TUNEL allows simultaneous assessment of DNA fragmentation and cell cycle distribution, thereby identifying the cell cycle phase in which DNA damage occurs[11]. In 2011, Darzynkiewicz et al. systematically described the methodological principles of TUNEL‑FCM and detailed strategies for multiparameter analysis, establishing this method as a benchmark for apoptosis detection[9]. Subsequently, Sharma et al.[12] developed a standardized TUNEL detection protocol and quality control scheme to ensure inter‑laboratory comparability of results. Furthermore, Douglas et al.[11] demonstrated the feasibility of multiparameter FCM for simultaneous evaluation of cell phenotype, apoptosis, and cell cycle, thereby expanding the application of TUNEL technology in complex biological samples.
2.2 Core applications in apoptosis and tumor research
At the level of apoptosis research, although TUNEL is a powerful tool for detecting apoptotic features such as DNA fragmentation, its positive signal does not necessarily equate to irreversible cell death; therefore, it should be interpreted together with complementary biomarkers in preclinical and clinical studies[13]. Previous studies have also indicated that the annexin v assay method cannot precisely distinguish between apoptotic and necrotic cells, and the TUNEL method shares similar limitations in differentiating apoptosis from necrosis[14]. Consequently, it is recommended to combine TUNEL‑FCM with assays such as Annexin V/PI to more accurately assess the type of cell death. In the field of tumor drug efficacy evaluation, TUNEL‑FCM is widely used to quantitatively detect DNA fragmentation in tumor cells induced by chemotherapeutic agents and radiotherapy. Wieder systematically described the application value of TUNEL technology in detecting post‑chemotherapy apoptosis, noting that this technique provides an important tool for elucidating the mechanisms of action of chemotherapeutic drugs, studying drug resistance, and exploring tumor biology[15]. TUNEL‑FCM also demonstrates unique value in research on tumor development mechanisms and treatment‑related toxicity. Berby et al. applied TUNEL flow cytometry to detect the sperm DNA fragmentation index (SDF) in 29 testicular cancer patients before and after chemotherapy or radiotherapy. Their results showed that SDF and chromatin condensation defects transiently increased after treatment, paralleling the recovery curve of conventional semen parameters, suggesting that TUNEL‑FCM can serve as a quantitative indicator for assessing reproductive toxicity induced by tumor chemoradiotherapy[16].
2.3 Extended applications in reproductive medicine and genotoxicity assessment
Over the past 15 years, TUNEL-FCM technology has expanded from basic oncology research into the fields of reproductive medicine and environmental genotoxicity assessment, establishing itself as a key technique for the etiological diagnosis of male infertility and the evaluation of reproductive safety. In reproductive medicine, sperm DNA fragmentation (SDF) represents a significant molecular etiology underlying male infertility and recurrent pregnancy loss. Currently, four primary methods are clinically employed for SDF detection: TUNEL, sperm chromatin structure assay (SCSA), sperm chromatin dispersion (SCD) test, and Comet assay[17]. Because TUNEL directly detects fragmented DNA ends, it is more suitable for analyzing cryopreserved sperm and samples with poor motility, whereas SCSA may introduce false positives due to acid treatment.
In genotoxicity assessment, TUNEL-FCM is widely used to evaluate DNA damage induced by environmental toxins and nanomaterials. One study applied the tunel assay kit to assess DNA integrity damage caused by co-exposure to TiO₂ nanoparticles and lincomycin in a zebrafish mode[18], confirming the feasibility of this technique for environmental risk assessment of nanomaterials. Furthermore, a study involving populations exposed to automobile exhaust demonstrated that long-term traffic-related pollution exposure leads to elevated levels of sperm chromatin and DNA fragmentation, and the proportion of DNA damage measured by TUNEL-FCM showed a significant positive correlation with the duration of occupational exposure[19].
2.4 Technical limitations, optimization strategies and future prospects
Despite the widespread application of TUNEL‑FCM, studies over the past two decades have revealed its inherent limitations, including sensitivity to fixation and permeabilization conditions, an inability to distinguish between apoptosis and DNA repair defects, as well as interference from autofluorescence in primary cells[13, 20]. In response to these limitations, optimization strategies have been developed: substituting fluorophore‑labeled dUTP with BrdUTP followed by indirect labeling using anti‑BrdU antibodies significantly enhances signal intensity[9]; multiparameter co‑staining protocols that combine TUNEL with mitochondrial membrane potential assay and γ‑H2AX enable simultaneous discrimination among apoptosis, necrosis, and DNA double‑strand breaks[11]. Looking forward, with advances in microfluidic flow cytometry and fluorescence resonance energy transfer (FRET) technologies, TUNEL‑FCM is expected to achieve breakthroughs at the single‑cell level, enable dynamic live‑cell monitoring, and facilitate multi‑omics integrative analysis, thereby playing an increasingly important role in precision medicine, early tumor screening, and reproductive health.
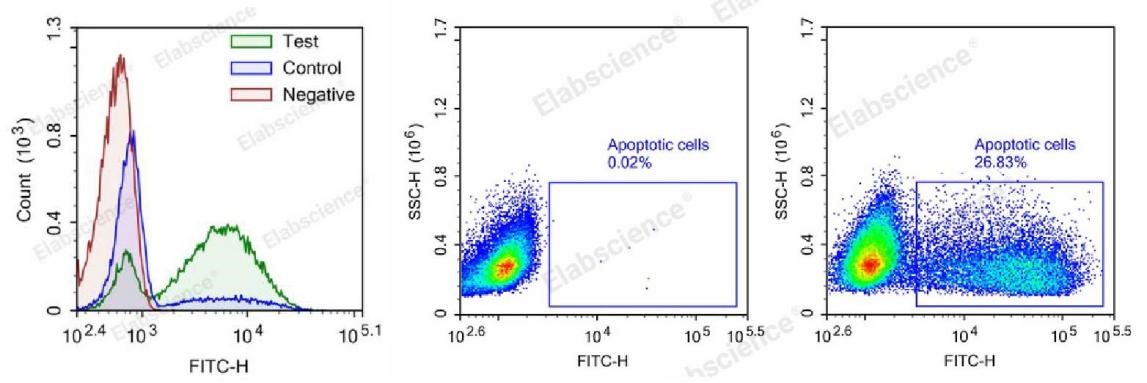
Fig. 2 TUNEL-Flow cytometry analysis of camptothecin-induced apoptosis in HL-60 and Jurket cells. Test: HL-60 cells were treated with 2.5 μM Camptothecin for 4h. Control: Normal HL-60 cells were not treated with drugs. Negative: HL-60 cells were treated with 2.5 μM camptothecin for 4h without TdT enzyme (The data are provided by Elabscience).
Quick Overview of Popular Products:
Table 2. Reagents for TUNEL-FCM detection
|
Cat. No. |
Product Name |
|
E-CK-A420 |
One-step TUNEL Flow Cytometry Apoptosis Kit (Green, FITC) |
|
E-CK-A424 |
One-step TUNEL Flow Cytometry Apoptosis Kit (Red, Elab Fluor® 647) |
|
E-CK-A421 |
One-step TUNEL Flow Cytometry Apoptosis Kit (Green, Elab Fluor® 488) |
|
E-CK-A422 |
One-step TUNEL Flow Cytometry Apoptosis Kit (Red, Elab Fluor® 594) |
|
E-CK-A423 |
One-step TUNEL Flow Cytometry Apoptosis Kit (Blue, Elab Fluor® Violet 450) |
|
E-CK-A425 |
One-step TUNEL Flow Cytometry Apoptosis Kit (Red, Elab Fluor® 555) |
03 Why is JC-1 still widely used for mitochondrial apoptosis detection?
3.1 Technical principles and methodological advantages
JC‑1 (5,5′,6,6′-tetrachloro‑1,1′,3,3′-tetraethylbenzimidazolylcarbocyanine iodide) is a lipophilic cationic fluorescent dye whose unique principle for detecting the ΔΨm has established it as the “gold standard” in this field[21]. At low concentrations or low membrane potentials, JC‑1 exists as a monomer, emitting green fluorescence (emission peak ~529 nm). However, when the ΔΨm is high (>80-100 mV), the dye becomes highly concentrated in the mitochondrial matrix and reversibly forms so‑called J‑aggregates, which emit orange‑red fluorescence (emission peak ~590 nm)[22]. This fluorescence emission shift from green to orange‑red enables JC‑1 to be used for ratiometric measurement, i.e., assessing ΔΨm by calculating the ratio of red‑to‑green fluorescence intensity. This ratiometric property offers a major methodological advantage: it is independent of mitochondrial shape, density, or size, and depends solely on changes in the membrane potential itself. In contrast, conventional single‑wavelength dyes such as Rhodamine 123 and DiOC6(3) can only infer changes in membrane potential based on absolute fluorescence intensity increases or decreases, which are susceptible to interference from variations in mitochondrial mass, cell size, and dye uptake efficiency, and cannot distinguish changes in the plasma membrane potential[23].
3.2 Wide applicability and multi-parameter analysis capability
A key advantage of JC‑1 lies in its broad applicability across diverse cell types. This probe has been successfully used in a wide range of cells, including peripheral blood lymphocytes and monocytes, tumor cell lines such as HL60 and U937, human fibroblasts, keratinocytes, sperm cells, mouse hepatocytes and thymocytes, as well as invertebrate hemocytes, and even isolated mitochondria[21]. Moreover, JC‑1 is suitable not only for flow cytometry but also for detection by fluorescence microscopy and confocal microscopy[22].
With the advancement of multicolor flow cytometry, JC‑1 has been integrated into high‑parameter analysis protocols. Cossarizza et al. developed a five‑color assay that simultaneously detects ΔΨm (JC‑1), DNA content (Hoechst 33342), early apoptosis (annexin v assay), and plasma membrane integrity (propidium iodide)[21]. Lugli et al. further updated this approach by utilizing a multi‑laser instrument to achieve independent excitation of JC‑1 monomers (488 nm blue laser) and J‑aggregates (561 nm yellow laser), thereby completely avoiding fluorescence compensation issues while enabling simultaneous detection of ROS and apoptosis[24].
3.3 Continuous optimization and modernization of the technology
The JC‑1 technique has not remained static but has been continuously refined alongside advances in instrumentation. Perelman et al. demonstrated that the conventional 488 nm excitation is not optimal—because 488 nm efficiently excites both JC‑1 monomers and aggregates, leading to substantial spectral overlap of monomer fluorescence into the aggregate signal, which requires extensive compensation to resolve. They showed that excitation at 405 nm or 561 nm significantly improves the signal‑to‑noise ratio (aggregate signal enhanced approximately 7.8‑fold relative to monomer signal), with 561 nm excitation achieving optimal selectivity due to the complete absence of monomer excitation[25]. Today, modern flow cytometers equipped with multiple lasers are widely available, further enhancing the precision of JC‑1 measurements[24]. Concurrently, an improved derivative, JC‑10 (with better water solubility), has been developed, offering an alternative choice for certain applications.
3.4 Challenges and coping strategies
JC‑1 still has several limitations worth noting. First, its fluorescence emission spectrum spans the green, yellow, and part of the red regions, which makes it difficult to use simultaneously with certain other fluorescent dyes, such as propidium iodide. However, researchers have found a solution. Lecoeur et al. established a dual‑staining protocol combining JC‑1 with TOTO‑3 (a far‑red fluorescent nucleic acid dye excited by a 633 nm laser), successfully achieving simultaneous assessment of ΔΨm and plasma membrane integrity[26]. Second, JC‑1 requires an optimized working concentration—concentrations that are too low may fail to form J‑aggregates, whereas excessively high concentrations can cause nonspecific staining[27]. In addition, staining conditions (temperature, pH, incubation time) must be tightly controlled because ΔΨm is highly sensitive to these factors. Finally, whether a decrease in ΔΨm is a cause or a consequence of apoptosis remains dependent on the cell model in question, and careful interpretation with time‑course analysis is required.
In summary, the enduring widespread use of JC‑1 in mitochondrial apoptosis detection stems fundamentally from its unique ratiometric detection principle, which confers specificity and reliability unmatched by other probes. Continuous technical refinements over the years (e.g., multi‑laser excitation, multiparameter combinatorial analysis) have enabled it to adapt to the evolving demands of modern instrumentation, thereby maintaining its "gold standard" status for ΔΨm measurement. Although novel probes (such as JC‑10 and the MitoTracker series) continue to emerge, none has yet been able to fully supplant JC‑1's advantageous position in this field.
_.jpg)
Fig. 3 mitochondrial membrane potential assay kit (with jc-1 assay). The effect of camptothecin-induced apoptosis in Jurkat cells is shown in the figure: a small amount of apoptosis exists in normal cells (left), manifested as the appearance of a small number of mitochondrial membrane potential collapse cells; Induced apoptotic cells (medium, 2.5 μM camptothecin treated Jurkat cells for 24 hours) showed a large number of mitochondrial membrane potential collapse cells; In CCCP-treated cells (right, positive control), the mitochondrial membrane potential of almost all cells collapsed (The data are provided by Elabscience).
Quick Overview of Popular Products:
Table 3. Reagents for mitochondrial membrane potential assay
|
Cat. No. |
Product Name |
|
E-CK-A301 |
Mitochondrial Membrane Potential Assay Kit (with JC-1) |
|
E-CK-A402 |
MitoBright Red Probe Assay Kit |
|
E-CK-A403 |
MitoBright Deep Red Probe Assay Kit |
04 Real-time detection of apoptosis using live-cell caspase reporters
The core strategy of real‑time live‑cell apoptosis detection using caspase reporter systems is to employ genetically encoded fluorescent or bioluminescent probes to dynamically monitor caspase (in particular caspase‑3/7) activation in living cells[28]. The main approaches can be categorized as follows:
4.1 FRET (Förster resonance energy transfer)-based caspase reporter system
This is one of the most classic methods. A pair of fluorescent proteins (e.g., CFP and YFP, or mTurquoise and mVenus) is expressed in tandem as a fusion protein connected by a linker peptide containing a caspase‑3/7‑specific cleavage site (DEVD). In the absence of apoptosis, FRET efficiency is high; upon caspase activation and cleavage at the DEVD site, the two fluorescent proteins separate, and the FRET signal disappears. By monitoring the real‑time change in the donor‑to‑acceptor fluorescence ratio, the timing of apoptosis initiation can be traced at the single‑cell level. The advantages of this approach include reversible observation and subcellular resolution. Representative tools include SCAT3 and DEVD‑based FRET sensors[29].
4.2 Luciferase complementary/bioluminescence reporting system
Alternatively, a split luciferase system (e.g., NanoLuc or Firefly Luciferase) is used, in which two fragments are each fused to opposite ends of a DEVD linker peptide. Upon caspase cleavage, the luciferase fragments are released and reassemble, generating a bioluminescent signal. This approach offers a high signal‑to‑noise ratio and low background, making it well suited for high‑throughput drug screening and long‑term (days to weeks) in vivo imaging. Representative tools include the Caspase‑Glo series and a NanoLuc‑based caspase‑3 reporter system[30].
4.3 Translocation‑based caspase reporter system
In this system, a fluorescent protein is fused to a caspase cleavage substrate along with a nuclear localization signal (NLS) or a nuclear export signal (NES). Upon apoptosis induction, caspase‑mediated cleavage leads to redistribution of the fluorescent protein (e.g., from the nucleus to the cytoplasm). For example, using a GFP‑NLS‑DEVD‑NES construct, GFP translocates from the cytoplasm to the nucleus during apoptosis, providing a clear morphological indicator of the process. Such reporter systems are amenable to quantitative analysis using high‑content imaging (HCI)[31].
4.4 Live cell detection based on fluorescently quenched peptide substrates
In this approach, a fluorescently quenched substrate containing the DEVD sequence (e.g., DEVD‑AMC, DEVD‑AFC, or a Cy5/QSY21‑based quenching probe) is introduced into living cells. Upon caspase cleavage, the fluorophore is released from the quencher, resulting in an increase in fluorescence intensity. This method is straightforward; however, the substrate requires microinjection or stable cellular uptake techniques, and the signal is not retained over long periods.
4.5 Combined reporter system employing iCaspase and SMAC mimetics
Integrating the aforementioned reporter systems with genetically encoded apoptosis‑inducing modules (e.g., iCaspase‑9) or endogenous apoptosis pathway regulators (e.g., SMAC mimetics) enables an integrated platform for both inducible initiation and real‑time monitoring of apoptosis. Such a strategy is particularly valuable in drug screening and personalized therapy assessment[32].
Key experimental design considerations:① Select a reporter system appropriate for the relevant time scale (FRET is suitable for minute‑level dynamics, whereas bioluminescence is appropriate for hour‑ to day‑level dynamics); ② Ensure stable integration of the reporter gene (via lentivirus or CRISPR knock‑in) to achieve homogeneous expression;③ Employ confocal microscopy, wide‑field time‑lapse imaging, flow cytometry, or microplate readers for dynamic data acquisition;④ Perform orthogonal validation using live‑cell dyes (e.g., Annexin V, PI, or TUNEL).
In summary, live‑cell caspase reporter systems have become core tools for studying the dynamic regulation of apoptosis. They enable the elucidation of heterogeneity among individual cells during the initiation of apoptotic signaling, caspase activation, and the execution phase. These systems are of great significance for understanding apoptotic mechanisms, evaluating the efficacy of anticancer drugs, and screening apoptosis modulators.
%20and%20analyzed%20by%20flow%20cytometry_.jpg)
Fig. 4 RAW264.7 cells were stained with Caspase 1 Substrates (Green) and analyzed by flow cytometry (The data are provided by Elabscience).
Quick Overview of Popular Products:
Table 4. Reagents for caspase activity assay
|
Cat. No. |
Product Name |
|
E-CK-A481 |
Caspase 1 Activity Detection Substrate for Flow Cytometry |
|
E-CK-A483 |
Caspase 3/7 Activity Detection Substrate for Flow Cytometry |
|
E-CK-A484 |
Caspase 4 Activity Detection Substrate for Flow Cytometry |
|
E-CK-A486 |
Caspase 6 Activity Detection Substrate for Flow Cytometry |
|
E-CK-A488 |
Caspase 8 Activity Detection Substrate for Flow Cytometry |
|
E-CK-A831 |
Caspase 3/7 and Annexin V Double Staining Apoptosis Kit |
|
E-CK-A832 |
Caspase 3/7 and PI Double Staining Apoptosis Kit |
|
E-CK-A833 |
Caspase 3/7 and DAPI Double Staining Apoptosis Ki |
05 Apoptosis biomarkers in cancer immunology and cell therapy research
In tumor immunology and cell therapy research, the detection of apoptosis involves multiple levels of biomarkers that reflect the biochemical and morphological changes occurring at different stages of the apoptotic process. First, classical apoptotic biomarkers include early‑stage events such as phosphatidylserine (PS) externalization, loss of ΔΨm, activation of the caspase family during the execution phase, and late‑stage DNA fragmentation. In addition, certain unique apoptotic markers are also relevant specifically to tumor immunology and cell therapy studies.
5.1 Markers of immunogenic cell death (ICD)
ICD is a distinct form of apoptosis that activates adaptive immunity. Its biomarkers include[33]: surface exposure of calreticulin (CALR), which serves as an "eat me" signal to promote phagocytosis by dendritic cells (DCs); release of HMGB1, which binds to TLR4 to activate DC maturation; secretion of ATP, acting as a "find me" signal to recruit DC precursors; release of Annexin A1 (ANXA1), mediating chemotaxis of DCs toward apoptotic cells; and secretion of type I interferons, which enhance the functions of CD8+ T cells and NK cells.
5.2 Biomarkers of circulating apoptosis
In clinical trials, detectable apoptotic biomarkers in peripheral blood include circulating nucleosomal DNA (nDNA), fragments of cytokeratin 18 (CK18) measured by M30/M65 ELISA, as well as apoptotic features in circulating tumor cells (CTCs). These markers can serve as pharmacodynamic biomarkers to guide early‑phase clinical trials[34].
Because different apoptosis detection methods have their own strengths and limitations, a single method is often insufficient to fully characterize the apoptotic process in tumor immunology and cell therapy research. A multi‑assay combination strategy is therefore recommended. Annexin V/PI staining is used as a routine early apoptosis screening tool; FLICA is applied to confirm caspase activation, thereby distinguishing apoptosis from necrosis; JC‑1 is employed to assess mitochondrial functional status; and TUNEL is used to verify DNA fragmentation. In studies of ICD, additional detection of specific ICD markers, including CALR exposure, ATP secretion, HMGB1 release, and type I interferon secretion, is required. The multiparameter analysis capability of flow cytometry makes it an ideal platform for these assays, enabling high‑throughput, single‑cell characterization of apoptosis. This approach plays a pivotal role in evaluating CAR‑T cell efficacy, predicting responses to immune checkpoint inhibitors, and advancing new drug development.
Quick Overview of Popular Products:
Table 5. Comparison of four types of apoptosis detection methods
|
Character |
Annexin V |
TUNEL |
JC-1 |
Caspase |
|
Detection Target |
Phosphatidylserine (PS) is everted |
DNA break (3'-OH terminal) |
mitochondrial membrane potential(ΔΨm) |
activated caspase active site |
|
The Apoptotic Stage of Detection |
early stage |
middle and advanced stage |
Early to middle stage |
earliest (detection upon caspase activation) |
|
Live Cell Detection |
√ Yes (Live cells required) |
× No (fixation required) |
√ Yes |
√ Yes |
|
Distinguishes Apoptosis/Necrosis |
√ Yes (combined with PI) |
× Cannot be specifically distinguished |
limited |
√ Yes (necrotic cells are negative) |
|
Compatible with Live Cell Sorting |
√ Yes |
× No |
√ Yes |
√ Yes |
|
Multi-parameter Combination Capability |
√ Good(with PI/7-AAD) |
√ Good(with DNA dyes) |
√ Good(But it overlaps with the spectrum) |
√ Good (with PI et al.) |
|
Sensitivity |
High |
High(One of the most sensitive methods for detecting DNA breaks) |
Medium-high |
High(The detection time window is the widest) |
|
Specificity |
High(Specificity of early apoptosis) |
Medium(Necrosis/repair may be detected) |
High(for ΔΨm) |
Medium(Non-specific binding exists) |
|
Operational Complexity |
Simple |
More complex (multi-step marking) |
Simple |
Medium |
|
Main Limitations |
Only applicable to living cells; Late apoptosis is difficult to distinguish from necrosis |
Cells need to be fixed; Necrotic cells may be falsely positive |
Spectral interference; ΔΨm timing dispute |
Specificity is questionable; False negatives may occur in the late stage |
|
Recommended Application Scenarios |
Early apoptosis quantification; Sorting of living cells; Immunotherapy killing assessment |
Localization of DNA breaks in tissue sections; Analysis of the relationship between cell cycle and apoptosis |
Research on mitochondrial function; Screening of mitochondrial toxicity of drugs |
Early apoptosis detection; Apoptosis/necrosis differentiation; Confirmation of caspase activation |
References:
[1] CROWLEY L C, MARFELL B J, SCOTT A P, WATERHOUSE N J. Quantitation of Apoptosis and Necrosis by Annexin V Binding, Propidium Iodide Uptake, and Flow Cytometry [J]. Cold Spring Harbor Protocols, 2016, 2016(11).
[2] KYLAROVá D, PROCHáZKOVá J, MAD'AROVá J, et al. Comparison of the TUNEL, lamin B and annexin V methods for the detection of apoptosis by flow cytometry [J]. ACTA Histochemica, 2002, 104(4): 367-70.
[3] ZHANG G H, GURTU V, KAIN S R, YAN G C. Early detection of apoptosis using a fluorescent conjugate of annexin V [J]. Biotechniques, 1997, 23(3): 525-+.
[4] GELLES J D, CHIPUK J E. Robust high-throughput kinetic analysis of apoptosis with real-time high-content live-cell imaging [J]. Cell Death & Disease, 2016, 7.
[5] TELFORD W, TAMUL K, BRADFORD J. Measurement and Characterization of Apoptosis by Flow Cytometry [J]. Current Protocols in Cytometry, 2016, 77(1).
[6] BENDALL L J, GREEN D R. Autopsy of a cell [J]. Leukemia, 2014, 28(6): 1341-3.
[7] GORCZYCA W, BRUNO S, DARZYNKIEWICZ R J, et al. DNA strand breaks occurring during apoptosis - their early insitu detection by the terminal deoxynucleotydil transferase and nick translation assays and prevention by sering protease inhibitors [J]. International Journal of Oncology, 1992, 1(6): 639-48.
[8] GAVRIELI Y, SHERMAN Y, BENSASSON S A. Identification of programmed cell-death insitu via specifitic labeling of nuclear-DNA fragmentation [J]. Journal of Cell Biology, 1992, 119(3): 493-501.
[9] DARZYNKIEWICZ Z, ZHAO H. Detection of DNA Strand Breaks in Apoptotic Cells by Flow- and Image-Cytometry [M]//DIDENKO V V. DNA Damage Detection In Situ, Ex Vivo, and In Vivo: Methods and Protocols. Totowa, NJ; Humana Press. 2011: 91-101.
[10] EHEMANN V, SYKORA J, VERA-DELGADO J, et al. Flow cytometric detection of spontaneous apoptosis in human breast cancer using the TUNEL-technique [J]. Cancer Letters, 2003, 194(1): 125-31.
[11] DOUGLAS R S, PLETCHER C H, JR., NOWELL P C, MOORE J S. Novel approach for simultaneous evaluation of cell phenotype, apoptosis, and cell cycle using multiparameter flow cytometry [J]. Cytometry, 1998, 32(1): 57-65.
[12] SHARMA R, IOVINE C, AGARWAL A, HENKEL R. TUNEL assay—Standardized method for testing sperm DNA fragmentation [J]. Andrologia, 2021, 53(2): e13738.
[13] MIRZAYANS R, MURRAY D. Do TUNEL and Other Apoptosis Assays Detect Cell Death in Preclinical Studies? [J] 2020, 21(23):9090
[14] HAVASI A, BORKAN S C. Apoptosis and acute kidney injury [J]. Kidney International, 2011, 80(1): 29-40.
[15] WIEDER R. TUNEL assay as a measure of chemotherapy-induced apoptosis [J]. Methods in Molecular Medicine, 2005, 111: 43-54.
[16] BERBY B, HENNEBICQ S, SAIAS J, et al. Sperm Telomere Interactions Are Impaired in Testicular Cancer Before and After Adjuvant Therapy [J]. Andrology, 2025.
[17] CALAMAI C, TANTURLI M, CONTI D, et al. Induction of Sperm DNA Fragmentation by Cryopreservation and In Vitro Incubation: Comparison of TUNEL, SCSA, SCD Test and COMET Assay [J]. International Journal of Molecular Sciences, 2025, 26(18): 8978.
[18] MOTTOLA F, IOVINE C, SANTONASTASO M, et al. Evaluation of Zebrafish DNA Integrity after Individual and Combined Exposure to TiO2 Nanoparticles and Lincomycin [J]. Toxics, 2022, 10(3).
[19] CALOGERO A E, LA VIGNERA S, CONDORELLI R A, et al. Environmental car exhaust pollution damages human sperm chromatin and DNA [J]. Journal of Endocrinological Investigation, 2011, 34(6): E139-E43.
[20] MURATORI M, TAMBURRINO L, MARCHIANI S, et al. Critical Aspects of Detection of Sperm DNA Fragmentation by Tunel/Flow Cytometry [J]. Systems Biology in Reproductive Medicine, 2010, 56(4): 277-85.
[21] LUGLI E, TROIANO L, COSSARIZZA A. Polychromatic analysis of mitochondrial membrane potential using JC-1 [J]. Current protocols in cytometry, 2007, Chapter 7: Unit7.32-Unit7.
[22] CHAZOTTE B. Labeling mitochondria with JC-1 [J]. Cold Spring Harbor protocols, 2011, 2011(9).
[23] SALVIOLI S, ARDIZZONI A, FRANCESCHI C, COSSARIZZA A. JC-1, but not DiOC(6)(3) or rhodamine 123, is a reliable fluorescent probe to assess Delta Psi changes in intact cells: Implications for studies on mitochondrial functionality during apoptosis [J]. FEBS Letters, 1997, 411(1): 77-82.
[24] DE BIASI S, GIBELLINI L, COSSARIZZA A. Uncompensated Polychromatic Analysis of Mitochondrial Membrane Potential Using JC-1 and Multilaser Excitation [J]. Current protocols in cytometry, 2015, 72: 7.32.1-7..11.
[25] PERELMAN A, WACHTEL C, COHEN M, et al. JC-1: alternative excitation wavelengths facilitate mitochondrial membrane potential cytometry [J]. Cell Death & Disease, 2012, 3.
[26] ZULIANI T, DUVAL R, JAYAT C, et al. Sensitive and reliable JC-1 and TOTO-3 double staining to assess mitochondrial transmembrane potential and plasma membrane integrity: Interest for cell death investigations [J]. Cytometry Part A, 2003, 54A(2): 100-8.
[27] MATHUR A, HONG Y, KEMP B K, et al. Evaluation of fluorescent dyes for the detection of mitochondrial membrane potential changes in cultured cardiomyocytes [J]. Cardiovascular Research, 2000, 46(1): 126-38.
[28] HU B, GAO S, HAN X, DING C. Recent advances in fluorescence biosensor for caspase detecting and imaging in biomedical applications [J]. TrAC Trends in Analytical Chemistry, 2023, 168: 117337.
[29] TUFFY L P, CONCANNON C G, D'ORSI B, et al. Characterization of Puma‑dependent and Puma‑independent neuronal cell death pathways following prolonged proteasomal inhibition [J]. Molecular and Cellular Biology, 2010, 30(23): 5484-5501.
[30] MOSTAFAVI M, ATAEI F, HAMIDIEH A A, HOSSEINKHANI S. Development of a bioluminescence assay for BIR2-caspase3 interaction through split luciferase complementary assay [J]. Biochemical Engineering Journal, 2022, 186.
[31] HU B, GAO S, HAN X, DING C. Recent advances in fluorescence biosensor for caspase detecting and imaging in biomedical applications [J]. TrAC Trends in Analytical Chemistry, 2023, 168.
[32] SELCEN S, WIELAND L, DE OLIVEIRA T, et al. Integrated real-time imaging of executioner caspase dynamics, apoptosis-induced proliferation, and immunogenic cell death using a stable fluorescent reporter platform [J]. Cell Death Discovery, 2025, 11(1).
[33] FUCIKOVA J, KEPP O, KASIKOVA L, et al. Detection of immunogenic cell death and its relevance for cancer therapy [J]. Cell Death & Disease, 2020, 11(11).
[34] DEAN E, GREYSTOKE A, RANSON M, DIVE C. Biomarkers of cell death applicable to early clinical trials [J]. Experimental Cell Research, 2012, 318(11): 1252-9.

