

Table of Contents
1. Enzyme target-based inhibitor screening assay principle
2. Fluorescence and colorimetric detection in enzyme inhibitor screening
3. IC50 determination in enzyme inhibitor screening assays
4. Assay interference and false-positive enzyme inhibition
5. High-throughput enzyme inhibitor screening with microplate assays
6. Key takeaways
7. Related resources
Introduction
Enzyme targets remain one of the most productive classes in drug discovery, and enzyme inhibitor screening is still the shortest route from a compound library to a characterised lead.
Two formats answer the same question. An enzyme activity assay quantifies catalytic turnover itself, usually to measure how much active enzyme a sample contains. An enzyme inhibitor assay measures the fractional loss of that turnover when a candidate compound is present and reports it as an IC50. Reagents can be shared between the two assay types, but conditions cannot: activity assays are performed at saturating substrate, whereas ranking reversible inhibitors requires sub-saturating substrate[1].
So, which assay should you use?
The answer depends on what you need to measure:
● Use an enzyme activity assay kit when the question is how much active enzyme a sample contains.
● Use an enzyme inhibitor assay at sub-Km substrate when reversible inhibitors must be ranked and compared.
● Use a DPP4 inhibitor screening kit or COX 2 inhibitor screening kit when a pre-optimised fluorescence or chemiluminescence readout is preferred.
● Use IC50 determination across a full concentration series when potency must be compared between compounds or converted to Ki.
The key difference is therefore not simply sensitivity: an enzyme activity assay measures turnover, whereas an enzyme inhibitor assay measures its loss under defined conditions. An IC50 reported without substrate concentration and interference controls conveys little.
01 Enzyme target-based inhibitor screening assay principle
Because enzymes act catalytically, the initial velocity v is proportional to active enzyme concentration and follows Michaelis-Menten:
v = Vmax × [S] / (Km + [S])
where Vmax is the limiting velocity, [S] the substrate concentration and Km the Michaelis constant. Percent inhibition is
% inhibition = (1 − (vi − vblank) / (v0 − vblank)) × 100
where vi and v0 are the rates with and without test compound and the blank term corrects for non-enzymatic signal[1].
1.1 The rate must be initial and linear
Progress curves are often curved by substrate depletion, product inhibition, enzyme instability or time-dependent inactivation, so a fixed-incubation endpoint may report mixed kinetics, not a true inhibition constant.
Variables to fix before a library is screened:
● Enzyme concentration and stability
● Substrate concentration relative to Km
● Buffer, pH and temperature
● Pre-incubation time, read window and controls
Commercial enzyme activity assay kit protocols are designed for activity detection, not inhibitor ranking, so these parameters must be re-optimised before screening[1].
1.2 Reversible and irreversible inhibition behave differently
Reversible inhibitors are competitive, uncompetitive, non-competitive or mixed according to whether they bind free enzyme, the enzyme–substrate complex, or both; the classes are separated by the substrate-concentration dependence of inhibition[1,2]. Irreversible inhibitors inactivate the enzyme in a time-dependent manner, so potency depends on pre-incubation time.
1.3 Direct and coupled assay formats
The signal may be generated directly, as with absorbance of a released chromophore, or indirectly through a coupled auxiliary enzyme such as horseradish peroxidase. Coupled enzyme inhibitor assays introduce a lag phase and require that the coupling enzyme never becomes rate-limiting.
Table 1. Variables that determine whether an enzyme inhibitor assay gives an interpretable result
|
Variable |
What goes wrong if uncontrolled |
Practical action |
|
Substrate concentration |
IC50 shifts with [S]; rankings change between isoenzymes |
Run at sub-saturating substrate, ~2×Km |
|
Enzyme concentration |
Tight-binding can distort Ki by a factor of 2 to 3 or more |
Keep [E]0 fixed; use the Morrison equation |
|
Pre-incubation time |
Time-dependent potency drifts toward [E]/2 |
Standardise pre-incubation across the series |
|
Read window |
Curved progress curves report mixed kinetics |
Measure an initial linear rate, not an endpoint |
|
Detection chemistry |
Autofluorescence, quenching, reporter inhibition give false hits |
Run counter-screens and orthogonal readouts |
02 Fluorescence and colorimetric detection in enzyme inhibitor screening
Detection chemistry sets the sensitivity, throughput and artefact profile of any enzyme activity assay, and therefore of any enzyme activity assay kit that packages it.
2.1 Colorimetric detection
Colorimetric assays follow an absorbing species: cofactor reduction at 340 nm, 4-nitrophenol at ~405 nm, malachite green at ~620 nm, thiol–DTNB at 412 nm. Cheap and autofluorescence-free, they underpin ~60% of screening[3].
2.2 Fluorescence and chemiluminescence
Fluorogenic substrates bring higher sensitivity and dynamic range and dominate enzyme inhibitor screening: AMC from peptide-AMC, resorufin from Amplex Red and fluorescein FRET reporters[1,3,4]. That gain carries the risk: autofluorescence, quenching, inner-filter absorbance and reporter-enzyme inhibition all give false readouts[3,5].
Chemiluminescence sits in between: in a COX 2 inhibitor screening kit, luminol and a brighter hydrazide report COX-2 hydroperoxidase activity (apparent Km ≈6.3 µM for arachidonic acid); the higher quantum yield allows substrate tenfold below Km, exposing competitive inhibitors[6].
2.3 What commercial screening kits do and do not optimise
Alternatively, a COX 2 inhibitor screening kit detects prostaglandins by immunoassay; only luminol tracks turnover in real time[6].
A DPP4 inhibitor screening kit reads AMC release from a fluorogenic peptide substrate as total activity at saturating substrate, a setting that distorts IC50 determination and cannot rank reversible inhibitors. In plasma, dropping the substrate to 20 µM and the sample to 10 µL removed the artefact[4]. Re-titrate substrate and enzyme rather than adopt supplier defaults.
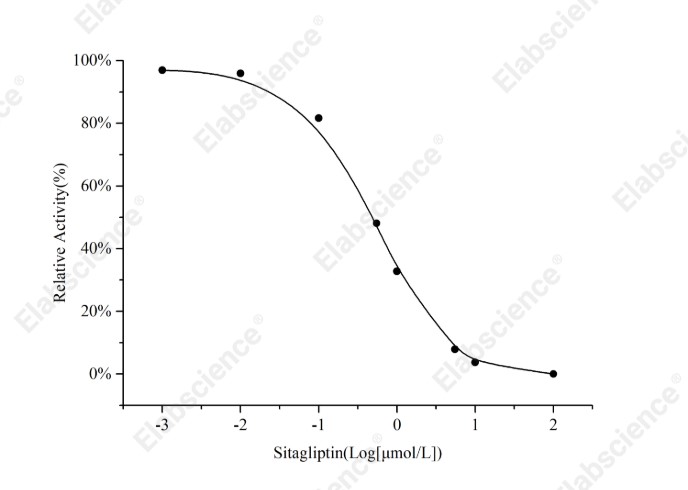
Fig. 1 Relative activity of DPP4 across a sitagliptin concentration series, measured with a DPP4 inhibitor screening kit (E-BC-D007).
Interpretation: Activity falls concentration-dependently within the initial-rate window, confirming that the optimised conditions rank inhibitors rather than total activity.
Assay used for this experiment:
Dipeptidyl Peptidase IV (DPP4) Inhibitor Screening Assay Kit
Cat. No.: E-BC-D007
Sample Type: Inhibitor Compound
Detection Instrument: Fluorescence microplate reader (Ex/Em=360 nm/460 nm)
Explore the DPP4 Inhibitor Screening Assay Kit Used in 1 Publication →
Special Offer: Enjoy 15% OFF from Sep 1 to Dec 18, 2026. → View Promotion
03 IC50 determination in enzyme inhibitor screening assays
IC50 determination is the standard currency of potency in enzyme inhibitor screening and the point at which the most systematic errors enter. IC50 is obtained by plotting residual activity against log inhibitor concentration and fitting a four-parameter logistic function; a Hill slope far above unity indicates cooperative binding or, more commonly, non-stoichiometric inhibition[3,5].
3.1 IC50 is not Ki
For a purely competitive inhibitor the two are linked through the Cheng-Prusoff relation:
IC50 = Ki × (1 + [S]/Km)
The measured IC50 therefore rises with substrate concentration; uncompetitive inhibitors behave oppositely; only true non-competitive inhibition gives an IC50 independent of substrate concentration. Reporting an IC50 without substrate concentration and mechanism conveys little about affinity[1].
To rank reversible inhibitors, run the assay at sub-saturating substrate, typically ~2×Km, so that free enzyme stays available for inhibitor binding; a single fixed substrate concentration cannot compare potency across isoenzymes such as COX-1 and COX-2. For COX-2, a twentyfold reduction in arachidonic acid moved the IC50 of ibuprofen from 253 µM to 18.6 nM, a shift of nearly four orders of magnitude, while time-dependent inhibitors were unaffected[6].
3.2 Tight binding: when the inhibitor is no longer in excess
When inhibitor concentration approaches that of the active sites, free inhibitor no longer equals added concentration and the dose-response model breaks; the Morrison equation is then required, with Kiapp and [E]0 coupled. Simulation and kallikrein data show a 10% error in assumed enzyme concentration distorts the fitted constant two- to three-fold and a 50% error shifts it tenfold[2]. Two-stage regression that releases enzyme concentration fixes this. Tight binding is the rule at nanomolar potency.
3.3 Time-dependent inhibition
For irreversible and slow-binding inhibitors, the apparent IC50 can depend on pre-incubation time. Standardise incubation conditions across the compound series and use appropriate time-dependent kinetic models when necessary. For tight-binding inhibitors, account for enzyme concentration using an appropriate model, such as the Morrison equation.
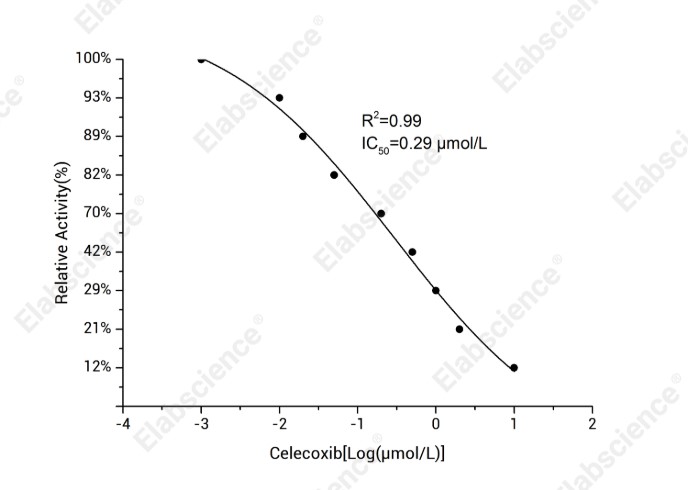
Fig. 2 Relative activity of COX-2 across a celecoxib concentration series; the four-parameter fit gives IC50 = 0.29 µmol/L (R2 = 0.99).
Interpretation: The inflection point gives the IC50, which must be reported together with the arachidonate concentration because IC50 shifts with substrate level[6].
Assay used for this experiment:
Cyclooxygenase-2 (COX-2) Inhibitor Screening Kit
Cat. No.: E-BC-D002
Sample Type: Inhibitor Compound
Detection Instrument: Fluorescence microplate reader (Ex/Em=530 nm/580 nm)
Explore the COX-2 Inhibitor Screening Kit →
Special Offer: Enjoy 15% OFF from Sep 1 to Dec 18, 2026. → View Promotion
04 Assay interference and false-positive enzyme inhibition
Without controls, 80-100% of hits in enzyme inhibitor screening are artefacts; interference is either generalised (physicochemistry) or technology-related (detection chemistry)[5].
4.1 Colloidal aggregation
Lipophilic compounds form 100-1000 nm colloids that sequester and partly denature protein: inhibition is steep, poorly reproducible, detergent-reversible (0.01% Triton X-100). Diagnose by light scattering, centrifugation, AmpC counter-screens or IC50 rising with enzyme concentration[3,5].
4.2 Chemical reactivity
Reactivity is a second class: Michael acceptors, redox-cycling quinones, catechols, thiol-reactive species and photo-reactive agents such as Rose Bengal, which acts via singlet oxygen. Detect them by time-resolved reads, jump dilution, dialysis or DTT scavenging[5].
4.3 Metal chelation and metal contamination
Suspect trace Zn2+/Cu2+ when inhibition vanishes with EDTA, shows erratic SAR or varies by batch; Zincon analysis confirms it. One Ube2T fragment hit, for example, proved to be zinc impurity rather than ligand[3].
4.4 Technology-related interference and the validation workflow
Pre-read plates, profile compounds spectroscopically and excite fluorophores above 500 nm: few autofluoresce there, yet up to half of blue-fluorescence actives are artefacts. AMC-based DPP4 inhibitor screening kit formats are equally exposed.
A practical workflow:
(1) Filter at design: drop PAINS-like, aggregation-prone chemotypes.
(2) Confirm orthogonally in IC50 determination: second technology, detergent control, enzyme-concentration series.
(3) Flag risk with in silico predictors; do not reject on them[5].
05 High-throughput enzyme inhibitor screening with microplate assays
Microplate formats remain the workhorse of high-throughput enzyme inhibitor screening. The 96-well plate suits routine work at 100–200 µL; 384- and 1536-well plates cut reagent and compound use and are standard for automated screening, raising throughput to about 100,000 compounds per day[3,7].
5.1 Assay quality and quantitative screening
Assay quality is monitored with the Z’ factor; published campaigns report a mean Z’ of about 0.755, and confirmed hit rates correlate positively with Z’. Quantitative high-throughput screening, which tests each compound across a concentration range rather than a single point, sharpens the distinction between genuine inhibitors and artefacts[3].
5.2 Beyond the plate
The same principles transfer to microarrays and nanoarrays with immobilised enzymes at nanolitre scale, and to microfluidic and droplet-based systems, which measure inhibition in minutes using about 15-fold less enzyme than a 96-well assay[7].
Regardless of platform, three parameters govern success: an initial-rate window without curvature, a substrate concentration chosen with respect to Km and mechanism, and interference controls matched to the detection chemistry.
Table 2. Microplate formats for enzyme inhibitor screening
|
Format |
Working volume |
Typical use |
Main requirement |
|
96-well |
100–200 µL |
Routine screening; manual pipetting |
Multichannel pipettes; standard reader |
|
384-well |
20–50 µL |
Primary HTS campaigns |
Robotic dispensing; dedicated reader |
|
1536-well / ultra-HTS |
2–10 µL |
~100,000 compounds per day |
Full automation; assay miniaturisation |
|
Quantitative HTS (qHTS) |
Dose series in situ |
Ranking hits; collecting dose-response data |
Curve fitting and Z′ monitoring |
|
Microarray / microfluidic / droplet |
Nanolitre scale |
Very large libraries; point-of-care |
Immobilised enzyme stability; readout integration
|
06 Key takeaways
An enzyme inhibitor assay is a rate measurement; the rate must be initial and linear to be interpretable.
● Detection chemistry defines the artefact profile: colorimetric is robust but less sensitive, fluorescence and chemiluminescence more sensitive but more exposed to interference.
● Commercial enzyme activity assay kit protocols are optimised for activity detection, so substrate and enzyme must be re-titrated before inhibitor screening.
● IC50 determination is not affinity; report substrate concentration, enzyme concentration and pre-incubation time with every value.
● Tight binding is the rule in nanomolar assays; use the Morrison equation and two-stage regression.
● Up to 80–100% of initial hits can be artefacts; aggregates, reactive compounds, metal impurities and autofluorescence are the main causes.
● Fix the assay conditions → Select the detection chemistry → Screen → Counter-screen → Confirm orthogonally → Report IC50 determination in full
07 Related resources
● Learn how to run an inhibitor screening kit step by step and choose the right assay conditions for your research
Watch the Operation Video, Using the ACE2 Inhibitor Screening Kit As An Example →
● Learn how to distinguish endpoint and continuous-monitoring enzyme activity assays
Read Notices on Enzymes Metabolism Assay Kit →
References:
[1] Ramsay, R., Tipton, K., Assessment of Enzyme Inhibition: A Review with Examples from the Development of Monoamine Oxidase and Cholinesterase Inhibitory Drugs. Molecules, 2017. 22(7):1192. DOI: 10.3390/molecules22071192
[2] Kuzmič, P., Elrod, K.C., Cregar, L.M., Sideris, S., Rai, R., Janc, J.W., High-Throughput Screening of Enzyme Inhibitors: Simultaneous Determination of Tight-Binding Inhibition Constants and Enzyme Concentration. Analytical Biochemistry, 2000. 286(1):45-50. DOI: 10.1006/abio.2000.4685
[3] Lloyd, M.D., High-Throughput Screening for the Discovery of Enzyme Inhibitors. Journal of Medicinal Chemistry, 2020. 63(19):10742-10772. DOI: 10.1021/acs.jmedchem.0c00523
[4] Yoon, H., Cho, S.H., Seo, Y.R., Yu, K.S., Park, S.S., Song, M.J., Optimization and Validation of a Fluorogenic Dipeptidyl Peptidase 4 Enzymatic Assay in Human Plasma. Analytical Biochemistry, 2021. 612:113952. DOI: 10.1016/j.ab.2020.113952
[5] Tan, L., Hirte, S., Palmacci, V., Stork, C., Kirchmair, J., Tackling Assay Interference Associated with Small Molecules. Nature Reviews Chemistry, 2024. 8(5):319-339. DOI: 10.1038/s41570-024-00593-3
[6] Forghani, F., Ouellet, M., Keen, S., Percival, M.D., Tagari, P., Analysis of Prostaglandin G/H Synthase-2 Inhibition Using Peroxidase-Induced Luminol Luminescence. Analytical Biochemistry, 1998. 264(2):216-221. DOI: 10.1006/abio.1998.2842
[7] Pereira, S.A.P., Dyson, P.J., Saraiva, M.L.M.F.S., Miniaturized Technologies for High-Throughput Drug Screening: Enzymatic Assays and Diagnostics. TrAC Trends in Analytical Chemistry, 2020. 126:115862. DOI: 10.1016/j.trac.2020.115862

