

Mitochondria govern cancer cell bioenergetics via oxidative phosphorylation (OXPHOS), coupling electron transport to ATP synthesis while buffering reactive oxygen species within the dynamic tumor microenvironment. Definitive functional assessment requires an integrated oxidative phosphorylation assay panel, synergizing the oxygen consumption rate assay, mitochondrial membrane potential assay, ATP assay, and reactive oxygen species assay. This multi-parametric approach resolves context-dependent metabolic plasticity, from hypoxia-driven adaptations to immune cell dysfunction, overcoming the limitations of single endpoint measurements. By distinguishing mitochondrial hyperpolarization from depolarization and validating ETC integrity against glycolytic compensation, this strategy eliminates interpretative bias.
In this context, we outline essential, physiologically optimized protocols for mitochondrial phenotyping, establishing this assay suite as a critical metabolic checkpoint for decoding therapeutic resistance and cellular fate in cancer research.
Table of Contents
1. Mitochondrial metabolic plasticity drives cancer cell survival
2. Immune cell metabolism in the tumor microenvironment: the role of OXPHOS
3. How does hypoxia regulate oxidative phosphorylation in tumor cells?
4. Mitochondrial membrane potential as an indicator of OXPHOS function
5. Metabolic biomarkers for evaluating cancer cell oxidative phosphorylation
6. Experimental approaches for studying OXPHOS in cancer research
01 Mitochondrial metabolic plasticity drives cancer cell survival
Malignant cells rely on mitochondrial oxidative phosphorylation (OXPHOS) for proliferation, metastasis, and therapy resistance, complementing the Warburg effect. This metabolic flexibility is context dependent. For instance, leukemic stem cells, melanoma, and pancreatic ductal adenocarcinoma exhibit strong OXPHOS dependence under specific microenvironments[1]. The electron transport chain (Complexes I–IV) and ATP synthase (Complex V) generate the proton motive force for ATP production. Notably, mutations in mtDNA encoded ETC genes can impair respiration while elevating reactive oxygen species, paradoxically activating NF-κB and HIF-1α pro survival pathways[2]. This plasticity renders single endpoint measurements inadequate. A comprehensive oxidative phosphorylation assay panel, integrating respiration, membrane potential, and ATP readouts, is essential to characterize the bioenergetic state of cancer cells accurately.
02 Immune cell metabolism in the tumor microenvironment: the role of OXPHOS
The tumor microenvironment metabolism involves intense competition among cancer cells, stromal cells, and leukocytes for nutrients and oxygen[3]. Effector CD8⁺ T cells utilize aerobic glycolysis for expansion, while Tregs and M2 polarized TAMs rely on fatty acid oxidation (FAO) and OXPHOS to maintain immunosuppression[3]. Tumor derived lactate suppresses T cell function and promotes Treg differentiation, creating a feedback loop. Functionally, suspension immune cells require specialized adhesion protocols such as Cell Tak for Seahorse analysis. Their inherently low mitochondrial mass critically limits the sensitivity of the oxygen consumption rate assay and ATP assay. Furthermore, intratumoral T cells often exhibit mitochondrial fragmentation and elevated ROS; therefore, a parallel reactive oxygen species assay (ROS assay) is indispensable to differentiate metabolic dysfunction from true exhaustion.
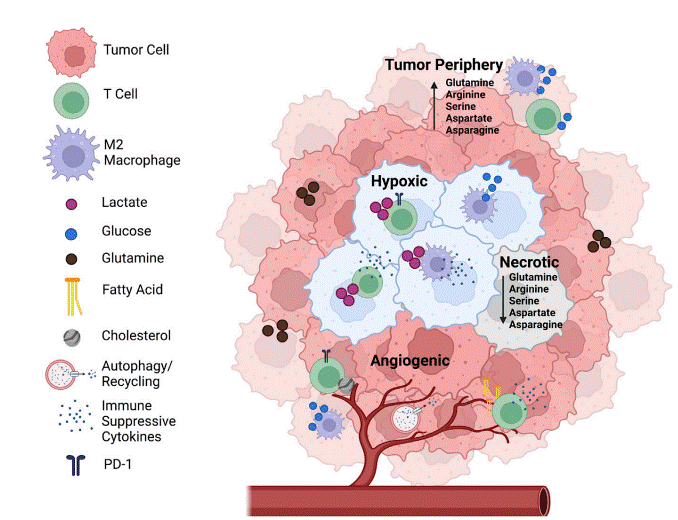
Fig. 1 Location-Dependent Metabolic Heterogeneity in the TME. The TME exhibits spatial metabolic heterogeneity driven by nutrient and oxygen gradients. In hypoxic regions, cancer cells secrete lactate, suppressing effector T cells while promoting immunosuppressive Tregs and M2-like tumor-associated macrophages (TAMs). Irregular angiogenesis forces regions toward autophagy and glucose dependency, whereas necrotic cores display severe amino acid depletion, creating distinct metabolic niches that shape tumor progression and immune evasion.
03 How does hypoxia regulate oxidative phosphorylation in tumor cells?
Hypoxia is nearly universal in solid tumors. HIF-1α promotes glycolysis by upregulating PDK1, which inactivates pyruvate dehydrogenase and restricts pyruvate flux into the TCA cycle[4]. Conversely, HIF-2α sustains OXPHOS in certain renal and neuroendocrine tumors, highlighting context dependent regulation. Standard cell culture at 21% O₂ markedly overestimates maximal respiratory capacity compared to physiological tumor pO₂ (1–5%). This artificial elevation of ETC activity during the oxygen consumption rate assay often obscures true spare respiratory capacity. To obtain physiologically relevant data, pre equilibrate cells at 1–5% O₂ for 24–48 hours, or employ hypoxia mimetics like CoCl₂, while acknowledging these agents incompletely recapitulate in vivo gradients[4].
04 Mitochondrial membrane potential as an indicator of OXPHOS function
Mitochondrial membrane potential (ΔΨm) drives ATP synthesis via the proton gradient. The JC-1 assay is a widely used method for assessing ΔΨm because its ratiometric properties correct for mitochondrial mass and dye loading, surpassing single emission probes in heterogeneous cancers[5]. Under hypoxia or high lactate, ΔΨm displays a biphasic response: initial hyperpolarization followed by depolarization as ROS injures mtDNA[2,4]. Interpretation requires combining the mitochondrial membrane potential assay with the oxygen consumption rate assay. Stable ΔΨm with declining OCR implies uncoupling, whereas decreased ΔΨm with falling OCR signifies respiratory inhibition. For suspension immune cells, use reduced JC-1 (1.0-1.5 μg/mL) and extend incubation to 20 minutes at 37°C. Always include 100 nM valinomycin as a positive depolarization control.
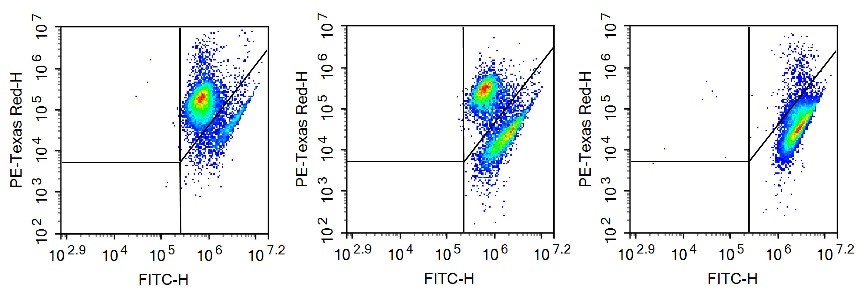
Fig. 2 The effect of JC-1 to detect apoptosis induced by camptothecin in Jurkat cells is shown: normal cells (left) have a low level of apoptosis, which is manifested as a small amount of mitochondrial membrane potential collapse cells; induced apoptotic cells (middle, 2.5 μM camptothecin-treated Jurkat cells for 24 h) had a large number of mitochondrial membrane potential collapse cells; CCCP-treated cells (right, positive control) almost all cells had mitochondrial membrane potential collapse. (The data are provided by Elabscience)
05 Metabolic biomarkers for evaluating cancer cell oxidative phosphorylation
Complement functional assays with orthogonal biomarkers. The ATP/ADP and NAD+/NADH ratios reflect energy status; a declining NAD+/NADH ratio often precedes OCR reduction, predicting glycolytic compensation[1]. The ECAR(Extracellular acidification rate)/OCR ratio indicates metabolic reliance but requires caution, as high ECAR derives from both glycolysis and glutaminolysis[6]. While 13C glucose or glutamine LC MS tracing is the gold standard for flux analysis[7], we recommend combining the ATP assay with the reactive oxygen species assay (ROS assay): concurrent ATP loss and mitochondrial ROS rise imply ETC complex I or III dysfunction. Normalize all values to protein or viable cell count to avoid artifacts from cell death.
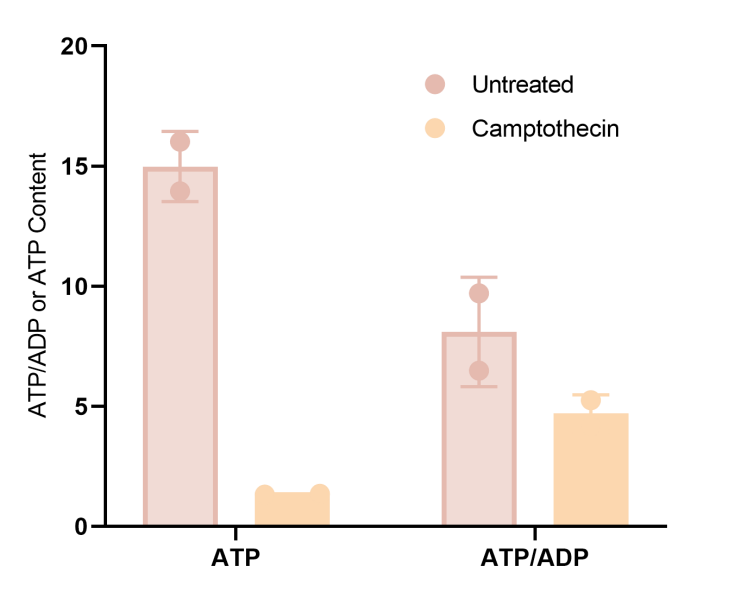
Fig. 3 After treatment with camptothecin apoptosis reagent, the ATP/ADP ratio (E-BC-F004) in 293T cells was decreased compared with untreated cells. (The data are provided by Elabscience)
06 Experimental approaches for studying OXPHOS in cancer research
A robust oxidative phosphorylation assay panel integrates four core techniques.
(A) Oxygen Consumption Rate Assay: The Cell Mito Stress Test quantifies basal respiration, ATP linked respiration, proton leak, and spare capacity[6]. Fluorescence based oxygen consumption rate kits serve as alternatives. Optimize cell density and FCCP titration for each line. Mimic tumor microenvironment metabolism by running assays in low glucose (1 g/L) and low serum (1% FBS) medium to avoid Crabtree effect suppression of maximal OCR[6].
(B) ATP Assay: Distinguish glycolytic from mitochondrial ATP via oligomycin sensitivity. Endpoint luminescence assays provide rapid total ATP readouts. To assess the contribution of glycolysis to ATP production, cells can be treated with a glycolytic inhibitor such as 2-deoxyglucose (2-DG), with the concentration optimized for the cell type and experimental conditions. Exclude phenol red and serum during readout to prevent luciferase quenching.
(C) Reactive Oxygen Species Assay (ROS assay): Use MitoSOX Red for mitochondrial superoxide and H₂DCFDA for total ROS, validated by antioxidant controls[8]. Avoid co staining with the JC-1 assay, as JC-1 quenches MitoSOX fluorescence; use parallel sister wells instead.
(D) Integrated Panel: Follow a workflow: oxygen consumption rate assay, mitochondrial membrane potential assay (JC-1 assay), ATP assay, and reactive oxygen species assay (ROS assay). Cross validate results: declining OCR with stable ATP suggests glycolytic compensation. For immune cells, pool 3-5 tumors for sufficient material and add 7-AAD to the JC-1 assay to exclude dead cells, as depolarized mitochondria in non viable cells distort data.
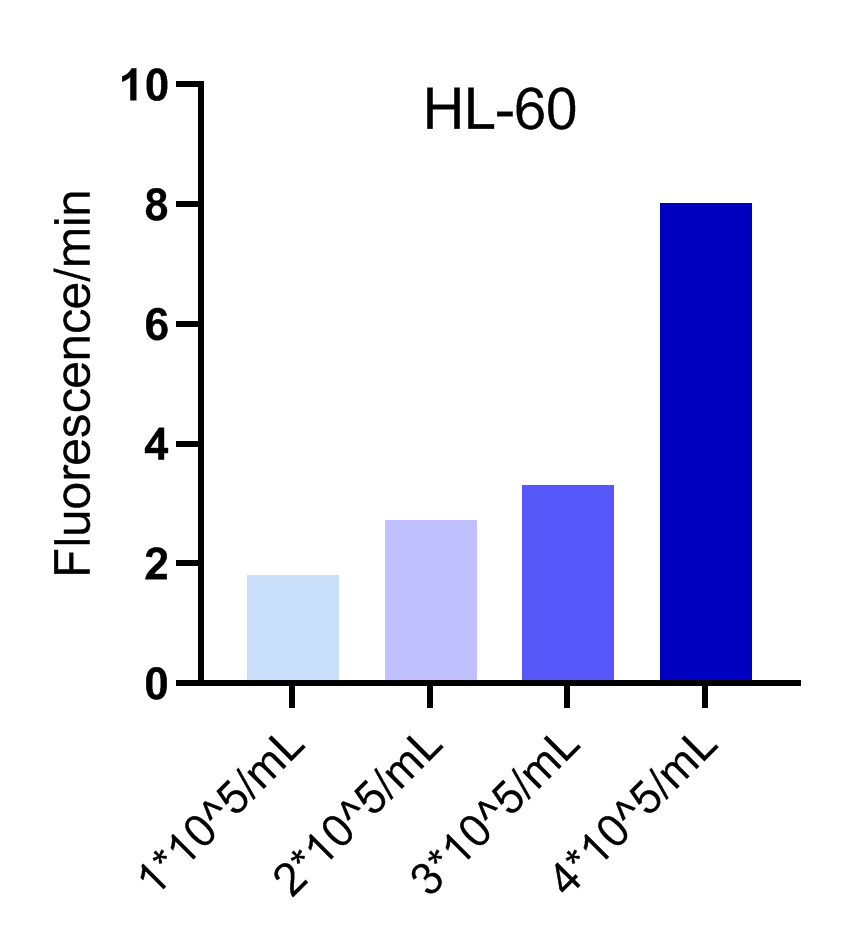
Fig. 4 Dose-dependent response of the Enhanced Oxygen Consumption Rate (OCR) Fluorometric Assay Kit (E-BC-F070) in HL-60 cells. The fluorescence signal, reflecting the oxygen consumption rate, exhibits a linear increase corresponding to higher cell concentrations ranging from 1×10⁵ to 4×10⁵ cells/mL. (The data are provided by Elabscience)
OXPHOS remains a dynamic, context dependent hub in cancer biology. This guide emphasizes that no single parameter suffices; the combination of oxygen consumption rate assay, mitochondrial membrane potential assay (JC-1 assay), ATP assay, and reactive oxygen species assay (ROS assay) delivers a robust oxidative phosphorylation assay strategy. Addressing these interpretative pitfalls allows researchers to obtain reproducible, biologically relevant data that accurately reflect mitochondrial function within the complextumor microenvironment.
Elabscience® Quick Overview of Popular Products:
Table 1. Overview of Elabscience® Assay Kits for Cancer OXPHOS Research
|
Cat. No. |
Product Name |
|
E-BC-F300 |
ATP Chemiluminescence Assay Kit (Double Reagent) |
|
E-BC-F004 |
ATP/ADP Ratio Chemiluminescence Assay kit |
|
E-BC-K044-M |
L-Lactic Acid (LA) Colorimetric Assay Kit |
|
E-BC-F070 |
Enhanced Oxygen Consumption Rate (OCR)Fluorometric Assay Kit |
|
E-CK-A301 |
Mitochondrial Membrane Potential Assay Kit (with JC-1) |
|
E-BC-F008 |
Mitochondrial Superoxide Fluorometric Assay Kit |
|
E-BC-K784-M |
Fatty Acid Oxidation (FAO) Colorimetric Assay Kit |
|
E-BC-K153-M |
Mitochondrial Complex Ⅴ Activity Assay Kit |
|
E-BC-K804-M |
NAD⁺/NADH Colorimetric Assay Kit (WST-8) |
|
E-BC-K838-M |
Cell Mitochondrial Complex Ⅴ (ATP Synthase) Activity Assay Kit |
|
E-BC-K138-F |
Reactive Oxygen Species (ROS) Fluorometric Assay Kit (Green) |
References:
[1] Altered Metabolism in Cancer: Insights into Energy Pathways and Therapeutic Targets. Molecular Cancer, 2024. DOI: 10.1186/s12943-024-02119-3
[2] Deregulation of Mitochondrial Gene Expression in Cancer: Mechanisms and Therapeutic Opportunities. British Journal of Cancer, 2024. DOI: 10.1038/s41416-024-02817-1
[3] Metabolic Programming and Immune Suppression in the Tumor Microenvironment. Cancer Cell, 2023. DOI: 10.1016/j.ccell.2023.01.009
[4] Hypoxia and Hypoxia Inducible Factors in Tumor Metabolism. Cancer Letters, 2015. DOI: 10.1016/j.canlet.2014.01.032
[5] Polychromatic Analysis of Mitochondrial Membrane Potential Using JC 1. Current Protocols in Cytometry, 2007. DOI: 10.1002/0471142956.cy0732s41
[6] The Use of Seahorse XF Assays to Interrogate Real Time Energy Metabolism in Cancer Cell Lines. Methods in Molecular Biology, 2022. DOI: 10.1007/978-1-0716-2376-317
[7] Approaches and Techniques to Characterize Cancer Metabolism In Vitro and In Vivo. Biochimica et Biophysica Acta (BBA) - Reviews on Cancer, 2017. DOI: 10.1016/j.bbcan.2017.08.004
[8] The Pleiotropic Functions of Reactive Oxygen Species in Cancer. Nature Cancer, 2024. DOI: 10.1038/s43018-024-00738-9

