

Mitochondria govern systemic glucose homeostasis and pancreatic β-cell insulin secretion via oxidative phosphorylation (OXPHOS), coupling electron transport to ATP synthesis while buffering reactive oxygen species within the dynamic diabetic metabolic environment. Definitive functional assessment requires an integrated oxidative phosphorylation assay panel, synergizing the oxygen consumption rate assay, ATP assay, reactive oxygen species assay, and mitochondrial dysfunction assay. This multi-parametric approach resolves context-dependent metabolic plasticity, from glucose-stimulated insulin secretion to obesity-driven adipose macrophage reprogramming, overcoming the limitations of single endpoint measurements. By distinguishing physiological ROS signaling from pathological superoxide generation and validating ETC integrity against cytokine-driven inflammation, this strategy eliminates interpretative bias.
In this context, we outline essential, physiologically optimized protocols for mitochondrial phenotyping, establishing this assay suite as a critical metabolic checkpoint for decoding insulin resistance and β-cell failure in diabetes research.
Table of Contents
1. Overview of oxidative phosphorylation dysfunction in diabetes metabolism
2. How does oxidative phosphorylation influence insulin secretion in pancreatic β cells?
3. Reactive oxygen species (ROS) generation during mitochondrial dysfunction in diabetes
4. Inflammation-induced mitochondrial dysfunction in diabetes
5. Mitochondrial metabolism in immune cells during diabetes progression
6. Experimental approaches for measuring oxidative phosphorylation in diabetes research
01 Overview of oxidative phosphorylation dysfunction in diabetes metabolism
Oxidative phosphorylation (OXPHOS) is the central metabolic pathway through which mitochondria generate ATP to sustain cellular function. In type 2 diabetes (T2D), the integrity of this system is profoundly compromised across multiple insulin-sensitive tissues. Kelley et al.[1] provided foundational evidence that skeletal muscle mitochondria from T2D patients exhibit an approximately 40% reduction in rotenone-sensitive NADH: O₂ oxidoreductase activity, reflecting impaired electron transport chain (ETC) capacity, alongside reduced citrate synthase activity and significantly smaller mitochondrial size as measured by electron microscopy. These structural and functional deficits correlated strongly with the severity of insulin resistance, supporting the concept that diminished OXPHOS capacity contributes to metabolic inflexibility, defined as the impaired ability to switch between carbohydrate and lipid oxidation in response to nutritional cues[1]. More recently, the mechanistic link between OXPHOS dysfunction and insulin resistance has been refined. Hyperinsulinaemia, a hallmark of the insulin-resistant state, drives downregulation of insulin receptors and qualitatively alters downstream signaling, selectively impairing glucose disposal while preserving lipid synthesis pathways[2]. This phenomenon, termed selective insulin resistance, is exacerbated by mitochondrial dysfunction that limits the ATP supply required for insulin-stimulated glucose metabolism. The integrative view now recognizes that OXPHOS impairment is not merely a consequence but may be an antecedent driver of the metabolic dysregulation characteristic of T2D[2].
02 How does oxidative phosphorylation influence insulin secretion in pancreatic β cells?
Pancreatic β-cells uniquely depend on OXPHOS for glucose-stimulated insulin secretion (GSIS), a reliance routinely confirmed by oxidative phosphorylation assay. Unlike most cell types, β-cells channel nearly all glycolytically derived pyruvate into mitochondrial metabolism via pyruvate dehydrogenase and pyruvate carboxylase, rendering them exquisitely sensitive to mitochondrial function[3]. The canonical model posits that increased glucose metabolism elevates the ATP/ADP ratio, closes K_ATP channels, depolarizes the plasma membrane, and triggers Ca²⁺-dependent exocytosis. This model has since been substantially refined. Methodological advances using MitoSOX Red confocal imaging, MitoB LC-MS, and mito-HyPer probes revealed a counterintuitive finding: mitochondrial matrix superoxide (O₂•⁻) release decreases upon GSIS, contrary to the expectation that elevated glucose flux increases ROS production[3]. This occurs because three redox shuttles (pyruvate/malate, pyruvate/citrate, and pyruvate/isocitrate) export reducing equivalents from the matrix to the cytosol, lowering the matrix NADH/NAD⁺ ratio and thereby reducing superoxide generation at the Complex I flavin site (I_F). Using 2chFLIM, the authors demonstrated that free mitochondrial NADH decreases by approximately 20% upon glucose stimulation while NAD⁺ increases, shifting substrate pressure away from ROS-generating conditions[3]. This mechanism couples OXPHOS activation to insulin secretion while minimizing acute oxidative damage. However, the concomitant decline in matrix NADPH may compromise long-term antioxidant capacity, a deficit detectable via mitochondrial dysfunction assay and potentially contributing to glucotoxicity in diabetes.
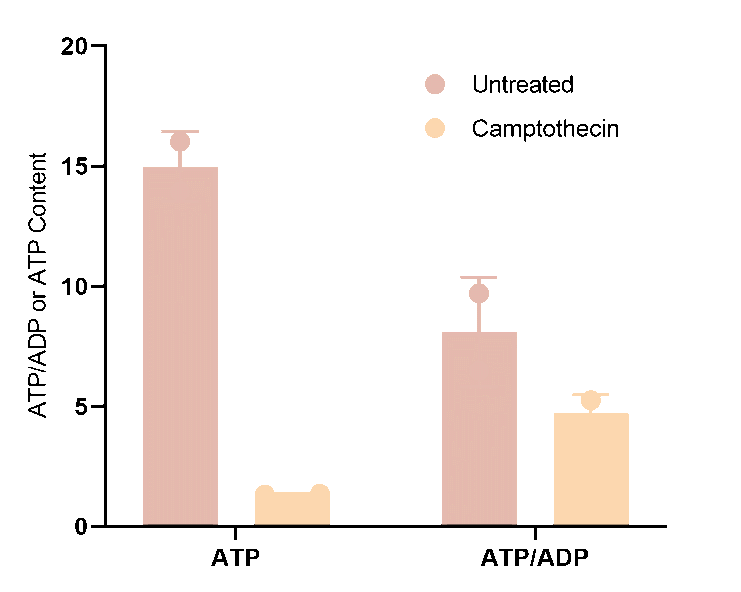
Fig. 1 After treatment with camptothecin apoptosis reagent, the ATP/ADP ratio (E-BC-F004) in 293T cells was decreased compared with untreated cells. (The data are provided by Elabscience®).
03 Reactive oxygen species (ROS) generation during mitochondrial dysfunction in diabetes
Mitochondrial ROS production is a double-edged sword in diabetes. Under physiological conditions, ROS such as H₂O₂ from NOX4 and mitochondria serve as signaling molecules required with ATP for K_ATP channel closure during GSIS[3]. However, when OXPHOS is compromised, oxidative phosphorylation assay reveals a shift toward pathological ROS. Using S1QEL and S3QEL, studies showed that at low glucose (3 mM), Complex I flavin site (I_F) predominates due to elevated NADH/NAD⁺ ratios, whereas at high glucose, Complex III outer Q site contributes up to 60% of matrix superoxide[3]. In diabetes, sustained hyperglycemia and lipid overload overwhelm redox shuttle capacity, increase NADH/NAD⁺ ratios, and make Complex I flavin site (I_F) a major source of dysregulated ROS, as detected by mitochondrial dysfunction assay. This shift is particularly detrimental in β-cells, which have intrinsically low antioxidant defenses, making them vulnerable to oxidative stress that impairs insulin secretion and promotes apoptosis[3].
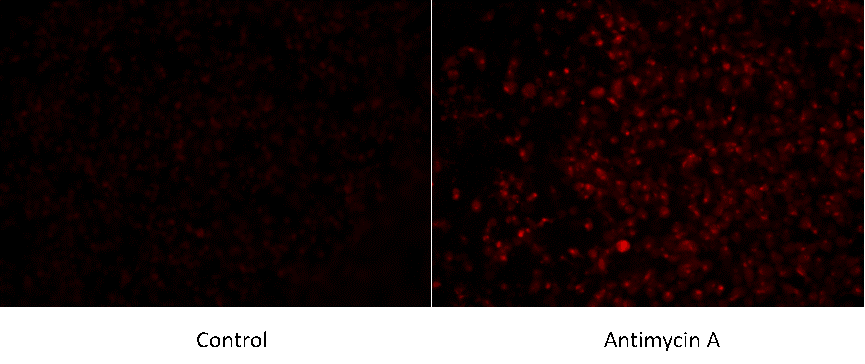
Fig. 2 HeLa cells were cultured with or without (Control) 5 μM Antimycin A for 1 h, and then changes in mitochondrial ROS were detected by mitochondrial superoxide fluorometric assay kit. (The data are provided by Elabscience®)
04 Inflammation-induced mitochondrial dysfunction in diabetes
Cytokines such as IL-1β, IL-6, and TNF-α mediate the interplay between inflammation and mitochondrial dysfunction in diabetic tissues[4]. IL-1β is a master pro-inflammatory cytokine in islets. In T2D patients, IL-1β mRNA is markedly upregulated in β-cells and correlates with blood glucose[5]. High glucose induces IL-1β expression, creating an NF-κB-driven positive feedback loop. Low concentrations of IL-1β suffice to induce IL-8 and IL-6, amplifying local inflammation. The NLRP3 inflammasome processes IL-1β in response to islet amyloid, free fatty acids, and mitochondrial ROS detected via reactive oxygen species assay. This establishes a vicious cycle where mitochondrial dysfunction generates ROS, activates NLRP3, and produces IL-1β that further impairs OXPHOS and promotes apoptosis[4].
IL-6 exhibits protective effects. Marasco et al. showed that acute IL-6 signaling reduces ROS by coupling autophagy to antioxidant responses[6]. IL-6 rapidly induces NRF2 accumulation, disrupts KEAP1 interaction, and promotes NRF2 mitochondrial translocation, triggering mitophagy. β-cell-specific IL-6 receptor knockout mice exhibit increased susceptibility to oxidative damage and hyperglycemia, confirming IL-6's protective role in vivo[6]. Conversely, TNF-α contributes to insulin resistance by activating JNK and IKK, which phosphorylate IRS1 and inhibit insulin signaling. In adipose tissue, TNF-α from M1-like macrophages reduces Complex I and III activities and increases mitochondrial ROS production, further amplifying dysfunction[7]. Collectively, IL-1β, IL-6, and TNF-α signaling converge on NF-κB, MAPK, and JAK-STAT pathways, altering mitochondrial gene expression and function[4,5].
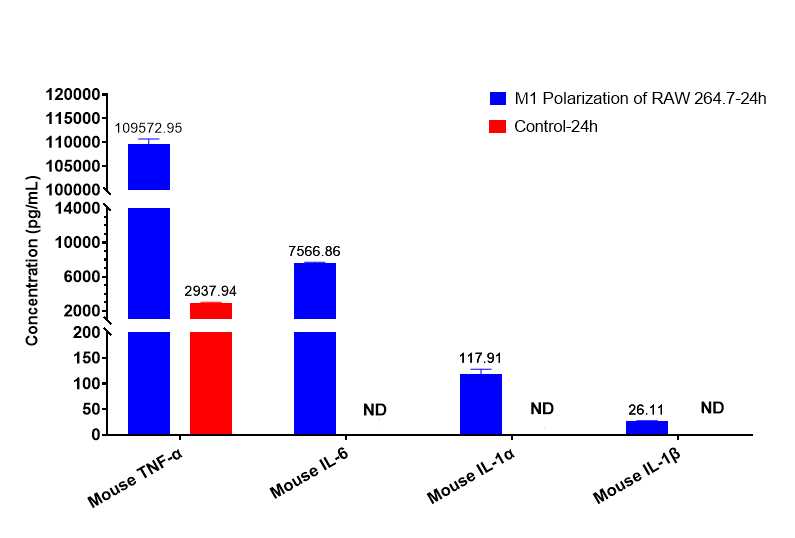
Fig. 3 RAW264.7 macrophages were polarized to M1 phenotype, and then the levels of mouse TNF‑α, IL‑6, IL‑1α, and IL‑1β in the supernatants were measured by ELISA. (The data are provided by Elabscience®)
05 Mitochondrial metabolism in immune cells during diabetes progression
Adipose tissue macrophages (ATMs) regulate obesity-induced inflammation and insulin resistance. Single-cell studies reveal ATM diversity, from TIM4⁺CD163⁺ anti-inflammatory macrophages in lean tissue to LAMs expressing CD11c, CD9, and TREM2 in obesity[7]. Metabolic reprogramming dictates ATM function. Lean ATMs rely on oxidative phosphorylation and fatty acid oxidation, maintaining an anti-inflammatory phenotype. In obesity, elevated free fatty acids, glucose, and insulin drive ATMs toward a metabolically activated phenotype (MMe) engaging glycolysis and OXPHOS[7]. Obese ATMs exhibit high glycolytic and oxidative capacity, essential for pro-inflammatory cytokine production. Myeloid-specific Crif1 deletion reduces OXPHOS, increases M1 polarization, and worsens insulin resistance, whereas IR-61 suppresses TNF-α, IL-6, and IL-1β and improves insulin sensitivity, with effects measurable via ROS assay. ATMs clear damaged mitochondria from stressed adipocytes. In brown adipose tissue, ATMs remove extracellular vesicles with defective mitochondria during thermogenesis. Obesity impairs this clearance; blocking heparan sulfate-mediated mitochondrial transfer increases adipose mass and insulin resistance, indicating mitochondrial disposal by ATMs is a homeostatic mechanism disrupted in diabetes[7].
%20and%20OCR%20were%20measured_.jpg)
Fig. 4 RAW264.7 macrophages were polarized to M1 phenotype, and then changes in extracellular acidification rate (ECAR) and OCR were measured. The results showed that ECAR (reflecting glycolytic rate) increased while OCR (reflecting OXPHOS) decreased, indicating that energy production during M1 polarization relies predominantly on enhanced glycolysis. (The data are provided by Elabscience®)
06 Experimental approaches for measuring oxidative phosphorylation in diabetes research
Assessing OXPHOS function in diabetes requires a multi-platform approach. The oxygen consumption rate assay via Seahorse XF analyzer measures OCR and ECAR in real time, while fluorescence microplate readers enable complementary high-throughput detection of OCR and ECAR using fluorescence-based sensor probes. In β-cell research, it shows that the phosphorylating-to-non-phosphorylating respiration ratio increases sharply between 3 and 8 mM glucose, matching the GSIS dose-response[3]. Sequential addition of oligomycin, FCCP, and rotenone/antimycin A calculates ATP-linked respiration, maximal respiration, and spare capacity. ATP assay using luciferase-based detection complements these measurements. Seahorse in islets requires optimization of cell number and attachment conditions.
Electron Paramagnetic Resonance (EPR) spectroscopy simultaneously measures OCR and superoxide using ¹⁵N-PDT as oxygen sensor and ¹⁴N-CMH as superoxide probe[8]. The Mitotoolbox approach enables dual measurement in isolated mitochondria or whole cells. PEG-SOD controls distinguish superoxide-specific signals, making this valuable when mitochondrial ROS and OCR must be assessed together[8].
Oxidative stress assay platforms include multiple fluorescence-based probes.MitoSOX Red is a mitochondria-targeted hydroethidine probe commonly used to assess mitochondrial superoxide production. MitoB accumulates in mitochondria and oxidizes to MitoP by H₂O₂, allowing LC-MS quantification over hours[3]. Genetically encoded sensors such as mito-HyPer and roGFP2-Orp1 provide real-time, compartment-specific redox measurements.
Cytokine detection methods quantify inflammatory mediators. Cytokine ELISA assay remains the gold standard for single-analyte measurement. IL-1β ELISA is challenging because IL-1β binds soluble receptors that mask detection and is released at picogram-per-milliliter concentrations[5]. IL-6 and TNF-α ELISAs are more robust. Multiplex platforms (cytometric bead array or Luminex) enable simultaneous measurement from small volumes, reducing sample requirements by 75% compared to individual ELISAs[9]. Intracellular cytokine staining with flow cytometry identifies cytokine-producing cell types at single-cell resolution, revealing that islet macrophages are the primary IL-1β source in amyloid-forming models, while β-cells contribute under glucotoxic conditions[4,5].
Methodological considerations include the alamethicin-based assay, which forms transmembrane pores allowing exogenous NADH access to Complex I without disrupting the respiratory chain[1]. This enables measurement of rotenone-sensitive NADH: O₂ oxidoreductase activity in frozen muscle biopsies, correlating with insulin sensitivity. Optimized mitochondrial isolation using KCl/pyrophosphate treatment avoids yield bias from limited tissue samples.
Elabscience® Quick Overview of Popular Products:
Table 1. Assay kits for diabetes research
|
Cat. No. |
Product Name |
|
E-EL-H2665 |
Human INS(Insulin) ELISA Kit |
|
E-EL-M3119 |
Mouse INS(Insulin) ELISA Kit |
|
E-BC-F300 |
ATP Chemiluminescence Assay Kit (Double Reagent) |
|
E-BC-F004 |
ATP/ADP Ratio Chemiluminescence Assay kit |
|
E-EL-H0109 |
Human TNF-α(Tumor Necrosis Factor Alpha) ELISA Kit |
|
E-BC-F070 |
Enhanced Oxygen Consumption Rate (OCR)Fluorometric Assay Kit |
|
E-EL-H0149 |
Human IL-1β(Interleukin 1 Beta) ELISA Kit |
|
E-BC-F008 |
Mitochondrial Superoxide Fluorometric Assay Kit |
|
E-BC-K784-M |
Fatty Acid Oxidation (FAO) Colorimetric Assay Kit |
|
E-BC-K153-M |
Mitochondrial Complex Ⅴ Activity Assay Kit |
|
E-BC-K804-M |
NAD⁺/NADH Colorimetric Assay Kit (WST-8) |
|
E-BC-K838-M |
Cell Mitochondrial Complex Ⅴ (ATP Synthase) Activity Assay Kit |
|
E-BC-K138-F |
Reactive Oxygen Species (ROS) Fluorometric Assay Kit (Green) |
References:
[1]Kelley, D.E., et al., Dysfunction of Mitochondria in Human Skeletal Muscle in Type 2 Diabetes. Diabetes, 2002. 51(10):2944-2950
DOI: 10.2337/diabetes.51.10.2944
[2]Accili, D., et al., Insulin Resistance in Type 2 Diabetes Mellitus. Nature Reviews Endocrinology, 2025. 21(7):385-400
DOI: 10.1038/s41574-025-01114-y
[3]Ježek, P., et al., Mitochondrial Superoxide Production Decreases on Glucose-Stimulated Insulin Secretion in Pancreatic β Cells Due to Decreasing Mitochondrial Matrix NADH/NAD⁺ Ratio. Antioxidants and Redox Signaling, 2020. 33(7):480-515
DOI: 10.1089/ars.2019.7800
[4]Donath, M.Y., et al., New Insights Into the Mechanisms of Islet Inflammation in Type 2 Diabetes. Diabetes, 2015. 64(6):1888-1890
DOI: 10.2337/db14-1903
[5]Boni-Schnetzler, M., et al., Increased Interleukin (IL)-1β Messenger Ribonucleic Acid Expression in β-Cells of Individuals with Type 2 Diabetes and Regulation of IL-1β in Human Islets by Glucose and Autostimulation. The Journal of Clinical Endocrinology and Metabolism, 2008. 93(11):4065-4074
DOI: 10.1210/jc.2008-0396
[6]Marasco, M.R., et al., Interleukin-6 Reduces β-Cell Oxidative Stress by Linking Autophagy With the Antioxidant Response. Diabetes, 2018. 67(8):1576-1588
DOI: 10.2337/db17-1280
[7]Weinstock, A., et al., Adipose Tissue Macrophages: Regulators of Adipose Tissue Immunometabolism During Obesity. Molecular Metabolism, 2022. 66:101642
DOI: 10.1016/j.molmet.2022.101642
[8]Gallez, B., et al., Measurement of Mitochondrial (Dys)Function in Cellular Systems Using Electron Paramagnetic Resonance (EPR): Oxygen Consumption Rate and Superoxide Production. Methods in Molecular Biology, 2022. 2497:75-88
DOI: 10.1007/978-1-0716-2309-1_5
[9]Pfefferle, P.I., et al., Analytical Performance of a Multiplexed, Bead-Based Cytokine Detection System in Small Volume Samples. Clinical Chemistry and Laboratory Medicine, 2011. 49(10):1691-1695
DOI: 10.1515/cclm.2011.631

